USA Lobbying on Hospitality & Retail - Washington (Q1 2026)





AMAZON.COM Services Llc; National Retail Federation; US Chamber of Commerce; Business Roundtable; CVS Health; National Federation of Independent Business were unusually active lobbyists this quarter.
View the interactive network in Queen Street Analytics →
Each quarter we track movements in US federal lobbying, channel by channel. This edition covers Hospitality & Retail for Q1 of 2026, ranking the organizations, government entities, issues, and lobbyists whose disclosed spend moved most.
Central Themes in this Quarter’s Lobby Data
Major Events and Travel Boom Shape Sector Advocacy
Hotels, travel companies, and retail chains are stepping up lobbying in light of high-profile 2026 events like the FIFA World Cup and America250 celebrations, which are expected to drive a significant rebound in hospitality demand. The U.S. Travel Association has been active with the Dept of Homeland Security and the Dept of Commerce as industry projections show nearly $805 billion in travel spending and substantial job growth, drawing attention to ongoing policy debates around costs and labor. Multiple reports suggest this optimism overlaps with a sharp upturn in sector lobbying activity, including efforts by the National Small Business Association before the House of Representatives.
📎 AHLA Releases 2026 State Of The Industry Report - Hospitality Net · US Hospitality Directions: May 2026 - PwC · U.S. Hospitality Outlook Report | 2026 | Colliers
Labor Cost Surges and New Wage Laws Prompt Industry Pushback
Rising minimum wages, new leave mandates, and talk of even higher urban wage floors are fueling hotel and retail advocacy efforts—such as those by the National Retail Federation with the Equal Employment Opportunity Commission (EEOC), NFIB (National Federation of Independent Business) at the Department of Labor (DOL), and the Chamber of Commerce of the U.S.A. before the Executive Office of the President—aimed at shaping labor and employment policies. Operators cite a challenging mix of labor shortages and policy changes as central hurdles in 2026, coinciding with a marked increase in lobbying spend on wage and workplace issues.
📎 The latest hotel regulation news · Current Trends: How the Law is Shaping Hotels and Restaurants in 2026 · 2026 State of The Industry | AHLA
Tariffs and Supply Chain Disruptions Drive Policy Advocacy
With tariffs hovering near multi-decade highs and supply chain unpredictability affecting both retail and hospitality, industry leaders such as the Chamber of Commerce of the U.S.A. appear to be ramping up efforts to address trade and procurement rules with the U.S. Trade Representative (USTR). Major retailers are reportedly lobbying on textile tariffs, Buy American provisions, and related issues, reflecting growing concern within sector legal and operational strategies.
📎 Key Hospitality Trends and Challenges for 2026 | ArentFox Schiff · 2026 Hospitality Outlook - marcusmillichap.com · The latest hotel regulation news
Scrutiny on Fees Intensifies Regulatory and Lobbying Response
Federal regulators have ramped up oversight of "junk fees" and deceptive pricing, prompting hospitality and retail firms, alongside the Chamber of Commerce of the U.S.A., to intensify lobbying to influence new rules at agencies such as the Federal Trade Commission (FTC). As requirements for price transparency expand, industry groups are reportedly pushing for clarification and adjustment of compliance obligations with the House of Representatives.
📎 Current Trends: How the Law is Shaping Hotels and Restaurants in 2026 · What are AHLA’s top 2026 policy priorities? Its chief advocacy officer ...
Rapid AI Uptake and Antitrust Scrutiny Spark New Policy Campaigns
The widespread adoption of AI tools in both hospitality and retail is drawing heightened antitrust scrutiny and spurring fresh lobbying on tech and competition policies, with the Chamber of Commerce of the U.S.A. recently engaging the Federal Trade Commission (FTC) and the Department of Commerce (DOC) on related legislative issues. Legal analysts point to investigations and proposed rules around AI-driven software, with industry advocates, including the Chamber of Commerce of the U.S.A., pressing for clear technology policy and safeguards against overregulation.
📎 Key Hospitality Trends and Challenges for 2026 | ArentFox Schiff · US Hospitality Directions: May 2026 - PwC

Section A: Lobbying Spend by Industry
How much each industry in this channel spent on federal lobbying in Q1 of 2026, compared with its average over the prior six quarters.
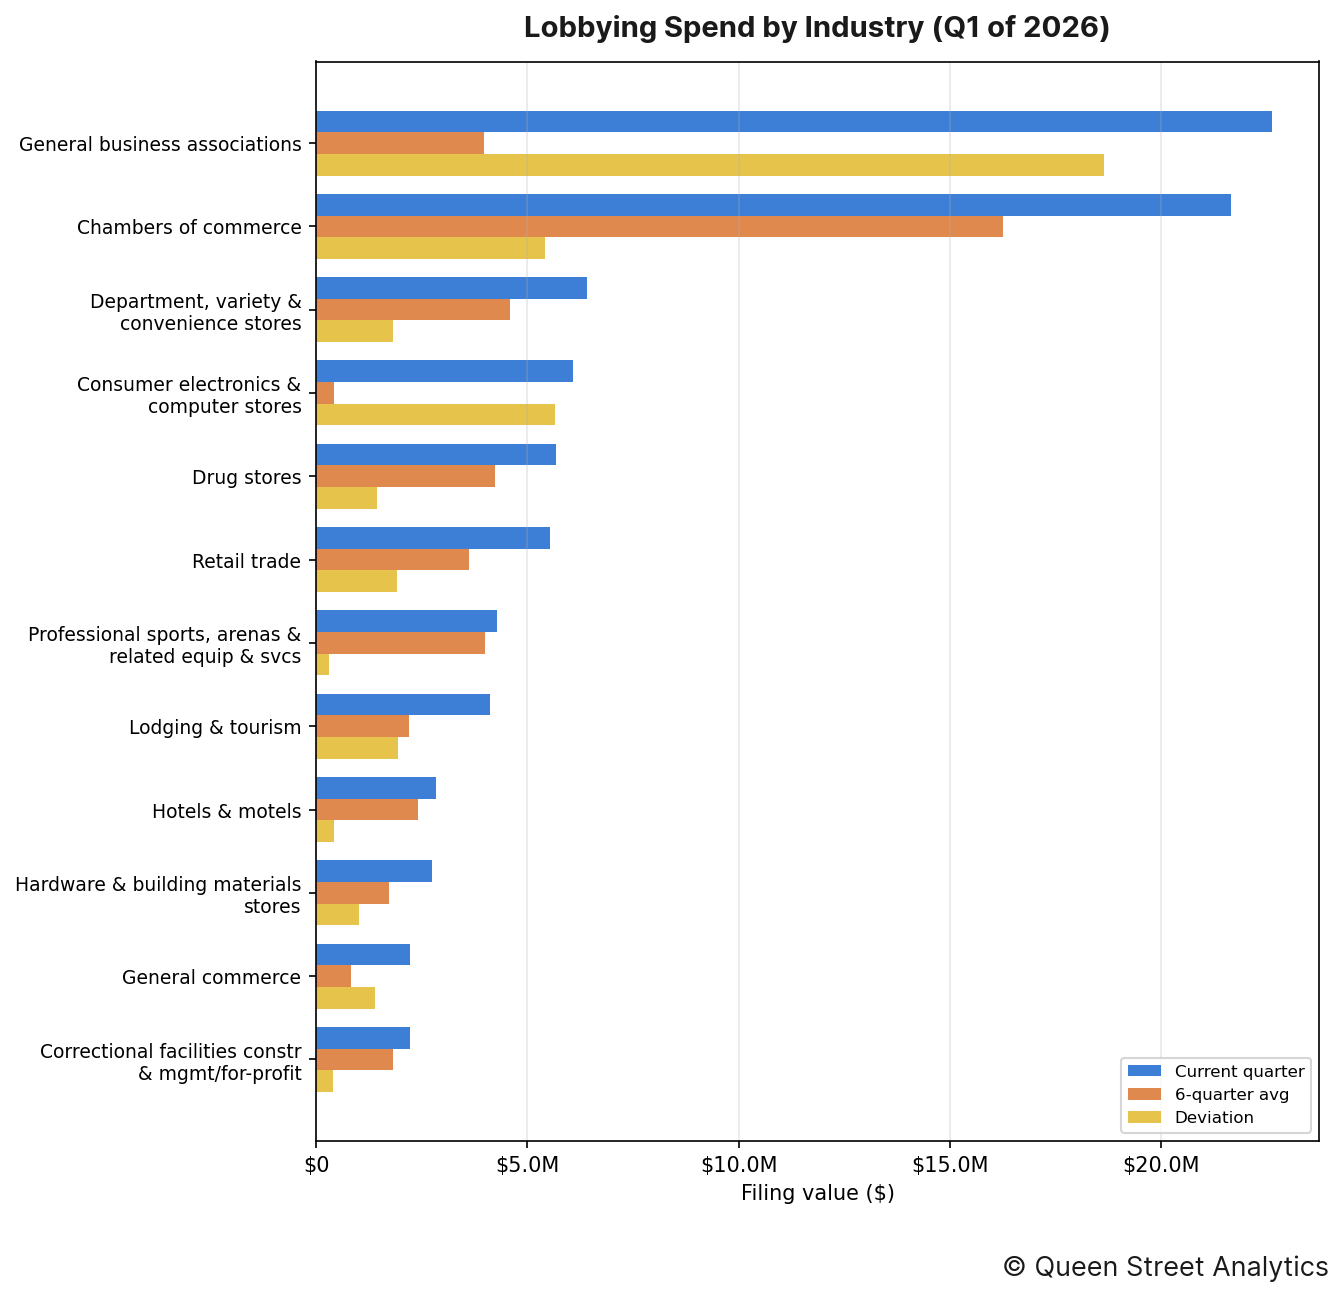
In Q1 of 2026, there was $101.6M worth of disclosed lobbying activity on Hospitality & Retail, 43% higher than the recent quarterly average of $70.8M. This activity can be broken down by industry as follows:
↳ There was $22.6M worth of General business associations lobbying, 468% higher than the recent quarterly average of $4.0M.
↳ There was $21.7M worth of Chambers of commerce lobbying, 33% higher than the recent quarterly average of $16.2M.
↳ There was $6.4M worth of Department, variety & convenience stores lobbying, 40% higher than the recent quarterly average of $4.6M.
↳ There was $6.1M worth of Consumer electronics & computer stores lobbying, 1307% higher than the recent quarterly average of $432k.
↳ There was $5.7M worth of Drug stores lobbying, 34% higher than the recent quarterly average of $4.2M.
↳ There was $5.5M worth of Retail trade lobbying, 53% higher than the recent quarterly average of $3.6M.
Section B: Lobbying Spend Trend
This channel's total disclosed lobbying spend across recent quarters, aggregated over all of its industries.
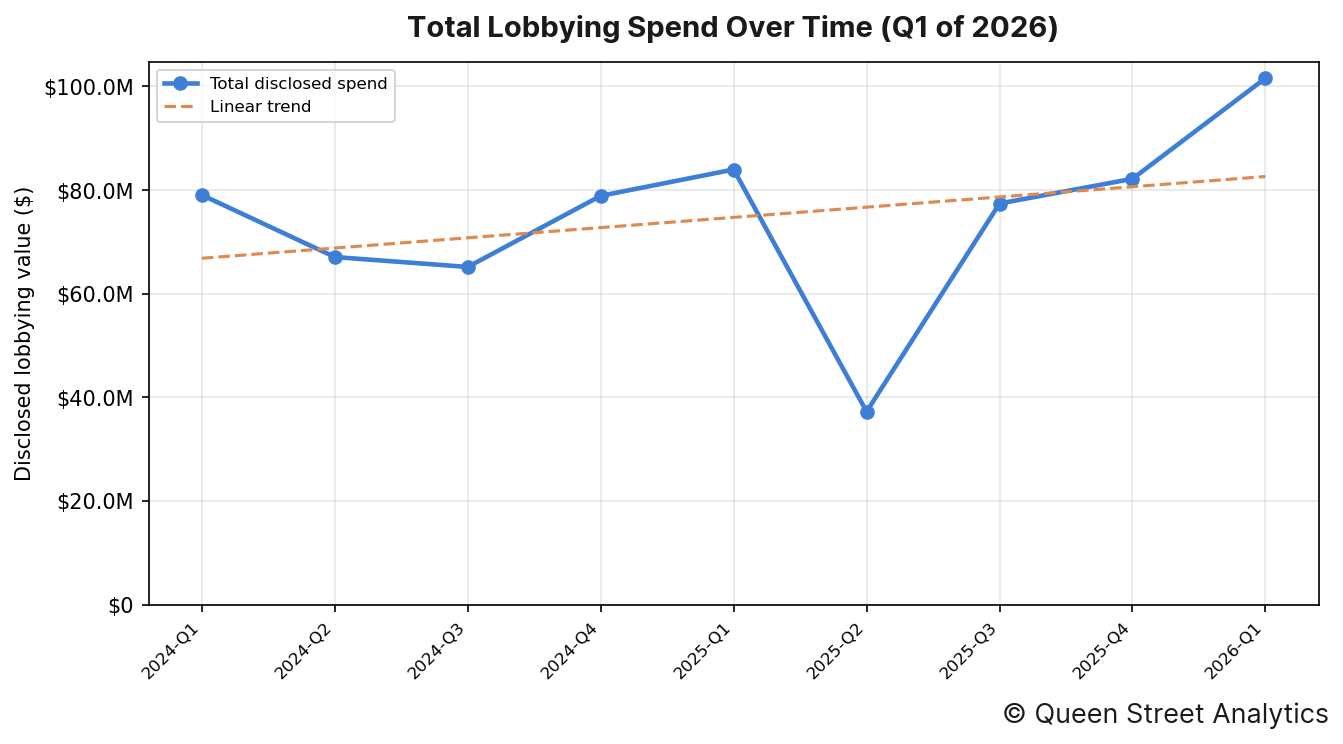
In Q1 of 2026, there was $101.6M worth of disclosed lobbying activity on Hospitality & Retail. Across the 9 quarters shown, the channel's total disclosed spend has risen over this period.
Organizations' Lobby Spend
The image below shows the organizations whose lobbying spend moved most from their six-quarter average.
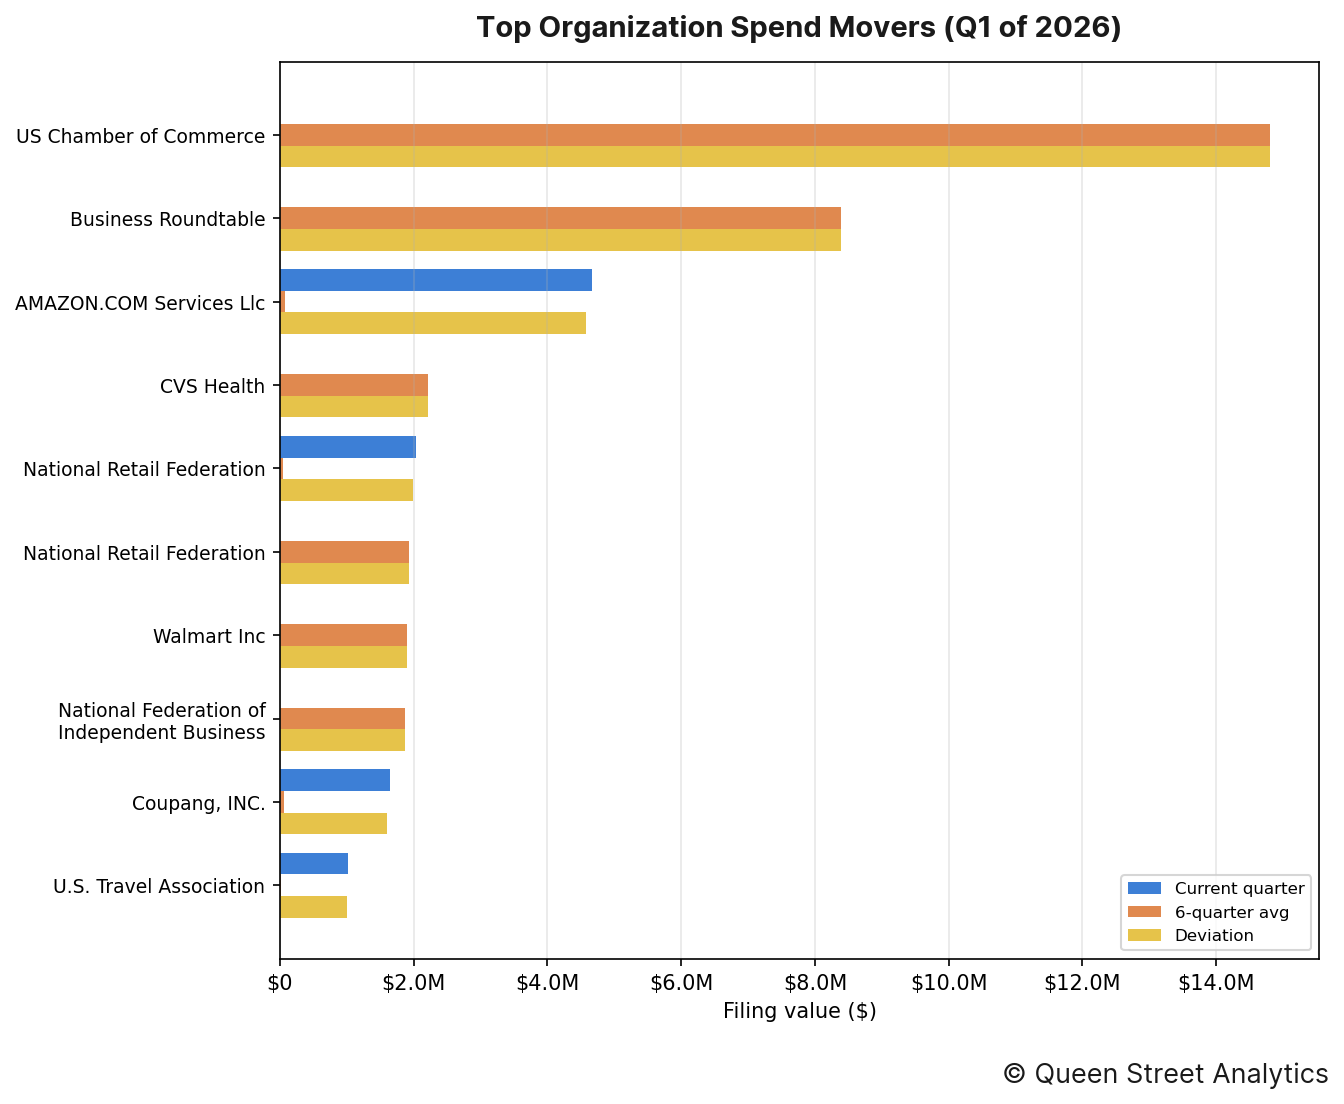
The organizations whose spending moved most from their own recent quarterly average were as follows:
↳ US Chamber of Commerce accounted for $0 in disclosed lobbying, 100% lower than the recent quarterly average of $14.8M.
↳ Business Roundtable accounted for $0 in disclosed lobbying, 100% lower than the recent quarterly average of $8.4M.
↳ AMAZON.COM Services Llc accounted for $4.7M in disclosed lobbying, 5725% higher than the recent quarterly average of $80k.
↳ CVS Health accounted for $0 in disclosed lobbying, 100% lower than the recent quarterly average of $2.2M.
↳ National Retail Federation accounted for $2.0M in disclosed lobbying, 4263% higher than the recent quarterly average of $47k.
↳ National Retail Federation accounted for $0 in disclosed lobbying, 100% lower than the recent quarterly average of $1.9M.
Section D: Government Entities Lobbied
This section documents this quarter's most lobbied federal government departments.
By industry
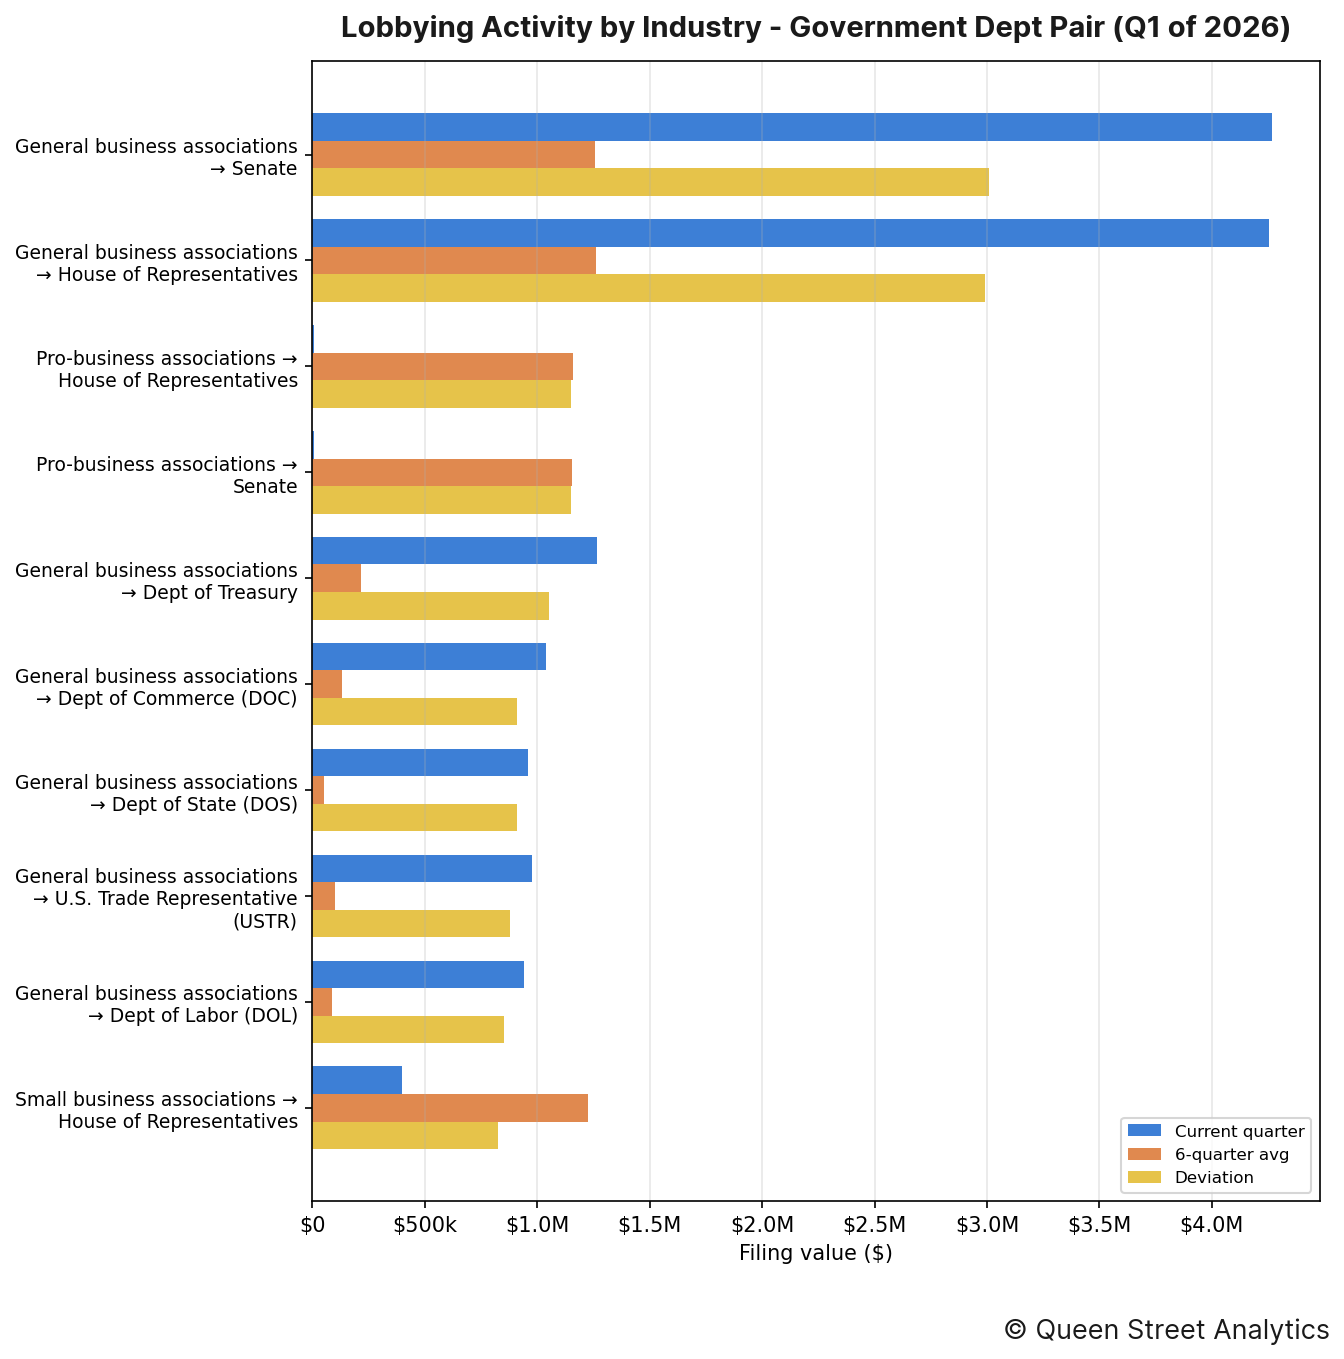
The industry–entity pairings that moved most this quarter were as follows:
↳ General business associations directed $4.3M of lobbying toward Senate, 240% higher than the recent quarterly average of $1.3M.
↳ General business associations directed $4.3M of lobbying toward House of Representatives, 238% higher than the recent quarterly average of $1.3M.
↳ Pro-business associations directed $7k of lobbying toward House of Representatives, 99% lower than the recent quarterly average of $1.2M.
By organization
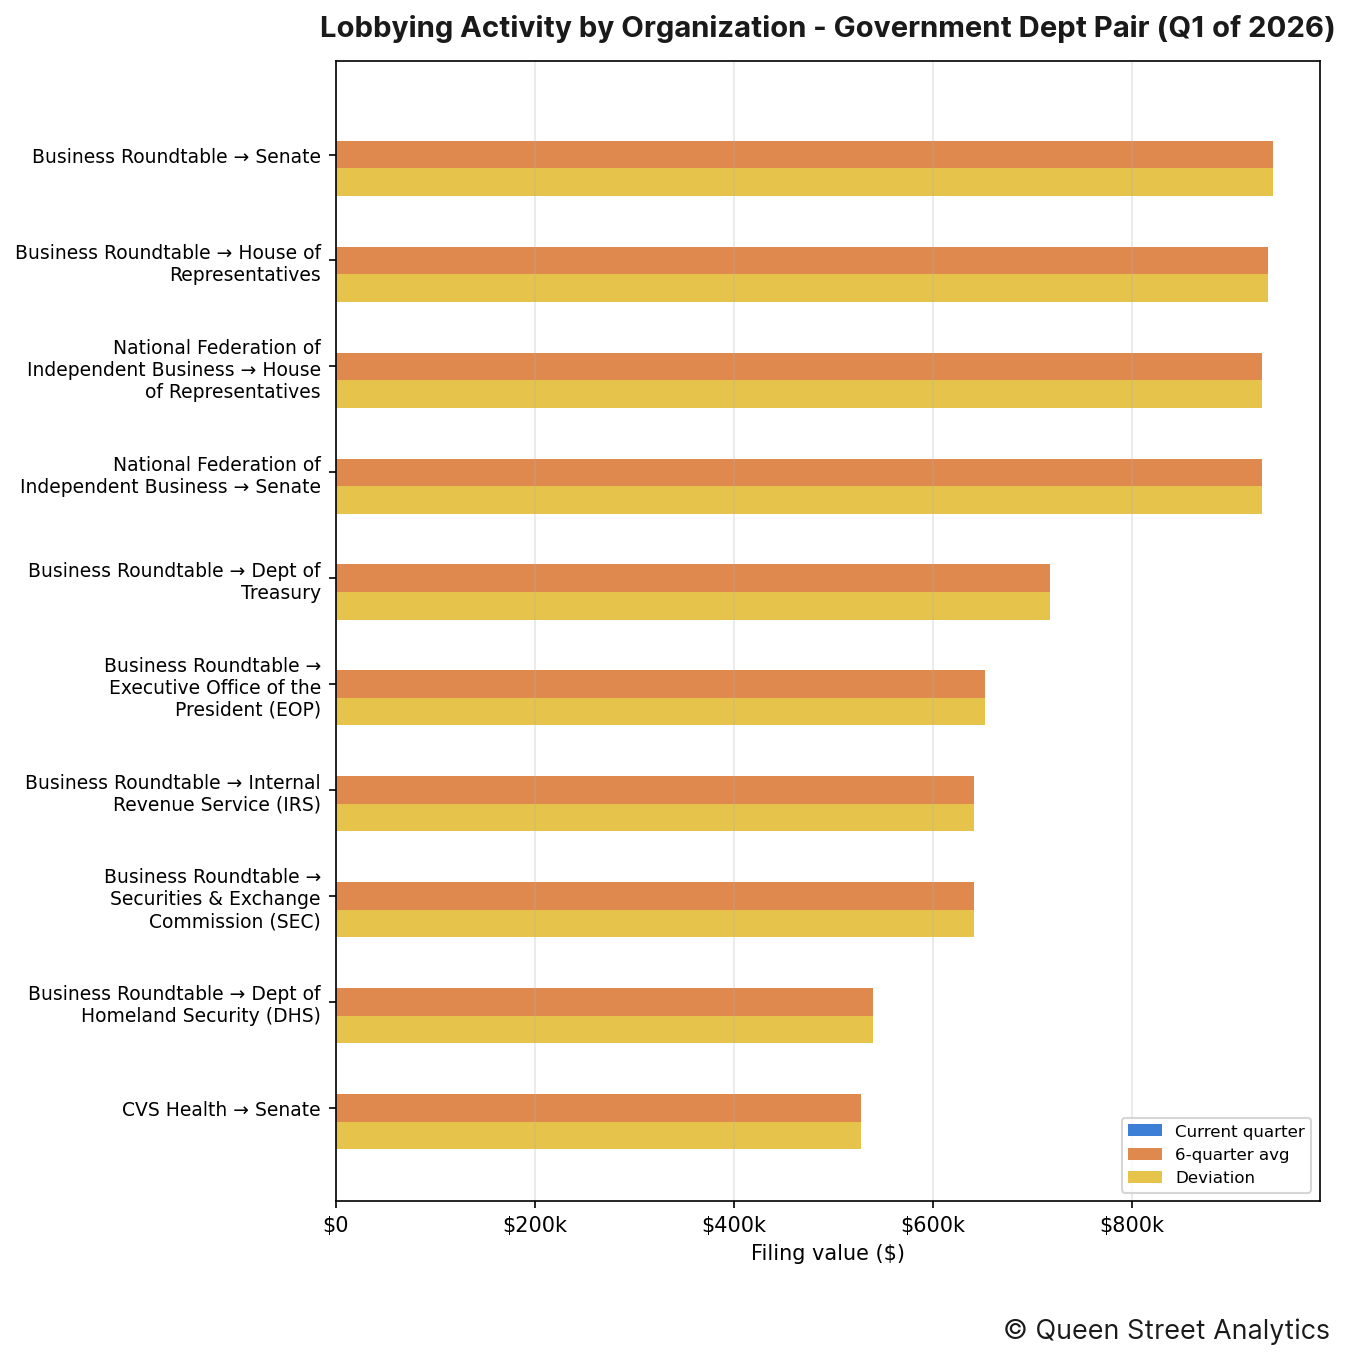
The organization–entity pairings that moved most this quarter were as follows:
↳ Business Roundtable directed $0 of lobbying toward Senate, 100% lower than the recent quarterly average of $942k.
↳ Business Roundtable directed $0 of lobbying toward House of Representatives, 100% lower than the recent quarterly average of $937k.
↳ National Federation of Independent Business directed $0 of lobbying toward House of Representatives, 100% lower than the recent quarterly average of $931k.
Section E: Lobbying Issues
This section documents this quarter's most lobbied-on issues.
By industry
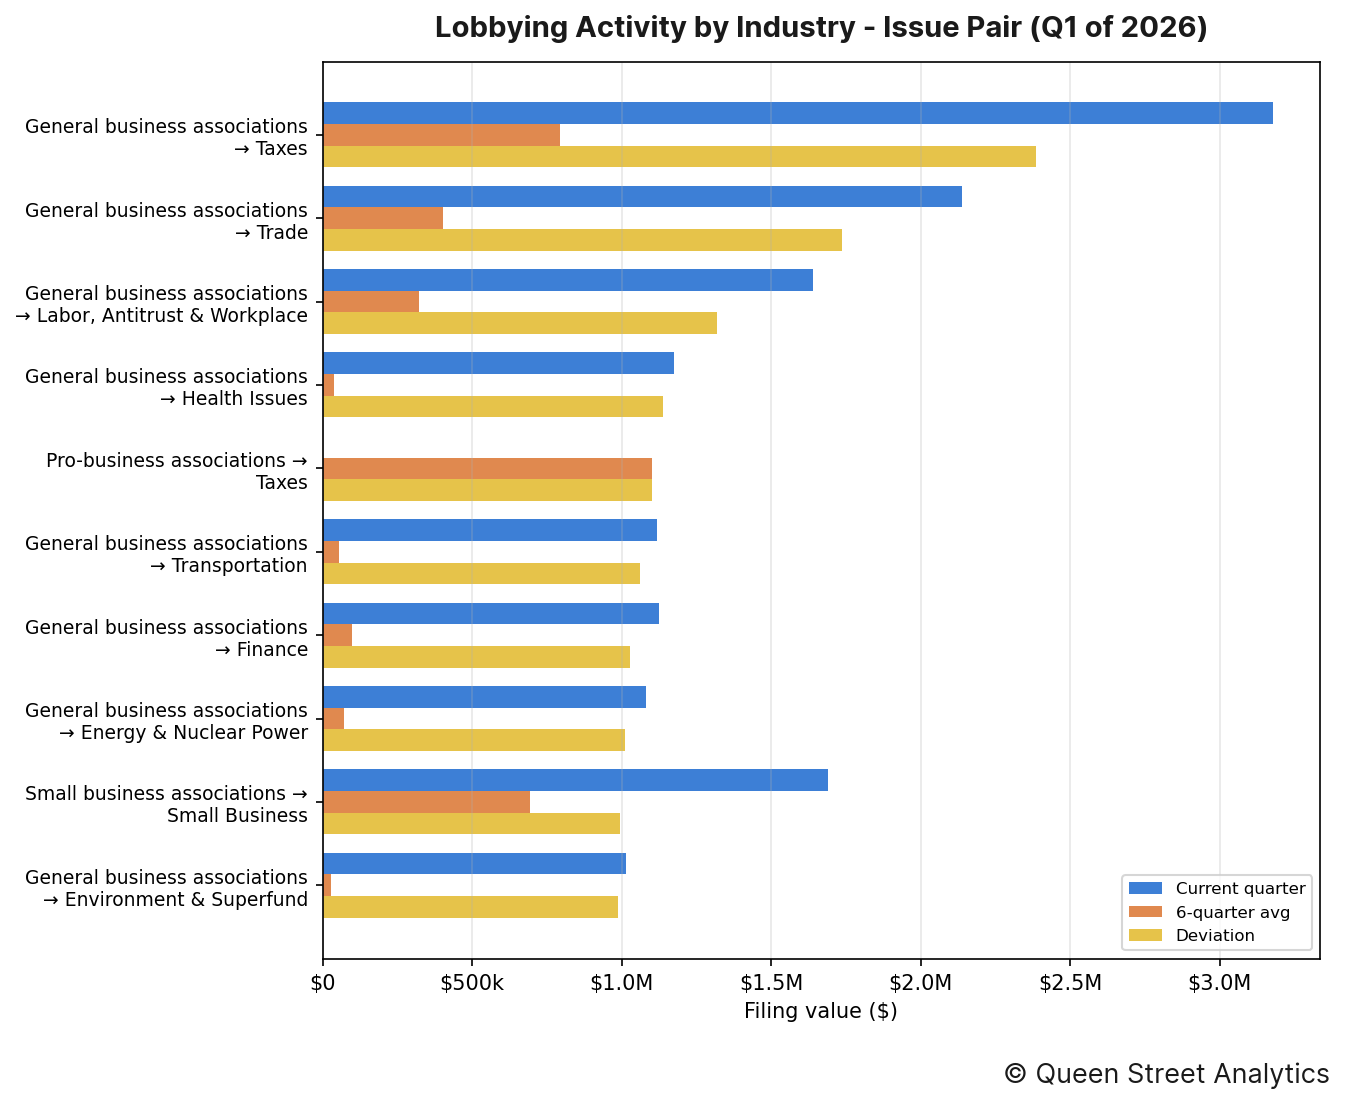
The industry–issue pairings that moved most this quarter were as follows:
↳ General business associations put $3.2M toward lobbying on Taxes, 301% higher than the recent quarterly average of $793k.
↳ General business associations put $2.1M toward lobbying on Trade, 430% higher than the recent quarterly average of $404k.
↳ General business associations put $1.6M toward lobbying on Labor, Antitrust & Workplace, 410% higher than the recent quarterly average of $322k.
By organization
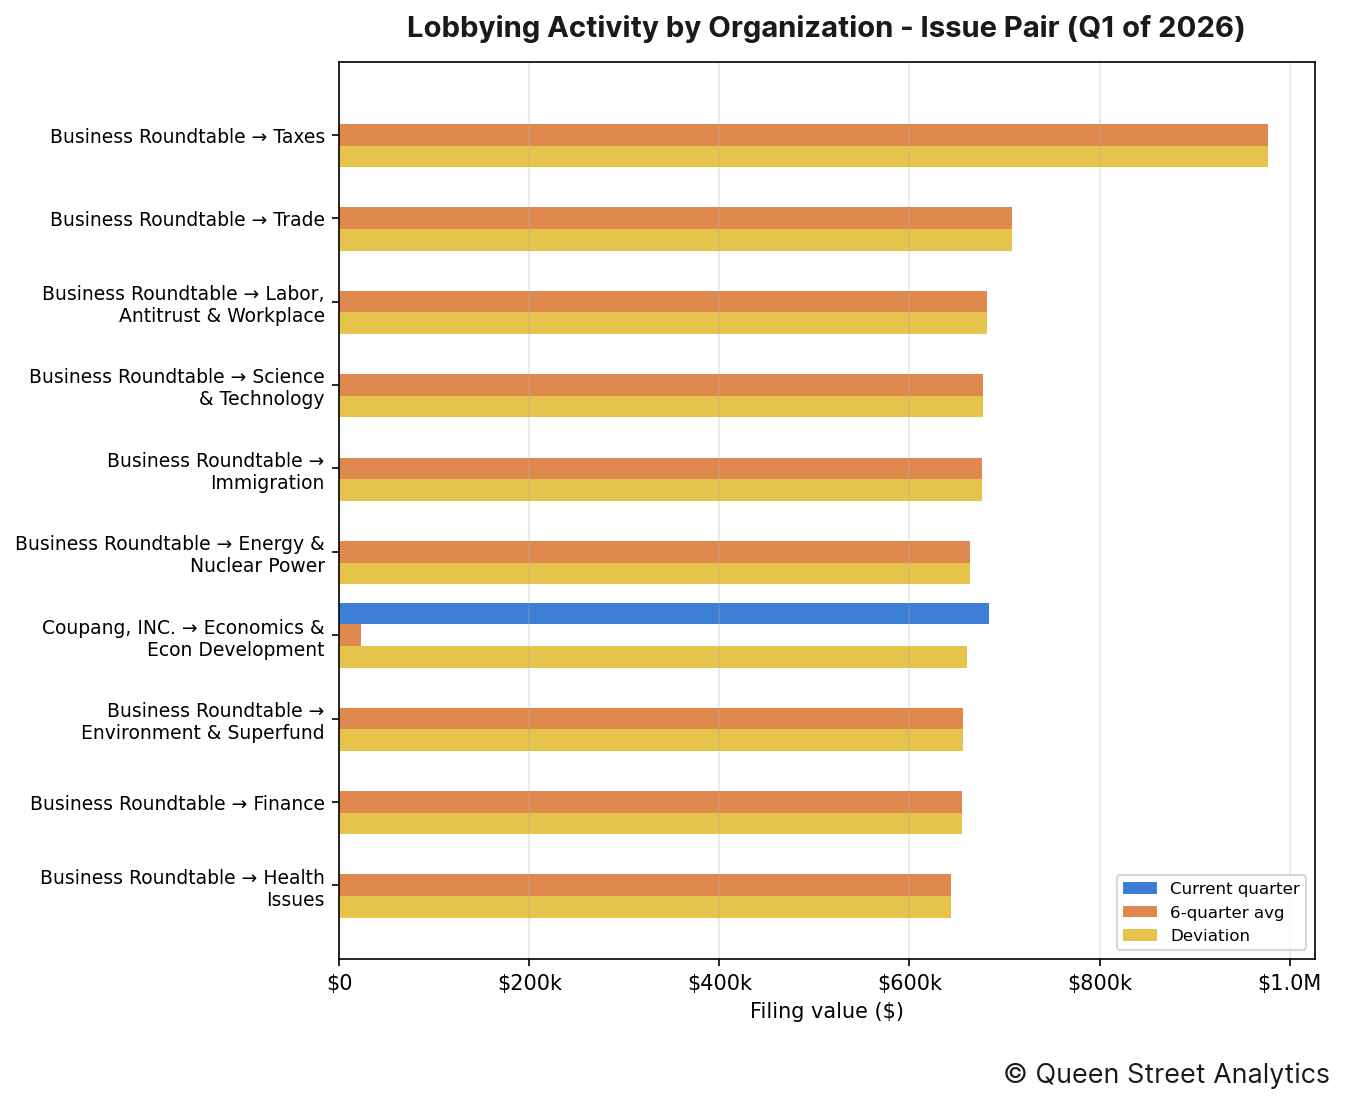
The organization–issue pairings that moved most this quarter were as follows:
↳ Business Roundtable put $0 toward lobbying on Taxes, 100% lower than the recent quarterly average of $978k.
↳ Business Roundtable put $0 toward lobbying on Trade, 100% lower than the recent quarterly average of $707k.
↳ Business Roundtable put $0 toward lobbying on Labor, Antitrust & Workplace, 100% lower than the recent quarterly average of $682k.
Section F: Most-Active Lobbyists
The figure below lists the lobbyists who managed the most imputed lobbying value this quarter, alongside their firm or organization. Because a filing's value is split evenly across the lobbyists it names, these dollar figures are imputed rather than directly disclosed.
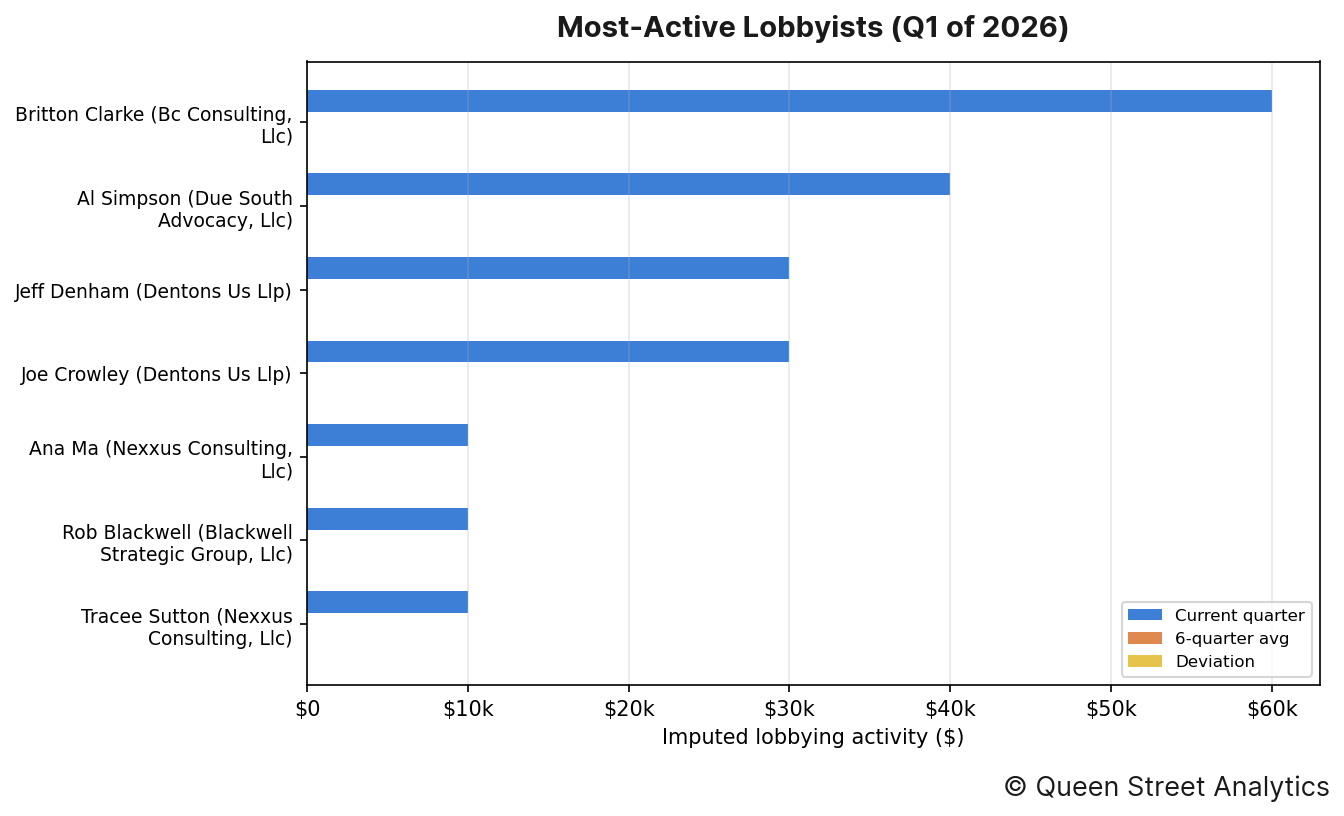
The lobbyists who managed the most imputed lobbying value this quarter were as follows:
↳ Britton Clarke (Bc Consulting, Llc) was credited with an imputed $60k in lobbying activity.
↳ Al Simpson (Due South Advocacy, Llc) was credited with an imputed $40k in lobbying activity.
↳ Jeff Denham (Dentons Us Llp) was credited with an imputed $30k in lobbying activity.
↳ Joe Crowley (Dentons Us Llp) was credited with an imputed $30k in lobbying activity.
↳ Ana Ma (Nexxus Consulting, Llc) was credited with an imputed $10k in lobbying activity.
Section G: Organization Network
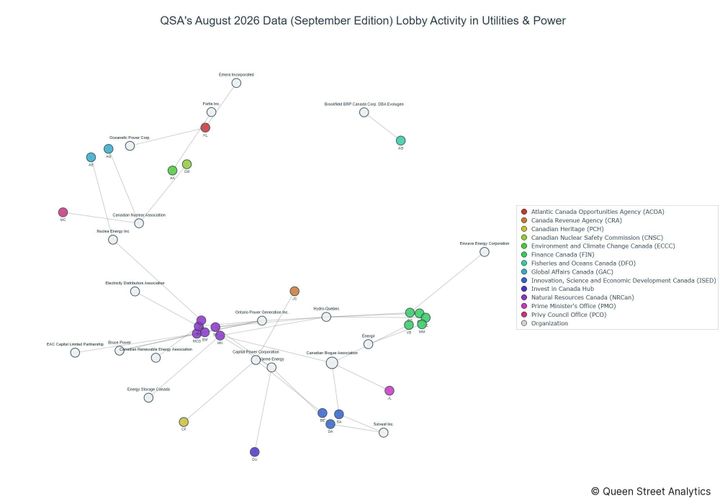
The header image for this edition maps how this channel's organizations (neutral nodes) connect to the federal entities they lobbied (colored nodes) this quarter. A link's weight is the filing value directed to that entity, and node size reflects total value; the House and Senate are excluded (nearly every organization lobbies them) so the specialized targets stand out.
The most widely lobbied entity this quarter was White House Office, which was lobbied by 16 organizations.
Methodology
Every figure in this report starts from one number: the disclosed value of each lobbying filing, which we take as the income a registrant reported plus any in-house expenses (income + expenses) on its quarterly US Senate and House LDA disclosure. Before totalling anything we clean the filings — applying each amendment over the original it replaces, removing duplicates, and setting aside non-standard records such as registrations and terminations — and map every filing to a lobbying channel and industry using the organization's CRP industry code.
How the money is divided. A filing's full value counts once toward the organization that paid it and that organization's industry, so the industry and organization rankings (Sections A–C) reflect whole dollars. But a single filing usually names several government entities, several issue areas, and several lobbyists at once, and the disclosure never says how the fee was split among them. Rather than credit the full amount to each — which would count the same dollars over and over — we divide a filing's value evenly across the distinct items it names. So a $200,000 filing that lists four agencies contributes $50,000 to each in Section D, and the same even split is applied across issues in Section E and across lobbyists in Section F. That way every section's totals trace back to the same underlying money without double-counting.
Reading the movements. A “deviation” compares the quarter's value to the average of the prior six quarters, so a rise or fall is measured against an entity's own recent norm rather than against the rest of the field. Section B takes the wider view: it sums every industry into one channel total and plots it quarter by quarter, with a fitted line showing the overall direction of travel. Source: US Senate and House LDA disclosures.