USA Lobbying on Manufacturing - Washington (Q2 2026)





Super Micro Computer INC, Solstice Advanced Materials INC, and Micron Technology INC were unusually active lobbyists this quarter.
View the interactive network in Queen Street Analytics →
Each quarter we track movements in US federal lobbying, channel by channel. This edition covers Manufacturing for Q2 of 2026, ranking the organizations, government entities, issues, and lobbyists whose disclosed spend moved most.
Central Themes in this Quarter’s Lobby Data
Trade Policy Shifts Drive Intensified Advocacy
Ongoing federal trade policy actions—including Section 301/232 tariff reviews and uncertainty over the USMCA—coincide with a noticeable rise in manufacturer lobbying activity, as exemplified by the American Apparel & Footwear Assn’s intensified engagement with the Department of Commerce and Executive Office of the President. Several major sub-sectors, notably those reliant on global supply chains, appear to be stepping up advocacy to influence tariff, export control, and localization rules amid heightened scrutiny.
📎 THE PRESIDENT’S 2026 TRADE POLICY AGENDA - United States Trade ... · 2026 in manufacturing: Policy risks and opportunities · Manufacturers Face Flat Growth & Rising Costs in 2026
Semiconductor and High-Tech Lobbying Surges Alongside CHIPS Act Rollout
Major public and private investments, catalyzed by the CHIPS Act and new federal incentives, appear to be prompting semiconductor and electronics firms—alongside organizations like the American Apparel & Footwear Assn, which has engaged with the Dept of Commerce on trade issues—to ramp up lobbying. High-profile companies, such as TSMC and Super Micro Computer, are seeking to influence export control policies and secure favorable outcomes for federal contracts and program execution, while industry players including Lyondell Chemical have lobbied the House of Representatives regarding related federal regulations.
📎 US Manufacturing Investment Tracker 2026 | IndustrialSage · Explore U.S. Manufacturing Policy Evolutions: 2025–2026 · 2026 Manufacturing Industry Outlook | Deloitte Insights
Tax Policy Reforms Spur Coordinated Advocacy on Credits and Deductions
Manufacturers, including the American Apparel & Footwear Assn, have substantially increased advocacy around the sweeping 2026 tax reform, focusing on immediate expensing, energy credits, and R&D deductions through engagements with entities such as the Dept of Commerce (DOC) and the Centers For Disease Control & Prevention (CDC). Industry filings suggest targeted efforts to guide IRS and Congressional implementation, aiming to expand eligibility for facility upgrades and automation incentives.
📎 2026 Industry Outlook: The 5 “Ts” Transforming Manufactu · 2026 Manufacturing Industry Outlook | Deloitte Insights · 2026 in manufacturing: Policy risks and opportunities
Chemical and Sustainability Regulation Fuel Increased Compliance Lobbying
Federal reviews of chemicals and stricter rules around fragrances and minerals for consumer products are triggering heightened lobbying angles, especially from toiletries and personal care manufacturers such as the American Apparel & Footwear Assn. Recent filings show the American Apparel & Footwear Assn is actively engaging with the Environmental Protection Agency (EPA) and the Consumer Product Safety Commission (CPSC). Regulatory uncertainty appears to be driving efforts to shape rule timelines and protect continued product access.
📎 2026 in manufacturing: Policy risks and opportunities · Manufacturing Grants 2026: Federal Funding for Industry and Innovation
Reshoring Wave and Workforce Gaps See Tech-Driven Policy Push
Historic levels of manufacturing investment—especially in advanced sectors—are being mirrored by lobbying campaigns from the American Apparel & Footwear Assn, which has engaged the Department of Commerce and the Equal Employment Opportunity Commission, concerned with reshoring, workforce shortages, and regulatory complexity. Technology and legacy firms alike are seeking to ensure federal support for automation, capacity expansion, and skills training.
📎 US Manufacturing Investment Tracker 2026 | IndustrialSage · AI, Tariffs, and a Talent Cliff: The State of U.S. Manufacturing in 2026 · Trump Effect: American Manufacturing Is Roaring Back as Factory ...

Section A: Lobbying Spend by Industry
How much each industry in this channel spent on federal lobbying in Q2 of 2026, compared with its average over the prior six quarters.
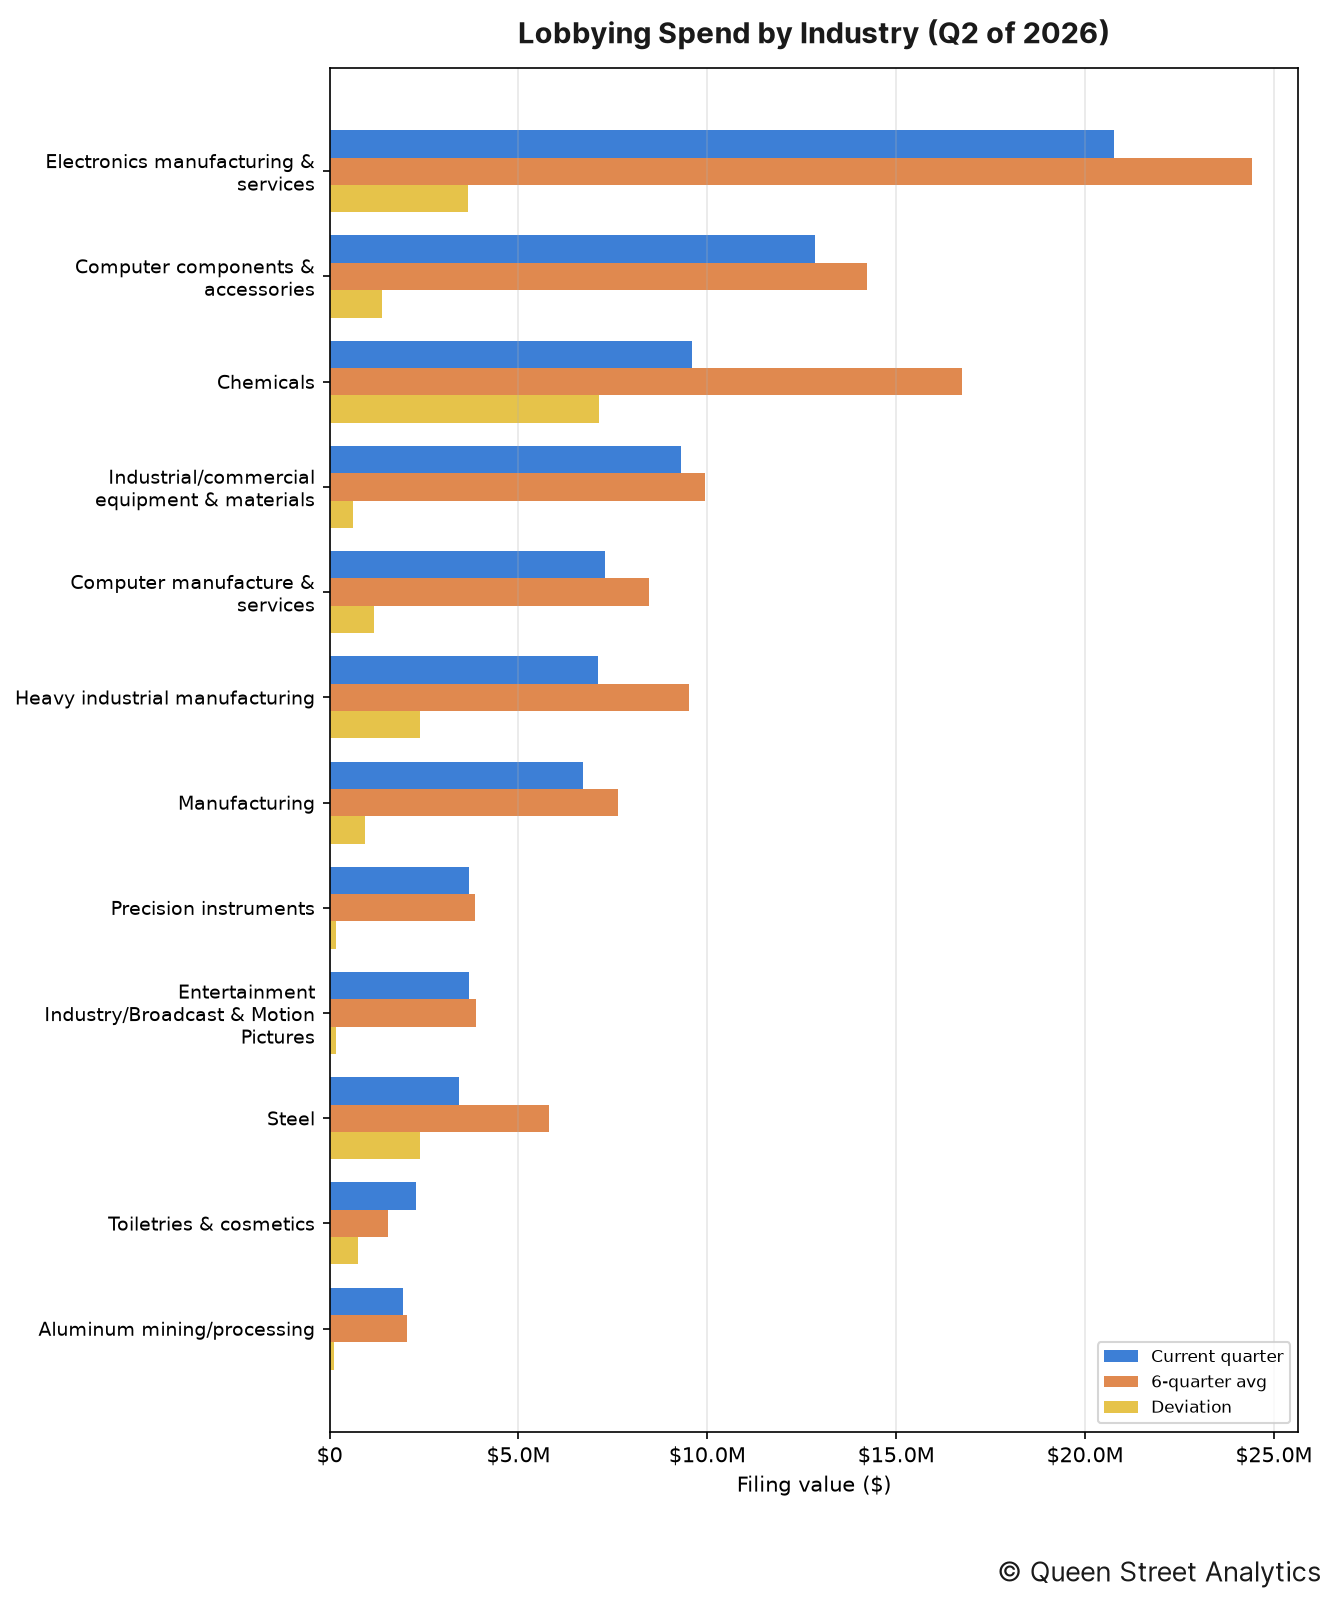
In Q2 of 2026, there was $109.8M worth of disclosed lobbying activity on Manufacturing, 19% lower than the recent quarterly average of $135.6M. This activity can be broken down by industry as follows:
↳ There was $20.8M worth of Electronics manufacturing & services lobbying, 15% lower than the recent quarterly average of $24.4M.
↳ There was $12.8M worth of Computer components & accessories lobbying, roughly in line with the recent quarterly average of $14.2M.
↳ There was $9.6M worth of Chemicals lobbying, 43% lower than the recent quarterly average of $16.7M.
↳ There was $9.3M worth of Industrial/commercial equipment & materials lobbying, roughly in line with the recent quarterly average of $9.9M.
↳ There was $7.3M worth of Computer manufacture & services lobbying, 14% lower than the recent quarterly average of $8.4M.
↳ There was $7.1M worth of Heavy industrial manufacturing lobbying, 25% lower than the recent quarterly average of $9.5M.
Section B: Lobbying Spend Trend
This channel's total disclosed lobbying spend across recent quarters, aggregated over all of its industries.
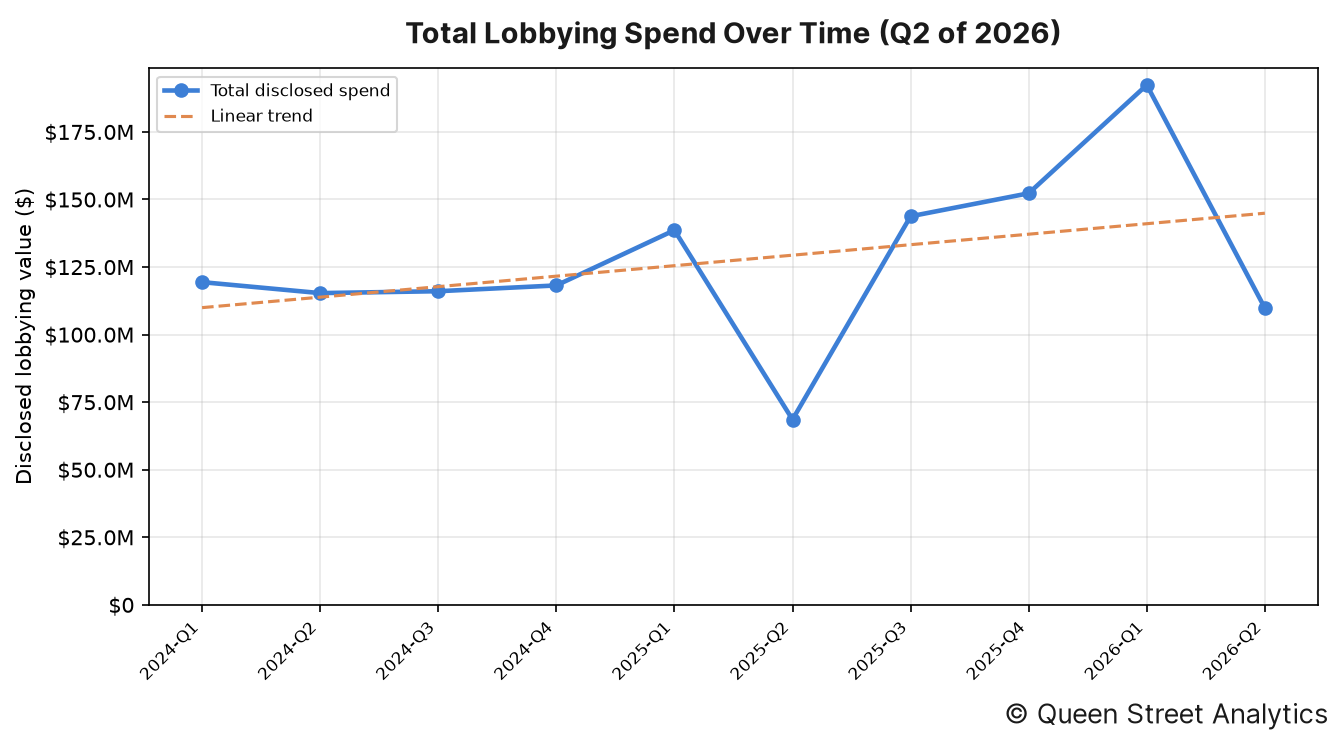
In Q2 of 2026, there was $109.8M worth of disclosed lobbying activity on Manufacturing. Across the 10 quarters shown, the channel's total disclosed spend has held roughly steady over this period.
Organizations' Lobby Spend
The image below shows the organizations whose lobbying spend moved most from their six-quarter average.
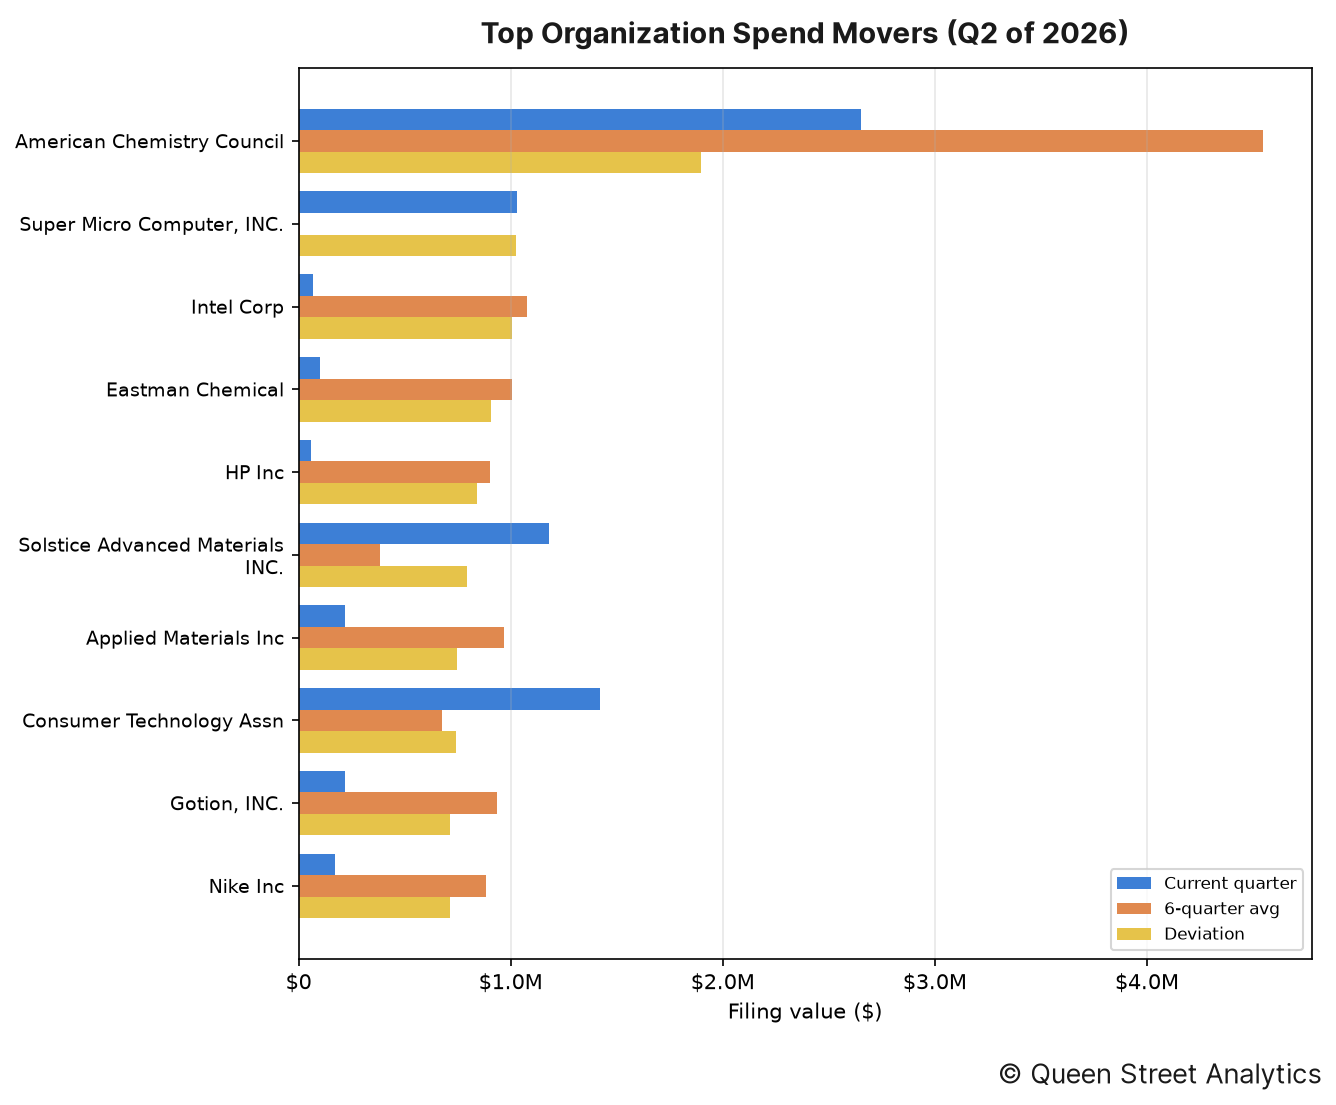
The organizations whose spending moved most from their own recent quarterly average were as follows:
↳ American Chemistry Council accounted for $2.6M in disclosed lobbying, 42% lower than the recent quarterly average of $4.5M.
↳ Super Micro Computer, INC. accounted for $1.0M in disclosed lobbying, 20500% higher than the recent quarterly average of $5k.
↳ Intel Corp accounted for $70k in disclosed lobbying, 93% lower than the recent quarterly average of $1.1M.
↳ Eastman Chemical accounted for $100k in disclosed lobbying, 90% lower than the recent quarterly average of $1.0M.
↳ HP Inc accounted for $60k in disclosed lobbying, 93% lower than the recent quarterly average of $903k.
↳ Solstice Advanced Materials INC. accounted for $1.2M in disclosed lobbying, 206% higher than the recent quarterly average of $385k.
Section D: Government Entities Lobbied
This section documents this quarter's most lobbied federal government departments.
By industry
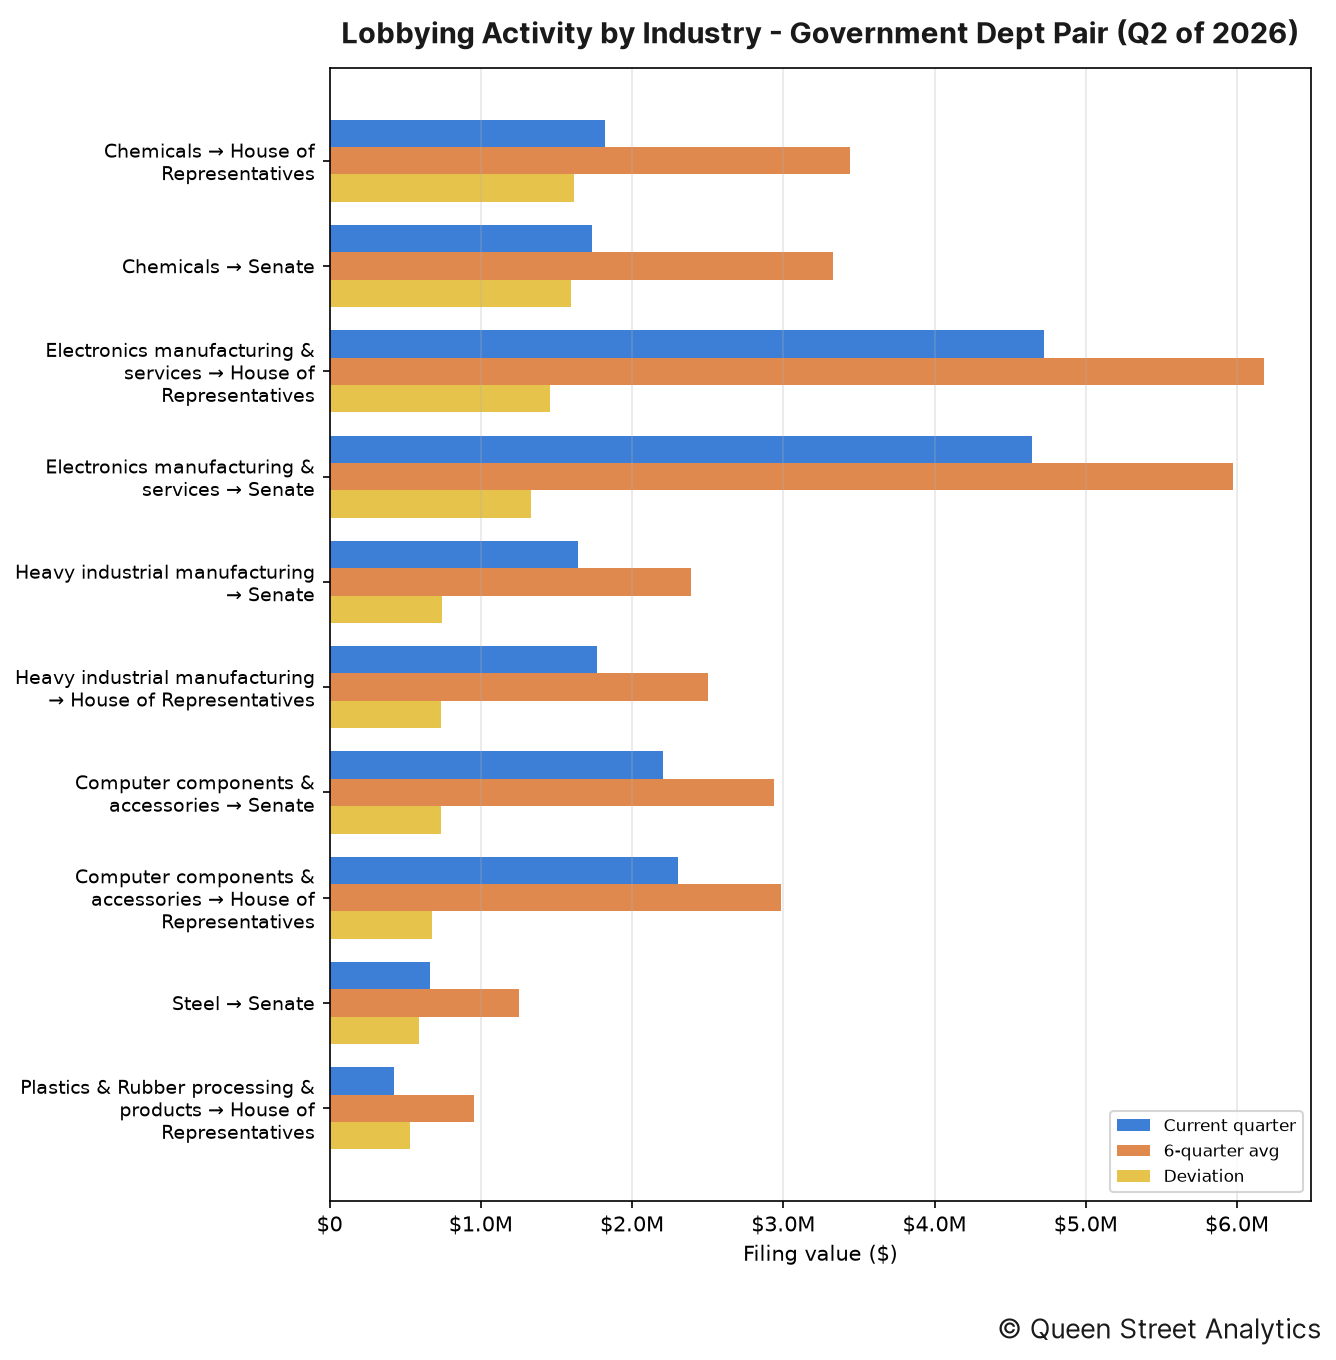
The industry–entity pairings that moved most this quarter were as follows:
↳ Chemicals directed $1.8M of lobbying toward House of Representatives, 47% lower than the recent quarterly average of $3.4M.
↳ Chemicals directed $1.7M of lobbying toward Senate, 48% lower than the recent quarterly average of $3.3M.
↳ Electronics manufacturing & services directed $4.7M of lobbying toward House of Representatives, 24% lower than the recent quarterly average of $6.2M.
By organization
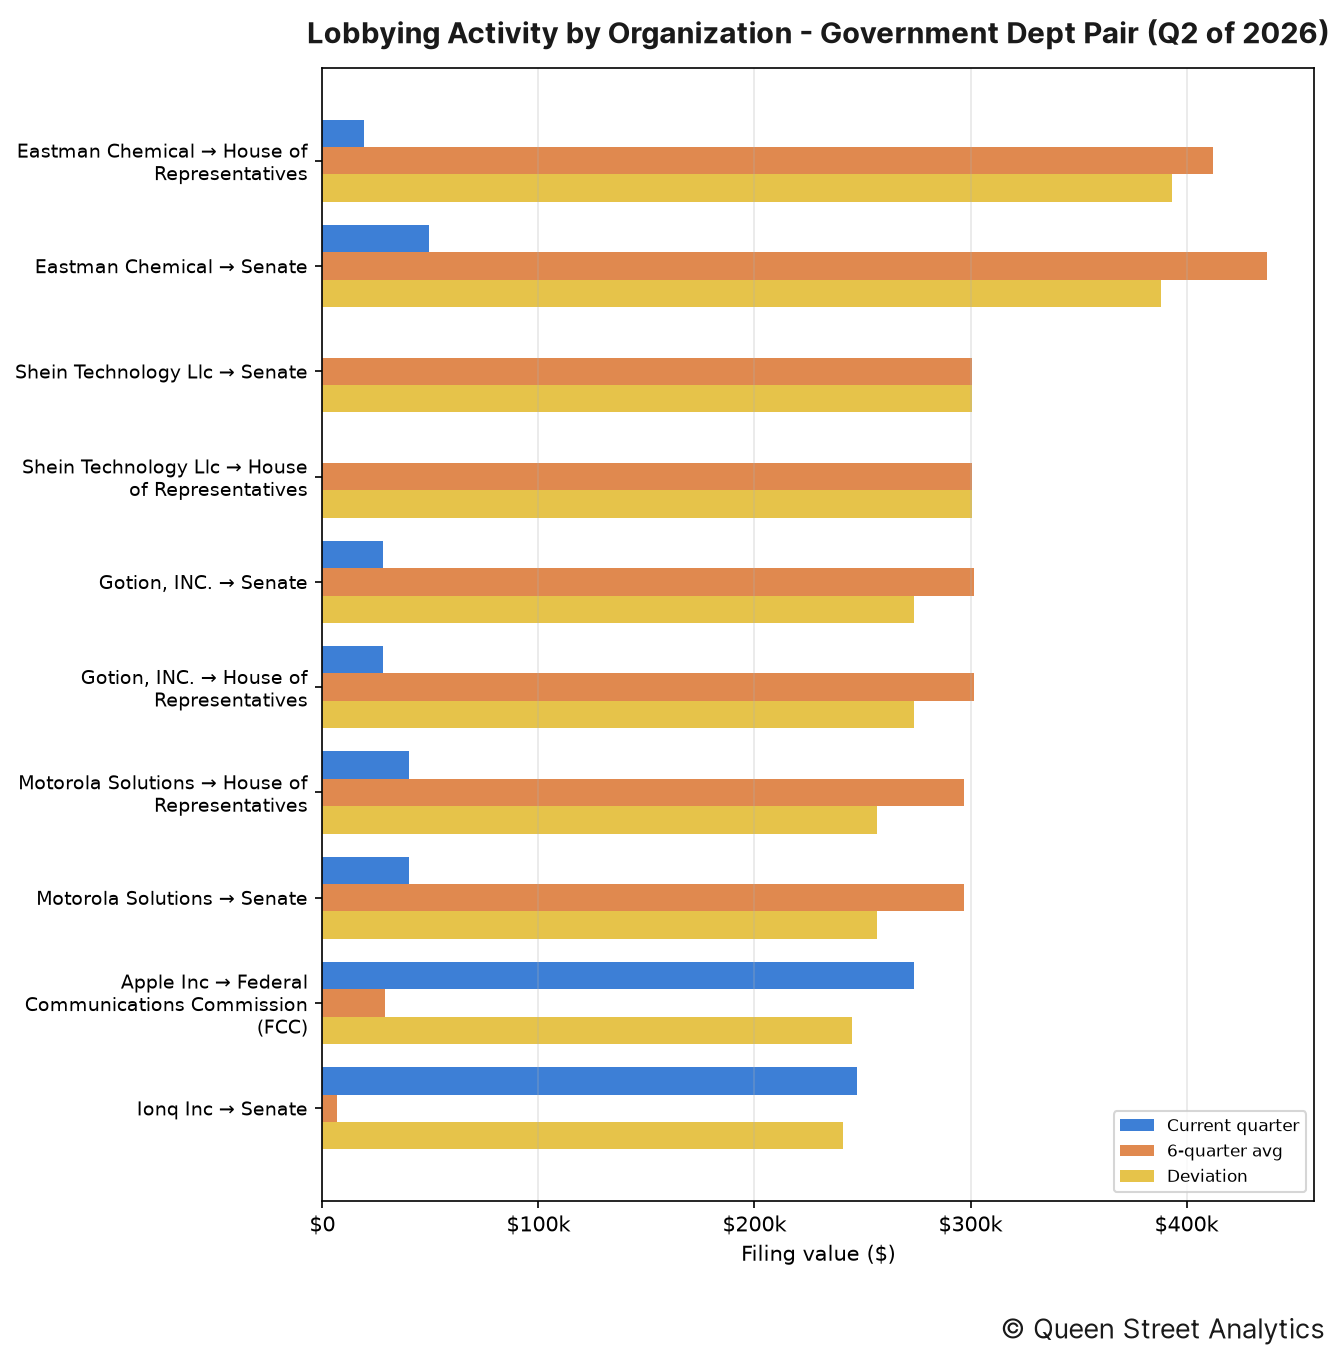
The organization–entity pairings that moved most this quarter were as follows:
↳ Eastman Chemical directed $19k of lobbying toward House of Representatives, 95% lower than the recent quarterly average of $412k.
↳ Eastman Chemical directed $49k of lobbying toward Senate, 89% lower than the recent quarterly average of $437k.
↳ Shein Technology Llc directed $0 of lobbying toward Senate, 100% lower than the recent quarterly average of $300k.
Section E: Lobbying Issues
This section documents this quarter's most lobbied-on issues.
By industry
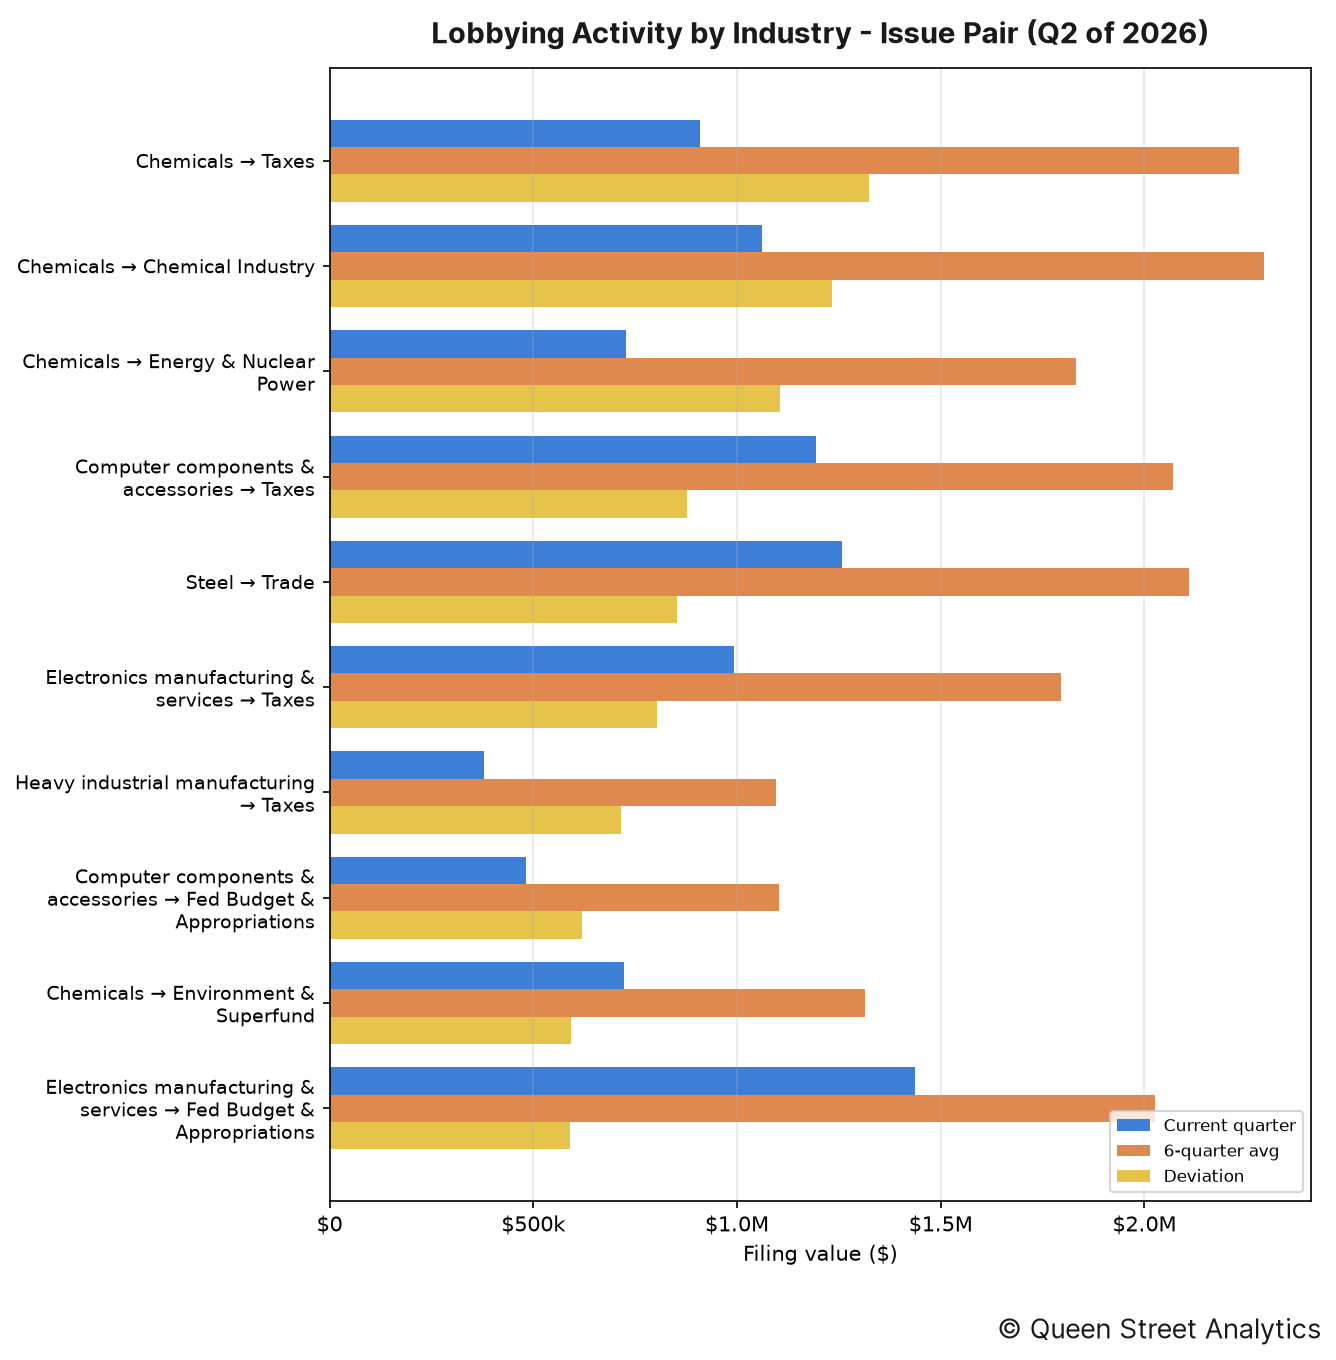
The industry–issue pairings that moved most this quarter were as follows:
↳ Chemicals put $908k toward lobbying on Taxes, 59% lower than the recent quarterly average of $2.2M.
↳ Chemicals put $1.1M toward lobbying on Chemical Industry, 54% lower than the recent quarterly average of $2.3M.
↳ Chemicals put $727k toward lobbying on Energy & Nuclear Power, 60% lower than the recent quarterly average of $1.8M.
By organization
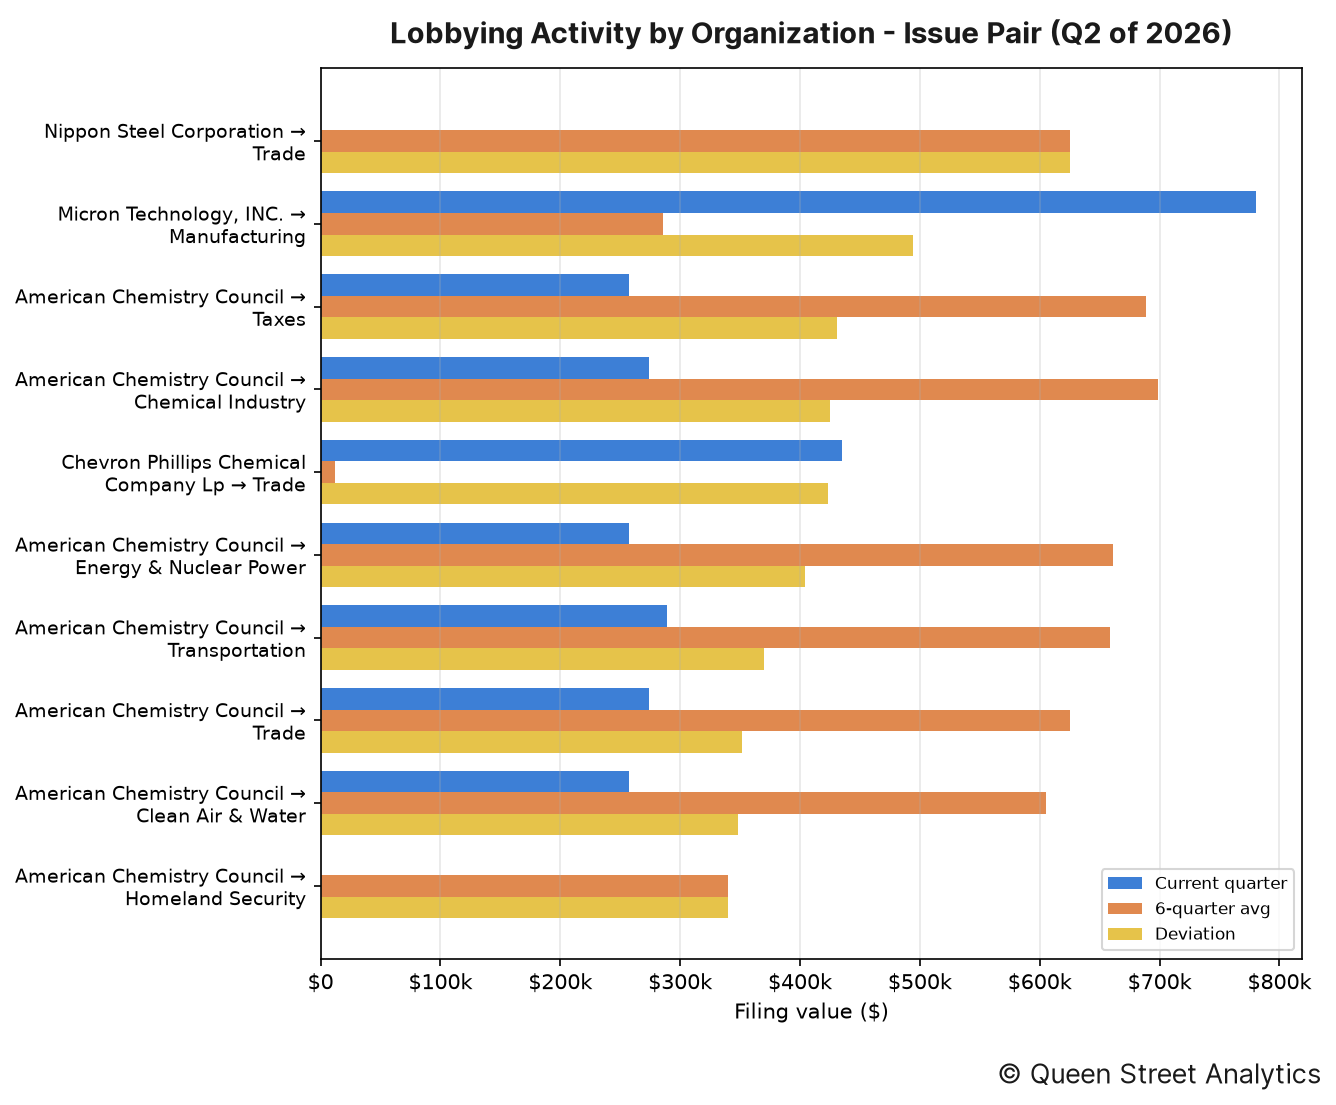
The organization–issue pairings that moved most this quarter were as follows:
↳ Nippon Steel Corporation put $0 toward lobbying on Trade, 100% lower than the recent quarterly average of $625k.
↳ Micron Technology, INC. put $780k toward lobbying on Manufacturing, 173% higher than the recent quarterly average of $286k.
↳ American Chemistry Council put $257k toward lobbying on Taxes, 63% lower than the recent quarterly average of $688k.
Section F: Most-Active Lobbyists
The figure below lists the lobbyists who managed the most imputed lobbying value this quarter, alongside their firm or organization. Because a filing's value is split evenly across the lobbyists it names, these dollar figures are imputed rather than directly disclosed.
No lobbyist activity to report this quarter.
Section G: Organization Network
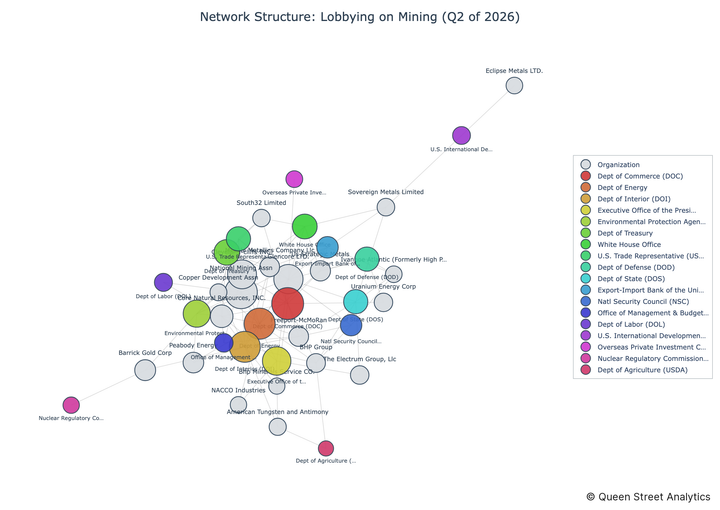
The header image for this edition maps how this channel's organizations (neutral nodes) connect to the federal entities they lobbied (colored nodes) this quarter. A link's weight is the filing value directed to that entity, and node size reflects total value; the House and Senate are excluded (nearly every organization lobbies them) so the specialized targets stand out.
The most widely lobbied entity this quarter was U.S. Trade Representative (USTR), which was lobbied by 18 organizations.
Methodology
Every figure in this report starts from one number: the disclosed value of each lobbying filing, which we take as the income a registrant reported plus any in-house expenses (income + expenses) on its quarterly US Senate and House LDA disclosure. Before totalling anything we clean the filings — applying each amendment over the original it replaces, removing duplicates, and setting aside non-standard records such as registrations and terminations — and map every filing to a lobbying channel and industry using the organization's CRP industry code.
How the money is divided. A filing's full value counts once toward the organization that paid it and that organization's industry, so the industry and organization rankings (Sections A–C) reflect whole dollars. But a single filing usually names several government entities, several issue areas, and several lobbyists at once, and the disclosure never says how the fee was split among them. Rather than credit the full amount to each — which would count the same dollars over and over — we divide a filing's value evenly across the distinct items it names. So a $200,000 filing that lists four agencies contributes $50,000 to each in Section D, and the same even split is applied across issues in Section E and across lobbyists in Section F. That way every section's totals trace back to the same underlying money without double-counting.
Reading the movements. A “deviation” compares the quarter's value to the average of the prior six quarters, so a rise or fall is measured against an entity's own recent norm rather than against the rest of the field. Section B takes the wider view: it sums every industry into one channel total and plots it quarter by quarter, with a fitted line showing the overall direction of travel. Source: US Senate and House LDA disclosures.