USA Lobbying on Utilities & Power - Washington (Q2 2026)





PG&E Corp, NextEra Energy, Edison Electric Institute, Avangrid Inc, Tri-State Generation & Transmission Assn, Pacific Gas and Electric Company were unusually active lobbyists this quarter.
View the interactive network in Queen Street Analytics →
Each quarter we track movements in US federal lobbying, channel by channel. This edition covers Utilities & Power for Q2 of 2026, ranking the organizations, government entities, issues, and lobbyists whose disclosed spend moved most.
Central Themes in this Quarter’s Lobby Data
Federal Nuclear Power Financing Spurs Utility Lobbying
Recent DOE commitments of $17.5 billion to new nuclear projects, alongside a legislative push for reactor construction, have reportedly driven surges in lobbying from firms such as PG&E Corp focused on nuclear expansion and supply chain issues. Industry players, including those engaging the Department of Energy and the House of Representatives, are targeting permitting, defense, and procurement bottlenecks, aligning with sector-wide funding increases and congressional activity that could reshape nuclear infrastructure timelines.
📎 Washington Update: Sustainable Energy & Infrastructure — July 2026 · 2026 US power sector outlook | Utility Dive
AI and Data Center Growth Drives Grid Investment and Policy Engagement
Grid operators and utilities, including American Public Power Assn and National Grid USA, have responded to rapidly rising AI and data center loads with major capital investments and lobbying on transmission, cyber security, and modernization, engaging federal entities such as the Federal Energy Regulatory Commission (FERC) and the Department of Energy. Regulatory reforms, including new FERC 'co-location' policies, indicate increased focus on transmission expansion and reliability, with utilities seeking regulatory flexibility to meet unprecedented power demands.
📎 Energized for 2026 | Federal Energy Regulatory Commission · 2026 Power and Utilities Industry Outlook - Deloitte · Top Developments for Energy Policy in 2026 - National Law Review
Transmission Needs and Permitting Reform Remain Hot Lobbying Targets
Federal agencies' alignment on the 2026 National Transmission Needs Study and recent regulatory changes have focused utility lobbying on permitting reform, renewable incentives, and compliance, with organizations such as the American Public Power Assn and PG&E Corp engaging entities like the Dept of Energy and the Federal Energy Regulatory Commission (FERC). Policymakers' moves to streamline transmission and shift incentive structures are prompting aggressive sector advocacy, particularly as the fallout from the 'One Big Beautiful Bill Act' continues to impact timelines for clean energy project development.
📎 DOE’s Office of Electricity Publishes 2026 Draft National Transmission ... · 2026 US power sector outlook | Utility Dive · 2026 Power and Utilities Industry Outlook - Deloitte
Utility Engagement Rises Amid Disaster, Cybersecurity, and Wildfire Policy Moves
Utility lobbying, with PG&E Corp as a standout, is intensifying around issues like grid security, disaster response, wildfire safety, and emergency coordination. Increased interface with federal and state agencies—including outreach to the Department of Energy and the Federal Energy Regulatory Commission—reflects stakeholder concerns about grid resilience and evolving drone/aircraft protocols, as utilities seek influence on cybersecurity and funding policies tied to natural disaster risk.
📎 July 8, 2026 Regulatory Update | FERC, CPUC, CAISO, CEC, MPUC, OPUC ... · Energy regulation & Policy News | Utility Dive · 2026 US power sector outlook | Utility Dive
Rate Structure Debates Escalate as Grid Investments Pressure Consumer Bills
As utilities increase spending on new capacity and reliability upgrades, rising consumer bills are sharpening the lobbying focus on rate structures, renewable incentives, and business model reform, with American Public Power Assn engaging the House of Representatives and PG&E Corp working with the Federal Energy Regulatory Commission and the Dept of Energy. The challenge of balancing affordability against infrastructure modernization is raising policy uncertainty, with companies asking for strategies to recover costs via flexible tariff and taxation mechanisms.
📎 2026 Power and Utilities Industry Outlook - Deloitte · 2026 US power sector outlook | Utility Dive · Top Developments for Energy Policy in 2026 - National Law Review

Section A: Lobbying Spend by Industry
How much each industry in this channel spent on federal lobbying in Q2 of 2026, compared with its average over the prior six quarters.
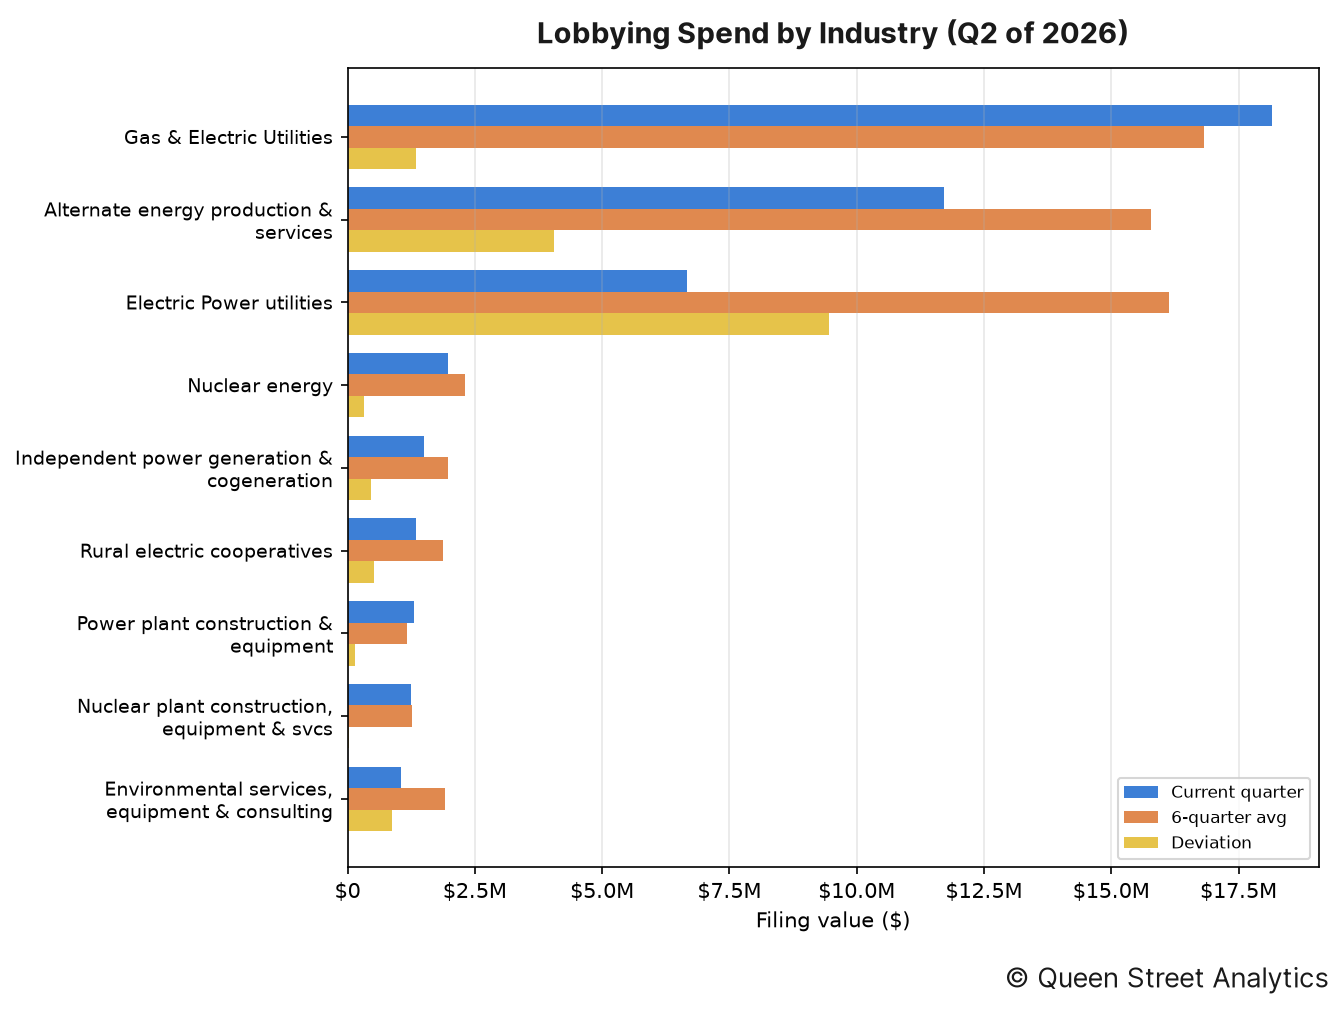
In Q2 of 2026, there was $44.9M worth of disclosed lobbying activity on Utilities & Power, 24% lower than the recent quarterly average of $59.2M. This activity can be broken down by industry as follows:
↳ There was $18.2M worth of Gas & Electric Utilities lobbying, roughly in line with the recent quarterly average of $16.8M.
↳ There was $11.7M worth of Alternate energy production & services lobbying, 26% lower than the recent quarterly average of $15.8M.
↳ There was $6.7M worth of Electric Power utilities lobbying, 59% lower than the recent quarterly average of $16.1M.
↳ There was $2.0M worth of Nuclear energy lobbying, 14% lower than the recent quarterly average of $2.3M.
↳ There was $1.5M worth of Independent power generation & cogeneration lobbying, 23% lower than the recent quarterly average of $2.0M.
↳ There was $1.3M worth of Rural electric cooperatives lobbying, 28% lower than the recent quarterly average of $1.9M.
Section B: Lobbying Spend Trend
This channel's total disclosed lobbying spend across recent quarters, aggregated over all of its industries.
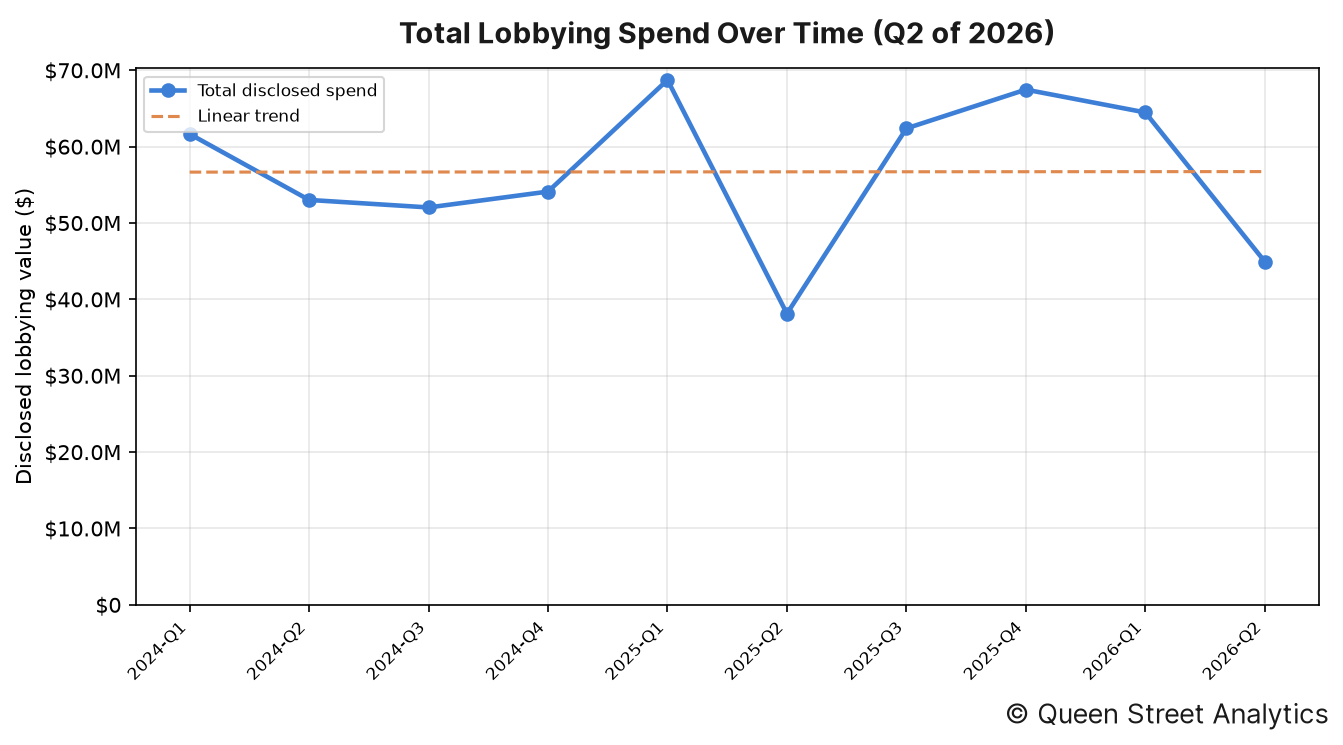
In Q2 of 2026, there was $44.9M worth of disclosed lobbying activity on Utilities & Power. Across the 10 quarters shown, the channel's total disclosed spend has fallen over this period.
Organizations' Lobby Spend
The image below shows the organizations whose lobbying spend moved most from their six-quarter average.
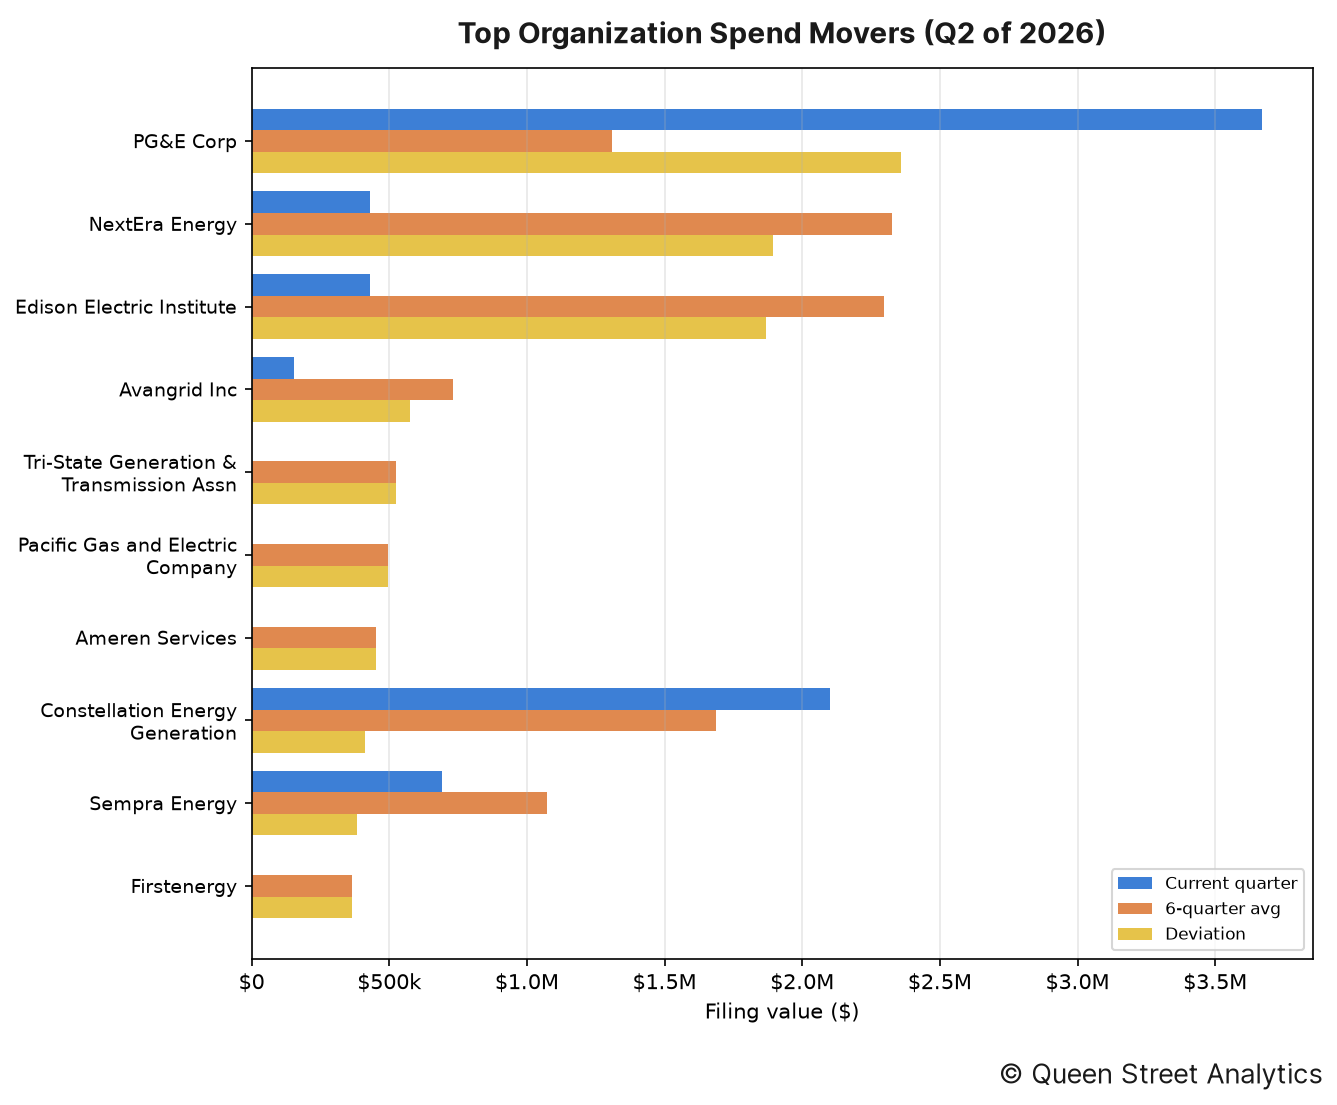
The organizations whose spending moved most from their own recent quarterly average were as follows:
↳ PG&E Corp accounted for $3.7M in disclosed lobbying, 180% higher than the recent quarterly average of $1.3M.
↳ NextEra Energy accounted for $430k in disclosed lobbying, 82% lower than the recent quarterly average of $2.3M.
↳ Edison Electric Institute accounted for $430k in disclosed lobbying, 81% lower than the recent quarterly average of $2.3M.
↳ Avangrid Inc accounted for $155k in disclosed lobbying, 79% lower than the recent quarterly average of $730k.
↳ Tri-State Generation & Transmission Assn accounted for $0 in disclosed lobbying, 100% lower than the recent quarterly average of $523k.
↳ Pacific Gas and Electric Company accounted for $0 in disclosed lobbying, 100% lower than the recent quarterly average of $497k.
Section D: Government Entities Lobbied
This section documents this quarter's most lobbied federal government departments.
By industry
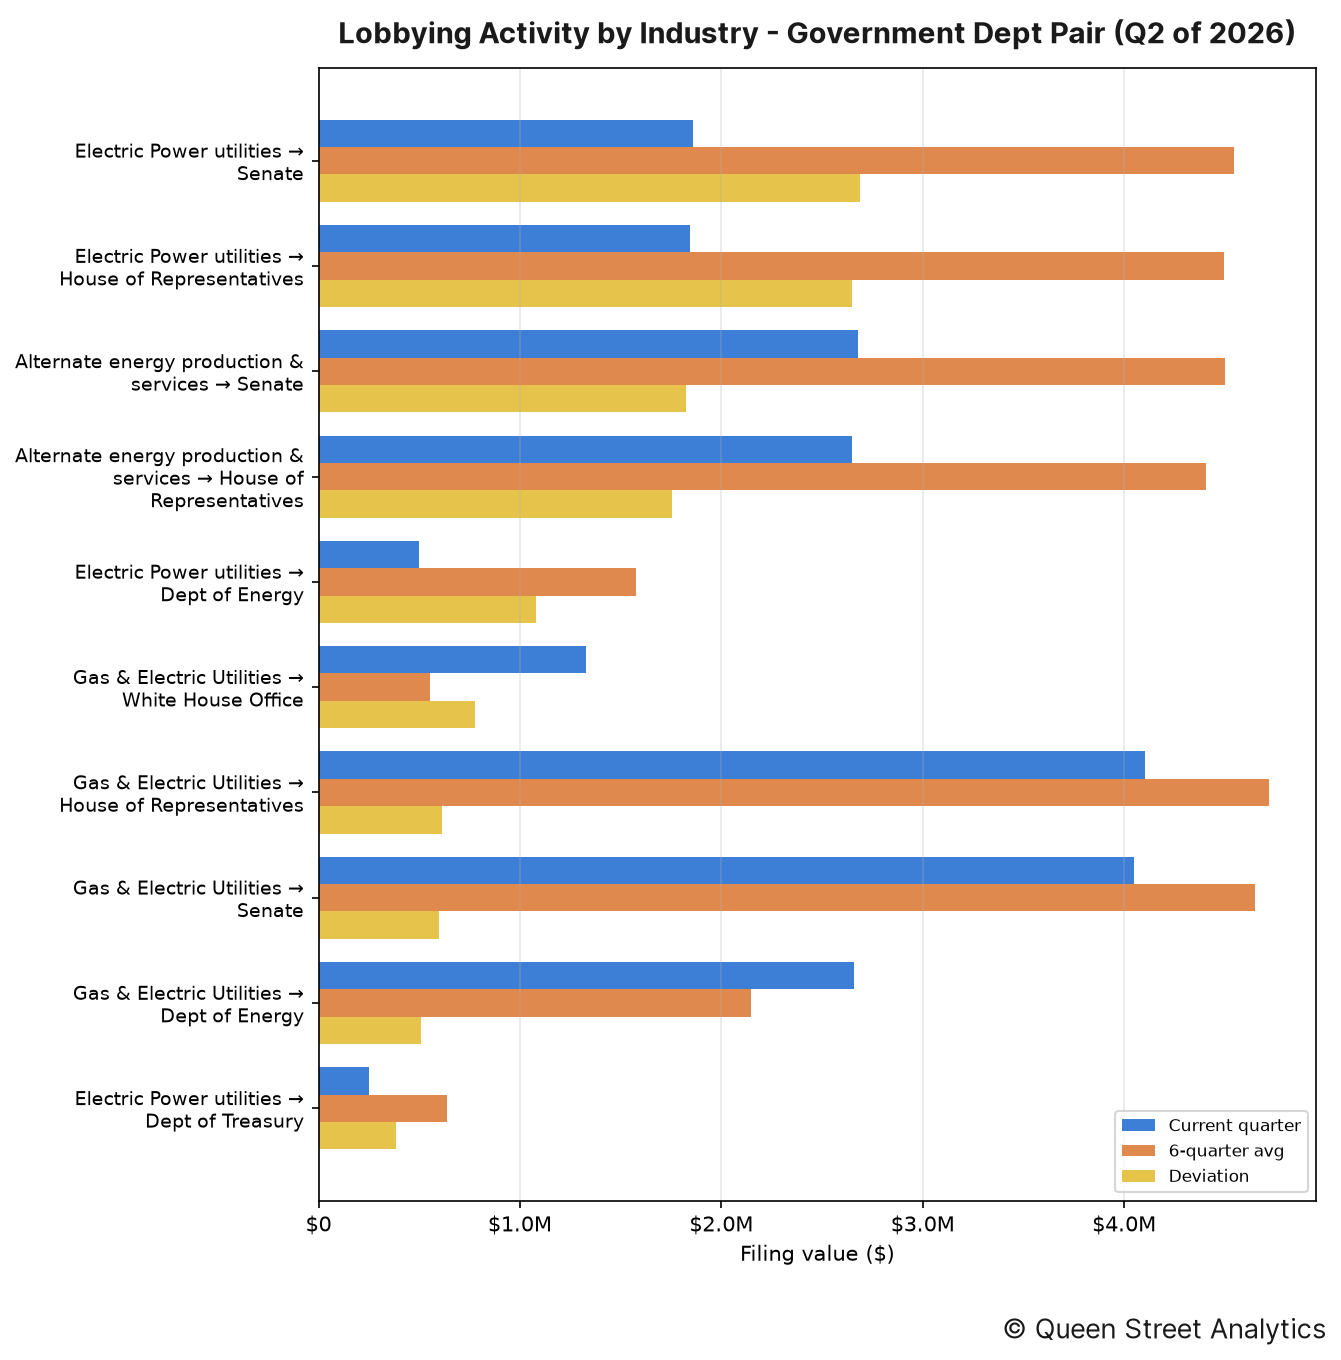
The industry–entity pairings that moved most this quarter were as follows:
↳ Electric Power utilities directed $1.9M of lobbying toward Senate, 59% lower than the recent quarterly average of $4.5M.
↳ Electric Power utilities directed $1.8M of lobbying toward House of Representatives, 59% lower than the recent quarterly average of $4.5M.
↳ Alternate energy production & services directed $2.7M of lobbying toward Senate, 41% lower than the recent quarterly average of $4.5M.
By organization
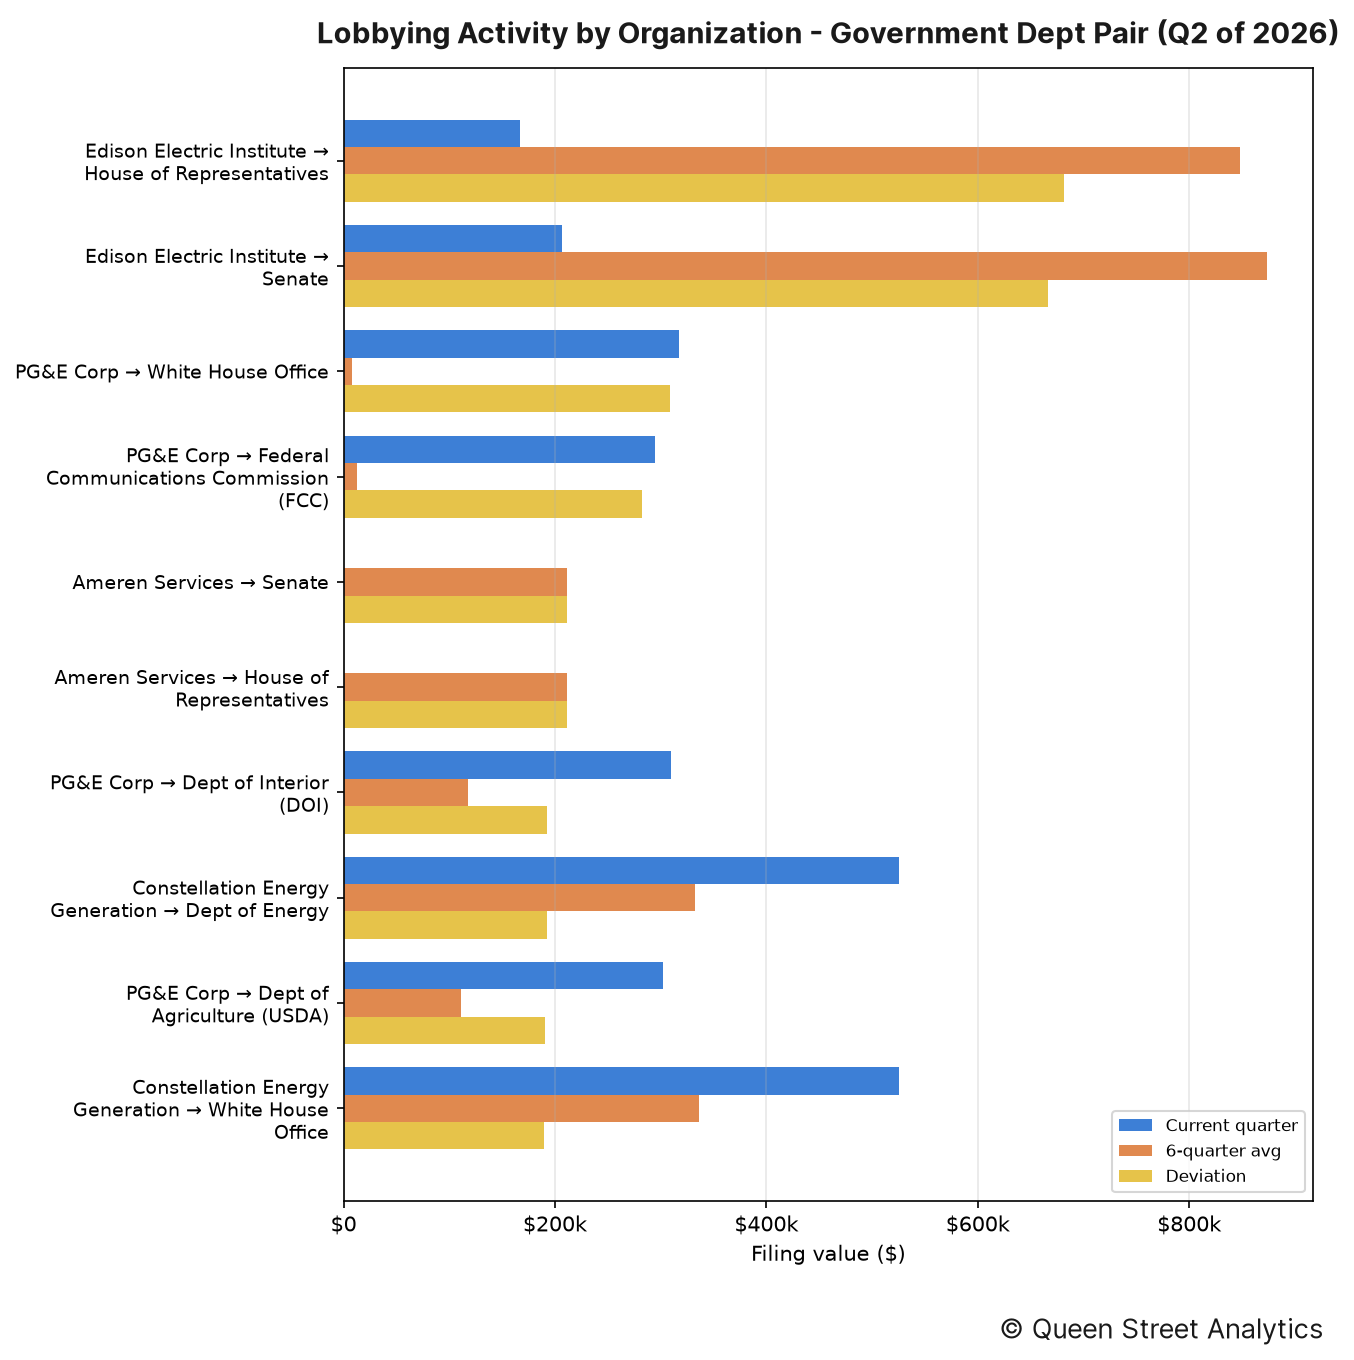
The organization–entity pairings that moved most this quarter were as follows:
↳ Edison Electric Institute directed $167k of lobbying toward House of Representatives, 80% lower than the recent quarterly average of $848k.
↳ Edison Electric Institute directed $207k of lobbying toward Senate, 76% lower than the recent quarterly average of $873k.
↳ PG&E Corp directed $317k of lobbying toward White House Office, 3706% higher than the recent quarterly average of $8k.
Section E: Lobbying Issues
This section documents this quarter's most lobbied-on issues.
By industry
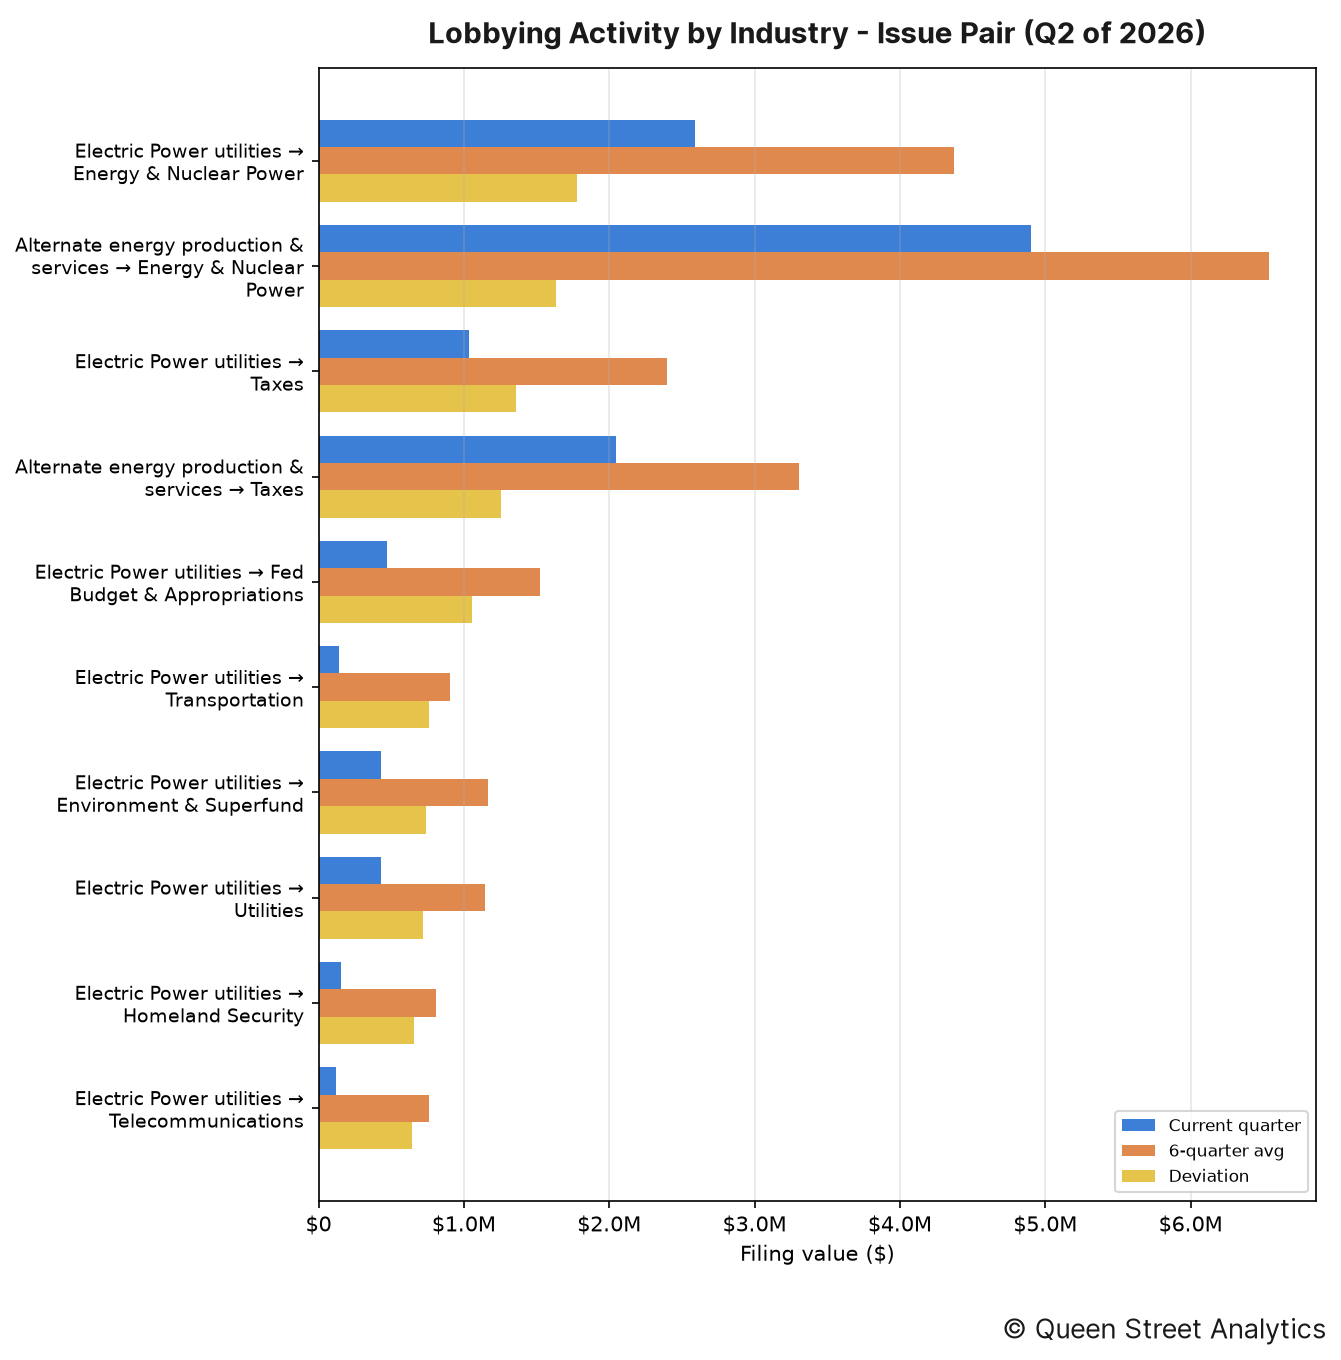
The industry–issue pairings that moved most this quarter were as follows:
↳ Electric Power utilities put $2.6M toward lobbying on Energy & Nuclear Power, 41% lower than the recent quarterly average of $4.4M.
↳ Alternate energy production & services put $4.9M toward lobbying on Energy & Nuclear Power, 25% lower than the recent quarterly average of $6.5M.
↳ Electric Power utilities put $1.0M toward lobbying on Taxes, 57% lower than the recent quarterly average of $2.4M.
By organization
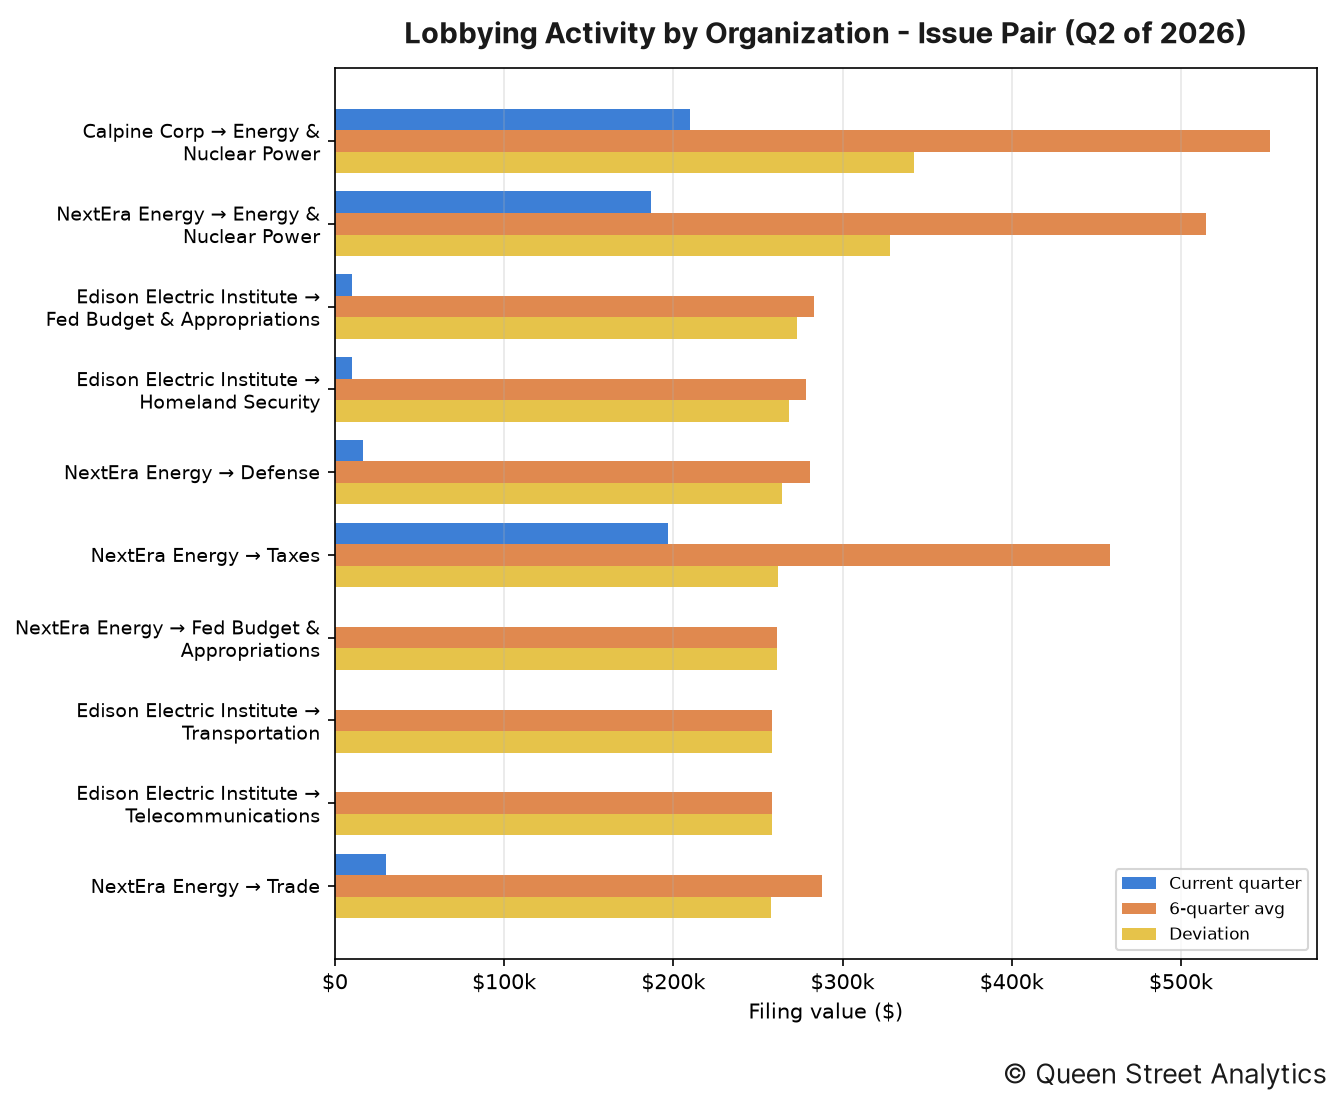
The organization–issue pairings that moved most this quarter were as follows:
↳ Calpine Corp put $210k toward lobbying on Energy & Nuclear Power, 62% lower than the recent quarterly average of $552k.
↳ NextEra Energy put $187k toward lobbying on Energy & Nuclear Power, 64% lower than the recent quarterly average of $515k.
↳ Edison Electric Institute put $10k toward lobbying on Fed Budget & Appropriations, 96% lower than the recent quarterly average of $283k.
Section F: Most-Active Lobbyists
The figure below lists the lobbyists who managed the most imputed lobbying value this quarter, alongside their firm or organization. Because a filing's value is split evenly across the lobbyists it names, these dollar figures are imputed rather than directly disclosed.
No lobbyist activity to report this quarter.
Section G: Organization Network
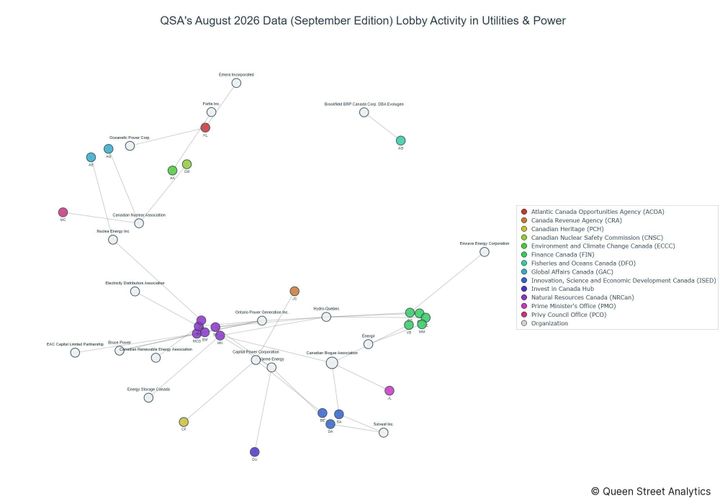
The header image for this edition maps how this channel's organizations (neutral nodes) connect to the federal entities they lobbied (colored nodes) this quarter. A link's weight is the filing value directed to that entity, and node size reflects total value; the House and Senate are excluded (nearly every organization lobbies them) so the specialized targets stand out.
The most widely lobbied entity this quarter was Dept of Energy, which was lobbied by 20 organizations.
Methodology
Every figure in this report starts from one number: the disclosed value of each lobbying filing, which we take as the income a registrant reported plus any in-house expenses (income + expenses) on its quarterly US Senate and House LDA disclosure. Before totalling anything we clean the filings — applying each amendment over the original it replaces, removing duplicates, and setting aside non-standard records such as registrations and terminations — and map every filing to a lobbying channel and industry using the organization's CRP industry code.
How the money is divided. A filing's full value counts once toward the organization that paid it and that organization's industry, so the industry and organization rankings (Sections A–C) reflect whole dollars. But a single filing usually names several government entities, several issue areas, and several lobbyists at once, and the disclosure never says how the fee was split among them. Rather than credit the full amount to each — which would count the same dollars over and over — we divide a filing's value evenly across the distinct items it names. So a $200,000 filing that lists four agencies contributes $50,000 to each in Section D, and the same even split is applied across issues in Section E and across lobbyists in Section F. That way every section's totals trace back to the same underlying money without double-counting.
Reading the movements. A “deviation” compares the quarter's value to the average of the prior six quarters, so a rise or fall is measured against an entity's own recent norm rather than against the rest of the field. Section B takes the wider view: it sums every industry into one channel total and plots it quarter by quarter, with a fitted line showing the overall direction of travel. Source: US Senate and House LDA disclosures.