USA Lobbying on Finance & Insurance - Washington (Q3 2026)


National Assn of Realtors, American Bankers Assn, Morgan Stanley, MasterCard International, Cigna Corp, and Kalshi were unusually active lobbyists this quarter.
View the interactive network in Queen Street Analytics →
Each quarter we track movements in US federal lobbying, channel by channel. This edition covers Finance & Insurance for Q3 of 2026, ranking the organizations, government entities, issues, and lobbyists whose disclosed spend moved most.
Central Themes in this Quarter’s Lobby Data
Fair Lending Enforcement Sees Strategic Shift
Federal agencies, including the Consumer Financial Protection Bureau (CFPB) and the Dept of Justice (DOJ), have recently moved away from the disparate impact theory in fair lending enforcement, tightening their focus on intentional discrimination. This shift in approach, alongside the FTC’s action on payment processor abuses and deceptive fee disclosures, is believed to be catalyzing intensified lobbying from organizations such as the Credit Union National Assn and insurers who are closely tracking compliance changes.
📎 Q3 2026 Consumer Finance Regulatory and Litigation News and Trends · CFPB Releases 2026 Regulatory Agenda Detailing Planned Rulemakings · The Fed - Regulatory Developments - Federal Reserve Board
Real Estate Sector Ramps Up Congressional Advocacy on Housing Policy
A surge in real estate lobbying, led by the National Assn of Realtors in their advocacy before the House of Representatives, the Senate, and the Dept of Housing & Urban Development (HUD), is coinciding with live debates in Congress over key bills affecting housing supply, disaster insurance, appraisal practices, and GSE reform. Multiple major participants, including the Credit Union National Assn with activities targeting the Federal Housing Finance Agency (FHFA), are actively engaging federal agencies and legislators to influence these policy changes as new government interventions reshape housing and insurance markets.
📎 Government Policy Shifts Reshape Real Estate Markets in 2026 · 2026 Legislative and Regulatory Outlook | Insights | Holland & Knight · Q3 2026 U.S Legal & Regulatory Developments | Paul, Weiss
Bank Capital Rules and Appraisal Exemptions Drive Sector Engagement
Recent Federal Reserve proposals to modernize capital frameworks and leverage ratios, plus updated appraisal exemption thresholds, are prompting a renewed wave of engagement from commercial banks and digital financial firms, including the Credit Union National Assn, which has actively lobbied the Federal Reserve System and the Consumer Financial Protection Bureau (CFPB) on related regulatory matters. These regulatory actions are fostering sector-wide efforts, with participation from Credit Union National Assn and their advocacy before entities such as the Executive Office of the President (EOP) and the House of Representatives, to influence rulemakings in order to maintain operational flexibility and compliance.
📎 The Fed - Regulatory Developments - Federal Reserve Board · 2026 financial services regulatory outlooks - Deloitte US
Crypto Firms Mobilize as Stablecoin and Tokenization Rules Take Shape
Federal agencies, including the Consumer Financial Protection Bureau (CFPB) and the Financial Crimes Enforcement Network (FinCEN), are beginning to implement the GENIUS Act’s stablecoin provisions, and have recently clarified capital treatment for tokenized securities, with full rulemaking expected through 2027. Crypto firms, alongside advocacy groups such as the Credit Union National Assn, are observed to be escalating their advocacy efforts in response to these pending regulatory changes, aiming to influence policy development and operational requirements.
📎 Regulatory Updates for 2026 Affecting Policies and Procedures · The Fed - Regulatory Developments - Federal Reserve Board · 4 US regulatory trends for 2026: A guide for compliance leaders
Appropriations and Tax Debates Fuel Real Estate and Finance Sector Lobbying
The convergence of Congressional battles over appropriations and tax policy, including proposals for capital gains exclusions and credits for property improvements, has coincided with marked increases in real estate and financial lobbying. Major trade groups and client organizations, such as the Credit Union National Assn, are actively working to shape key expiring provisions in finance, housing, and insurance policy, with efforts directed toward federal entities like the Federal Housing Finance Agency and the House of Representatives.
📎 2026 Legislative and Regulatory Outlook | Insights | Holland & Knight · Government Policy Shifts Reshape Real Estate Markets in 2026

Section A: Lobbying Spend by Industry
How much each industry in this channel spent on federal lobbying in Q3 of 2026, compared with its average over the prior six quarters.
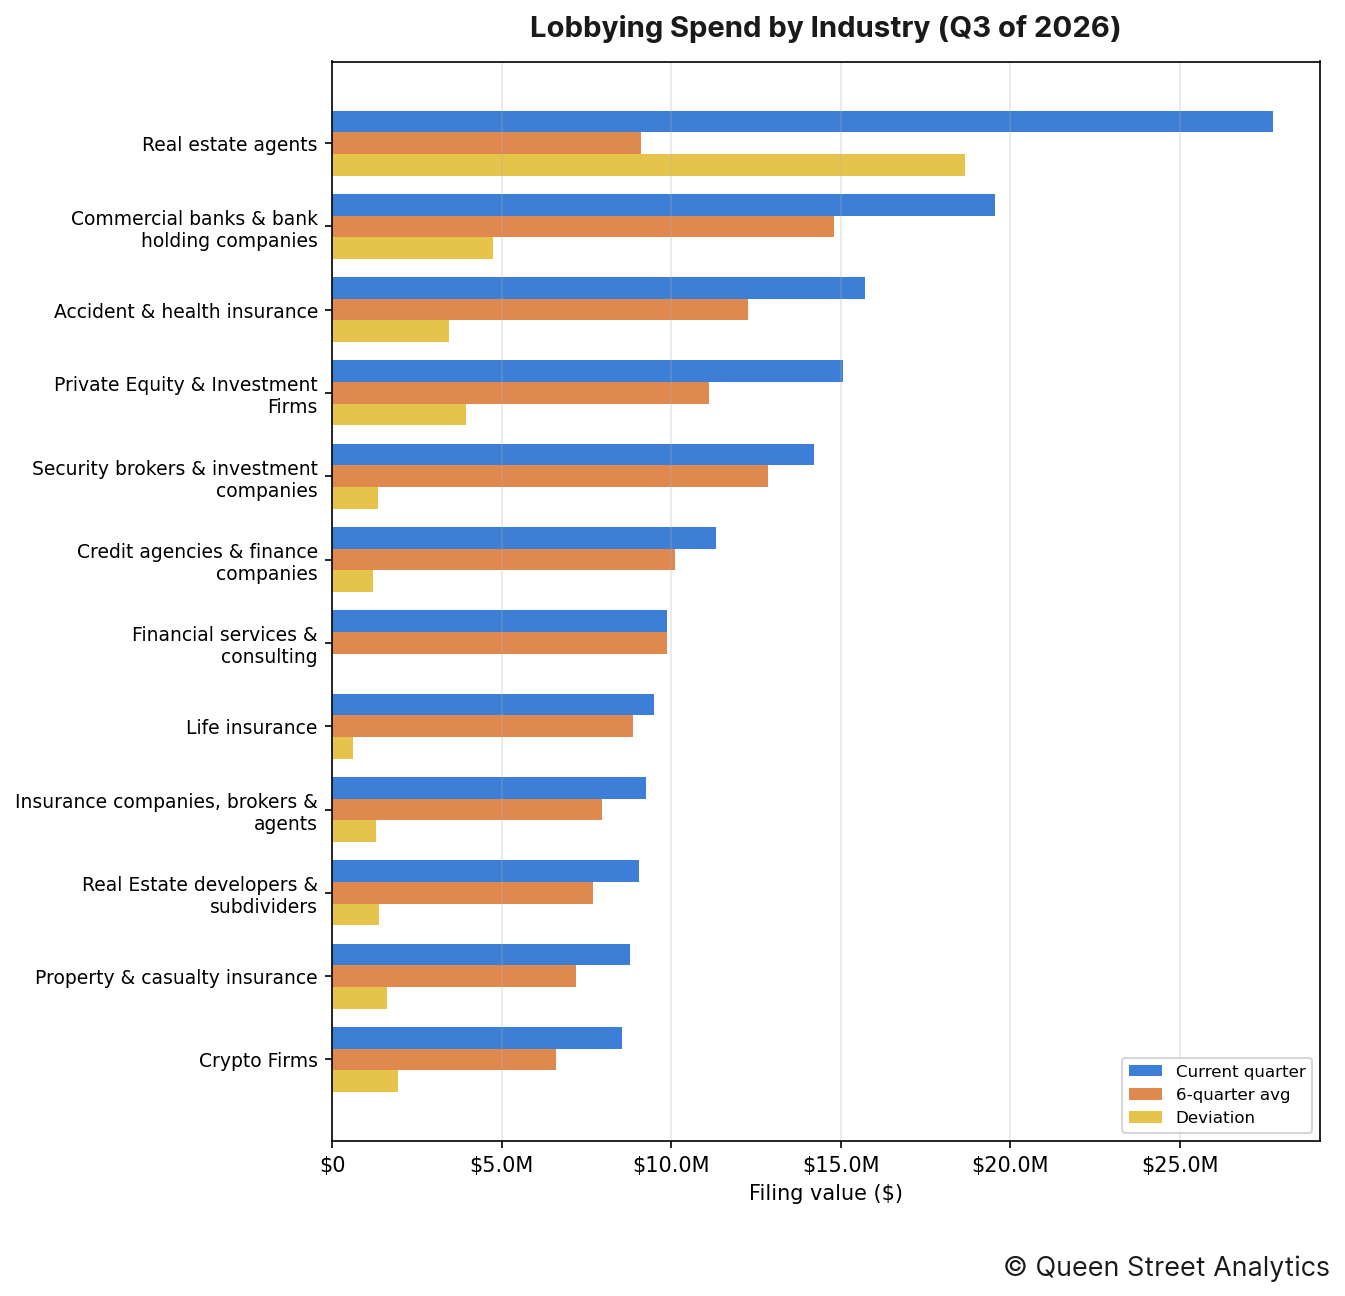
In Q3 of 2026, there was $224.2M worth of disclosed lobbying activity on Finance & Insurance, 23% higher than the recent quarterly average of $182.5M. This activity can be broken down by industry as follows:
↳ There was $27.8M worth of Real estate agents lobbying, 205% higher than the recent quarterly average of $9.1M.
↳ There was $19.6M worth of Commercial banks & bank holding companies lobbying, 32% higher than the recent quarterly average of $14.8M.
↳ There was $15.7M worth of Accident & health insurance lobbying, 28% higher than the recent quarterly average of $12.3M.
↳ There was $15.1M worth of Private Equity & Investment Firms lobbying, 35% higher than the recent quarterly average of $11.1M.
↳ There was $14.2M worth of Security brokers & investment companies lobbying, 10% higher than the recent quarterly average of $12.9M.
↳ There was $11.3M worth of Credit agencies & finance companies lobbying, 12% higher than the recent quarterly average of $10.1M.
Section B: Lobbying Spend Trend
This channel's total disclosed lobbying spend across recent quarters, aggregated over all of its industries.
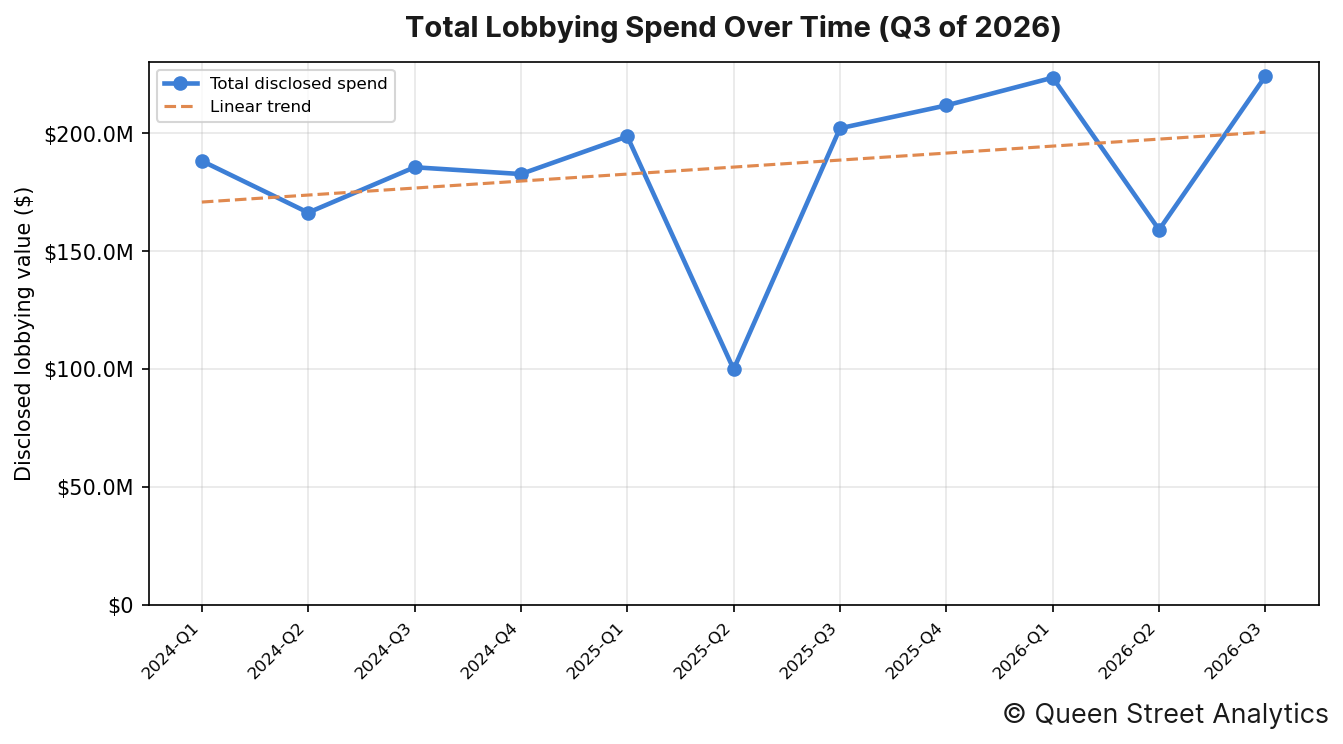
In Q3 of 2026, there was $224.2M worth of disclosed lobbying activity on Finance & Insurance. Across the 11 quarters shown, the channel's total disclosed spend has risen over this period.
Organizations' Lobby Spend
The image below shows the organizations whose lobbying spend moved most from their six-quarter average.
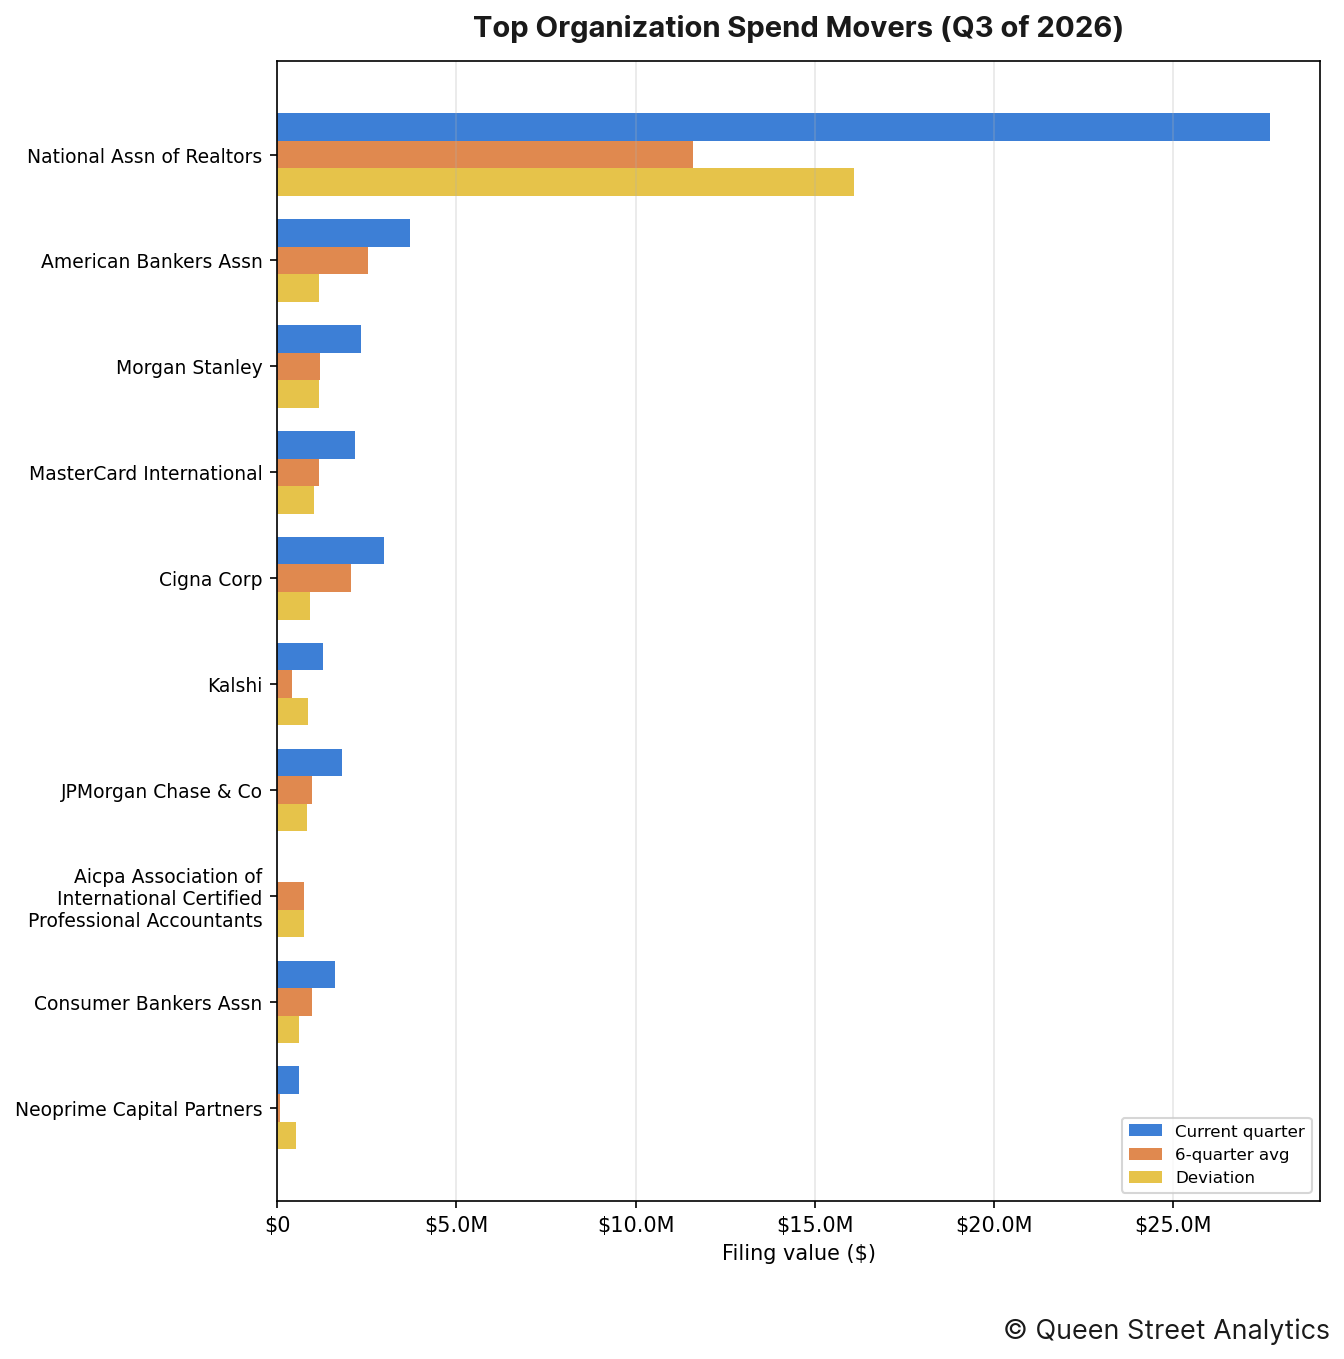
The organizations whose spending moved most from their own recent quarterly average were as follows:
↳ National Assn of Realtors accounted for $27.7M in disclosed lobbying, 139% higher than the recent quarterly average of $11.6M.
↳ American Bankers Assn accounted for $3.7M in disclosed lobbying, 46% higher than the recent quarterly average of $2.5M.
↳ Morgan Stanley accounted for $2.3M in disclosed lobbying, 98% higher than the recent quarterly average of $1.2M.
↳ MasterCard International accounted for $2.2M in disclosed lobbying, 88% higher than the recent quarterly average of $1.2M.
↳ Cigna Corp accounted for $3.0M in disclosed lobbying, 45% higher than the recent quarterly average of $2.1M.
↳ Kalshi accounted for $1.3M in disclosed lobbying, 207% higher than the recent quarterly average of $419k.
Section D: Government Entities Lobbied
This section documents this quarter's most lobbied federal government departments.
By industry
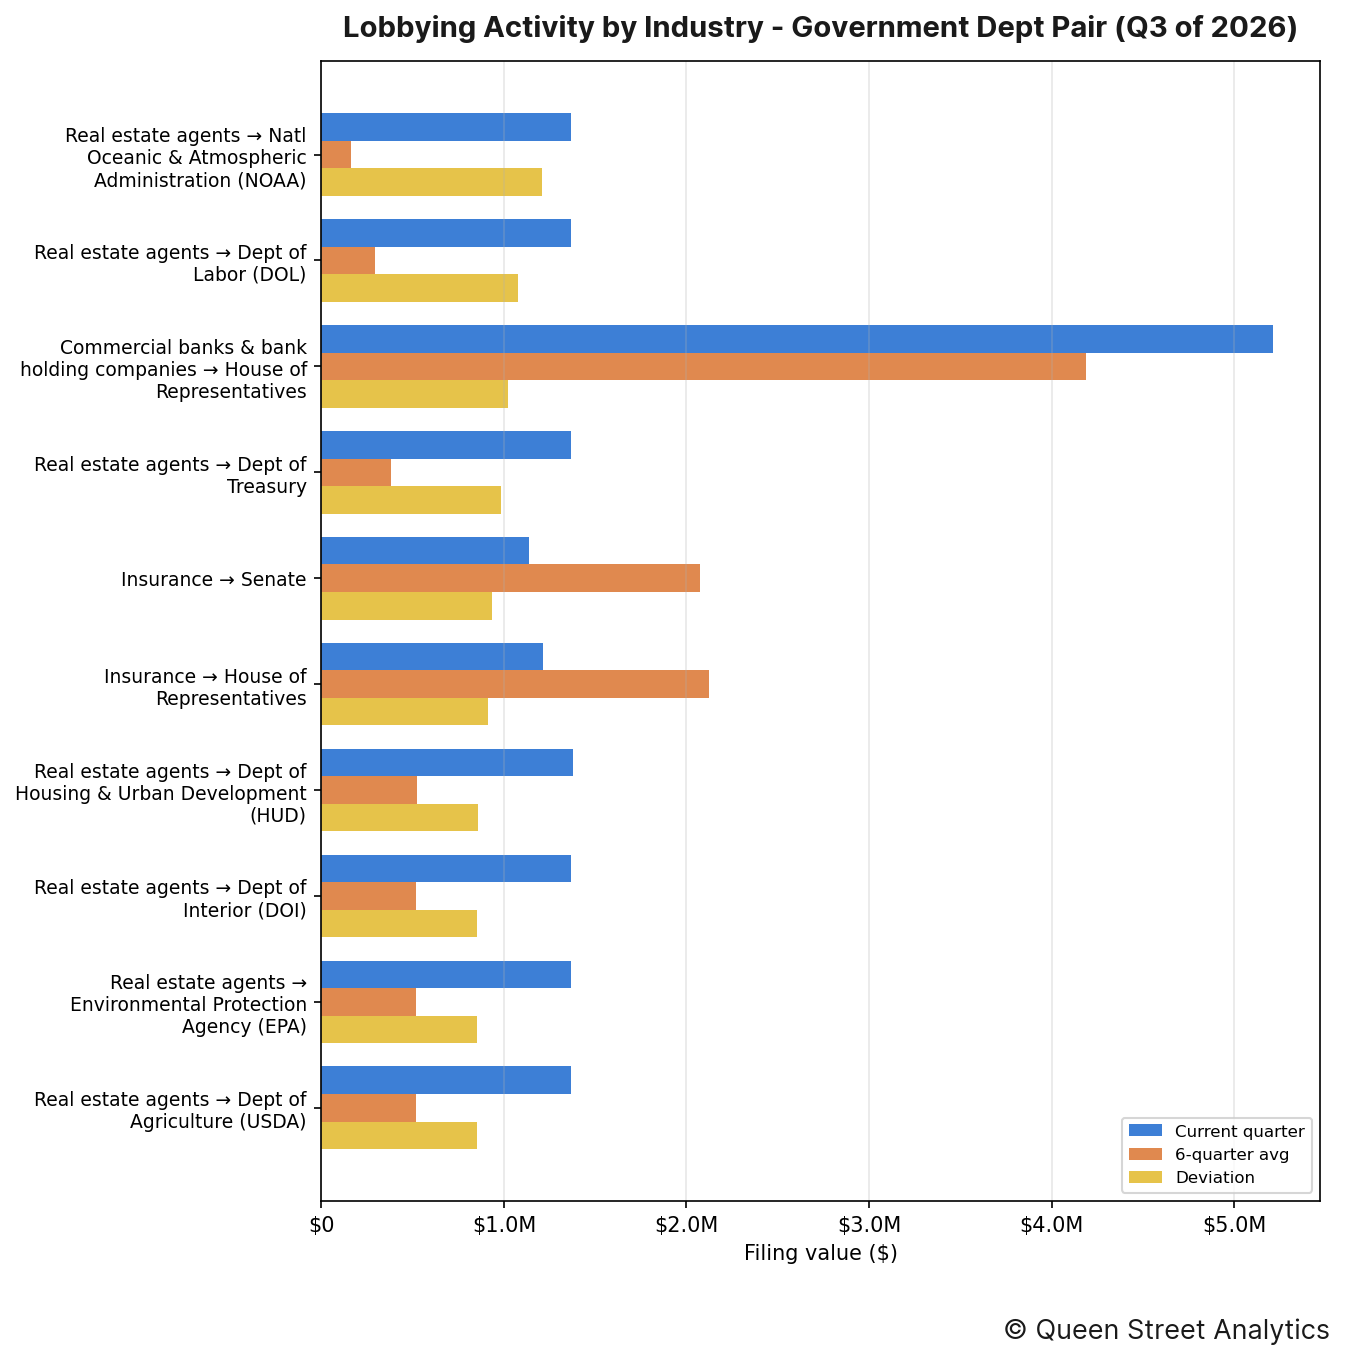
The industry–entity pairings that moved most this quarter were as follows:
↳ Real estate agents directed $1.4M of lobbying toward Natl Oceanic & Atmospheric Administration (NOAA), 746% higher than the recent quarterly average of $162k.
↳ Real estate agents directed $1.4M of lobbying toward Dept of Labor (DOL), 364% higher than the recent quarterly average of $295k.
↳ Commercial banks & bank holding companies directed $5.2M of lobbying toward House of Representatives, 24% higher than the recent quarterly average of $4.2M.
By organization
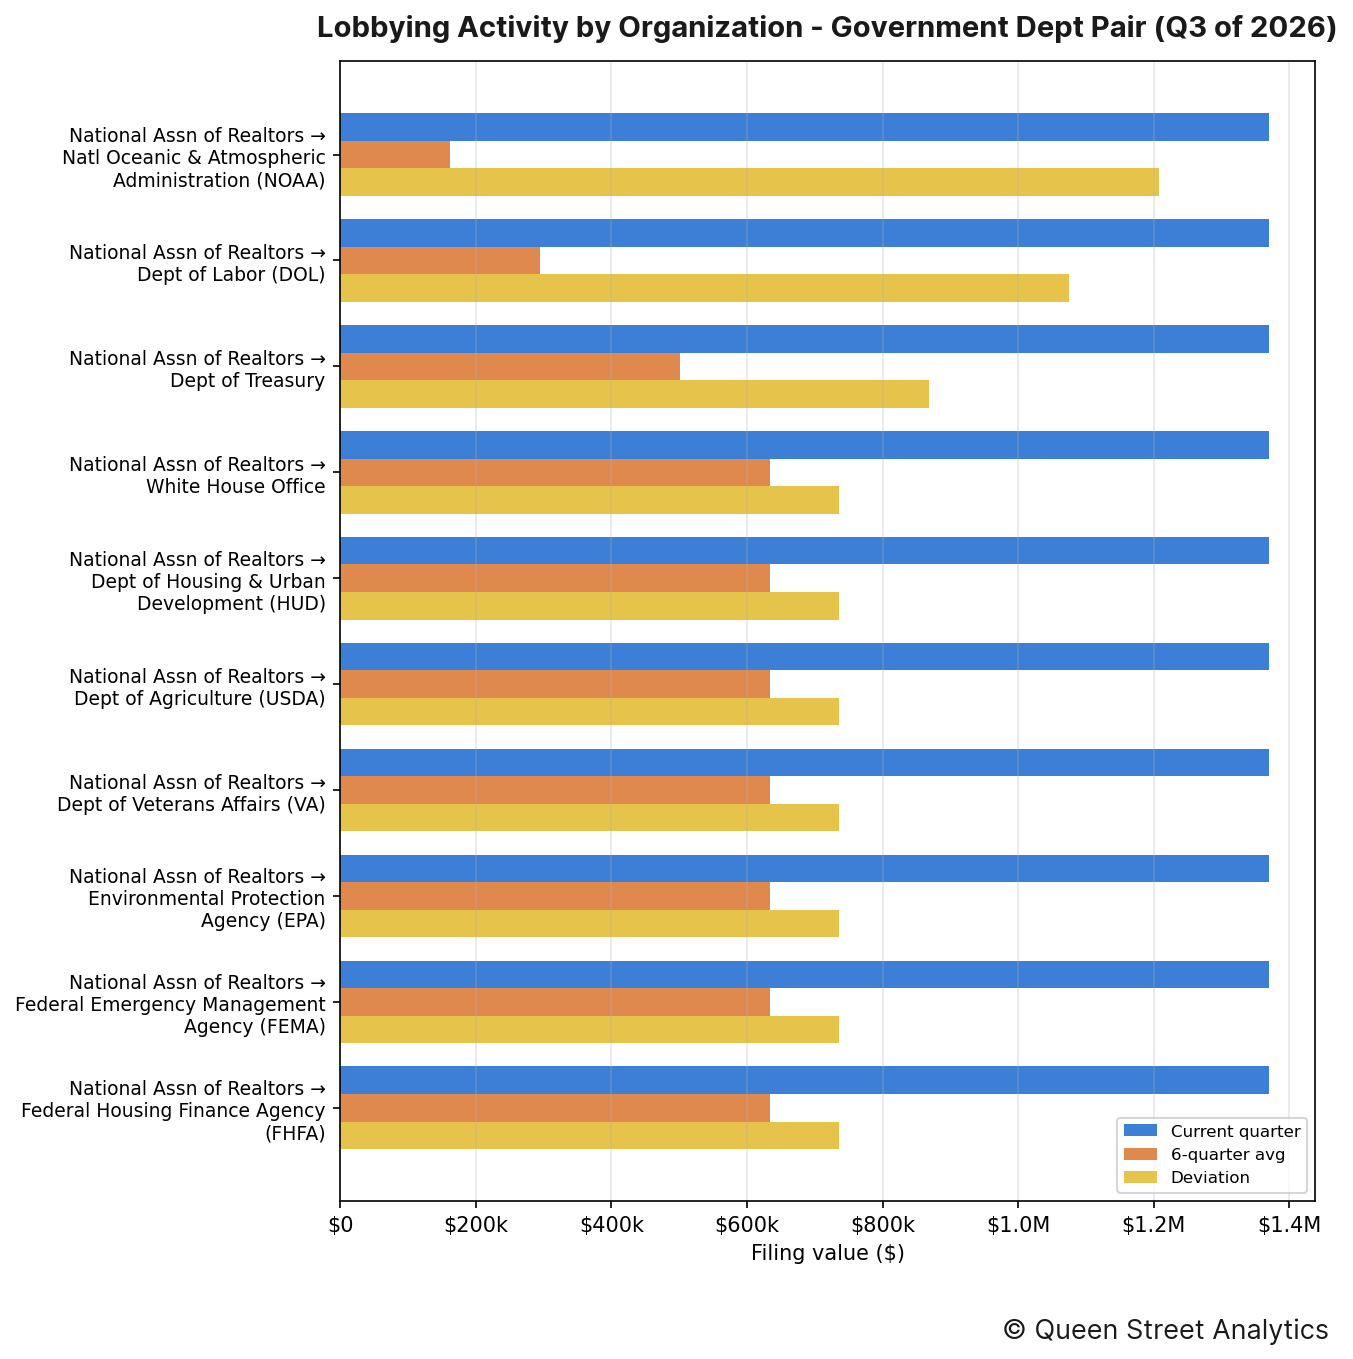
The organization–entity pairings that moved most this quarter were as follows:
↳ National Assn of Realtors directed $1.4M of lobbying toward Natl Oceanic & Atmospheric Administration (NOAA), 746% higher than the recent quarterly average of $162k.
↳ National Assn of Realtors directed $1.4M of lobbying toward Dept of Labor (DOL), 364% higher than the recent quarterly average of $295k.
↳ National Assn of Realtors directed $1.4M of lobbying toward Dept of Treasury, 173% higher than the recent quarterly average of $501k.
Section E: Lobbying Issues
This section documents this quarter's most lobbied-on issues.
By industry
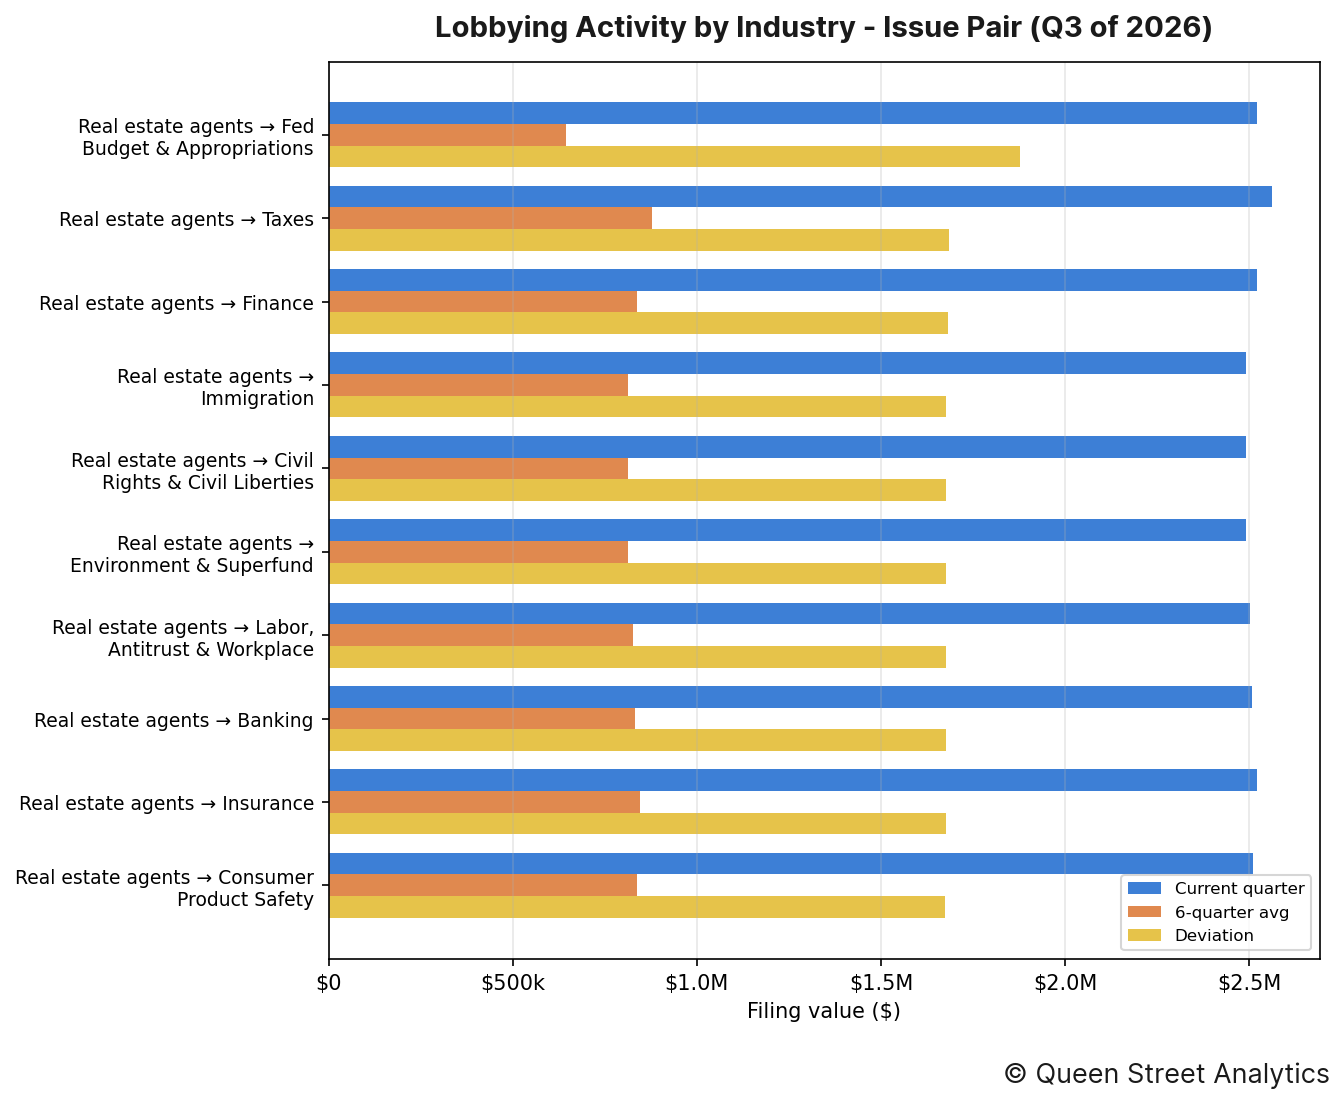
The industry–issue pairings that moved most this quarter were as follows:
↳ Real estate agents put $2.5M toward lobbying on Fed Budget & Appropriations, 291% higher than the recent quarterly average of $645k.
↳ Real estate agents put $2.6M toward lobbying on Taxes, 192% higher than the recent quarterly average of $878k.
↳ Real estate agents put $2.5M toward lobbying on Finance, 201% higher than the recent quarterly average of $838k.
By organization
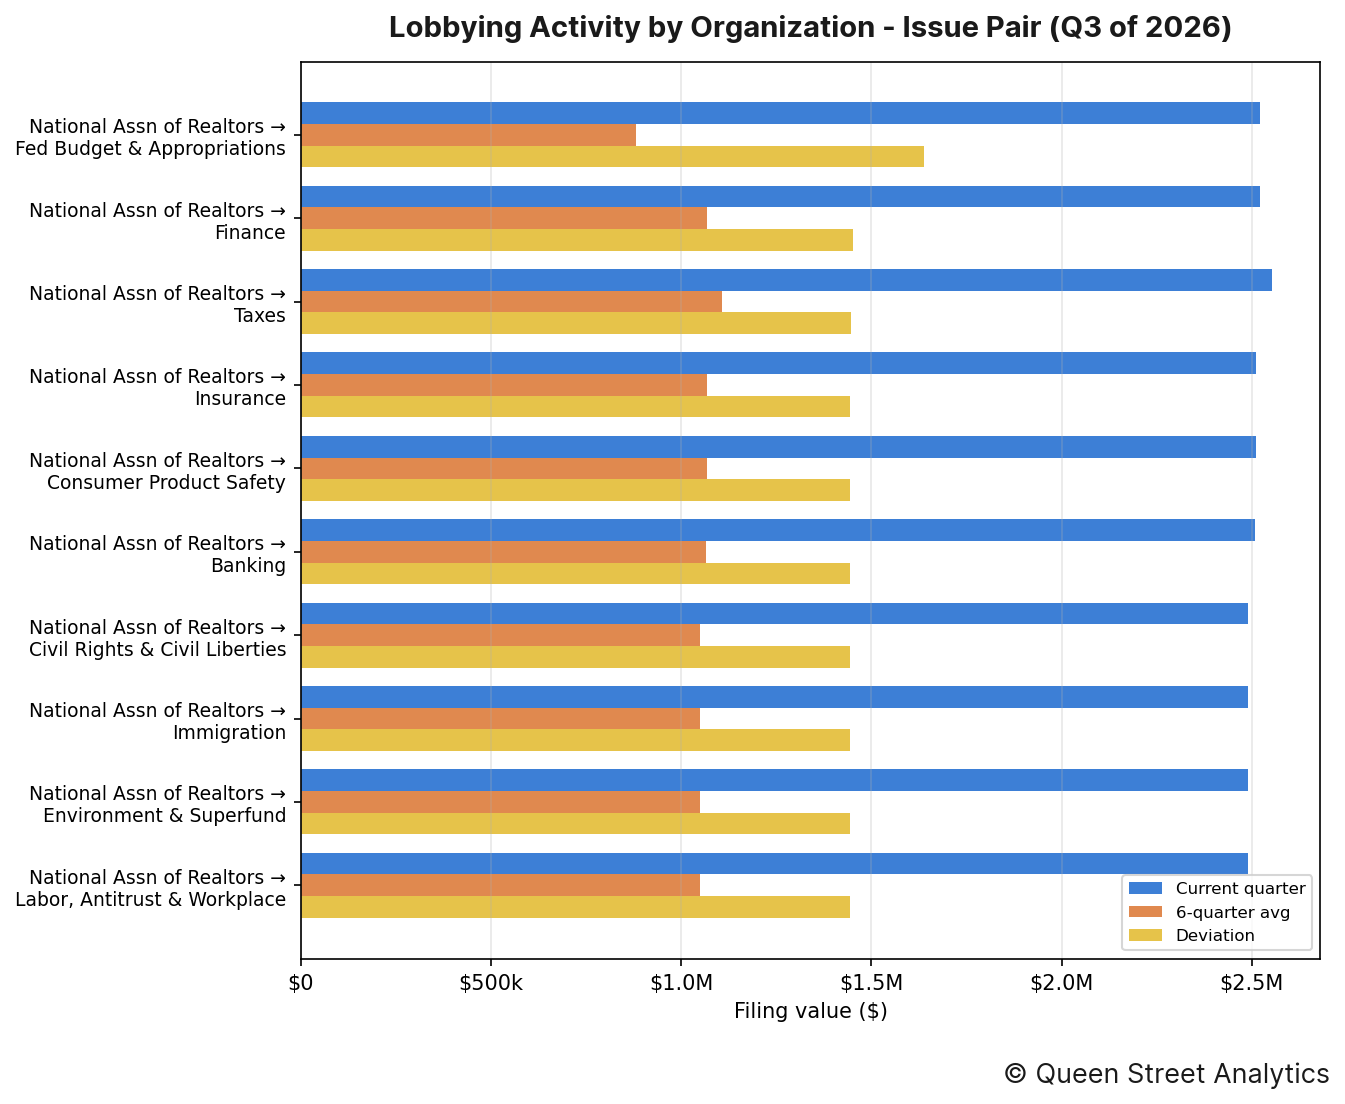
The organization–issue pairings that moved most this quarter were as follows:
↳ National Assn of Realtors put $2.5M toward lobbying on Fed Budget & Appropriations, 186% higher than the recent quarterly average of $882k.
↳ National Assn of Realtors put $2.5M toward lobbying on Finance, 136% higher than the recent quarterly average of $1.1M.
↳ National Assn of Realtors put $2.6M toward lobbying on Taxes, 131% higher than the recent quarterly average of $1.1M.
Section F: Most-Active Lobbyists
The figure below lists the lobbyists who managed the most imputed lobbying value this quarter, alongside their firm or organization. Because a filing's value is split evenly across the lobbyists it names, these dollar figures are imputed rather than directly disclosed.
No lobbyist activity to report this quarter.
Section G: Organization Network
The header image for this edition maps how this channel's organizations (neutral nodes) connect to the federal entities they lobbied (colored nodes) this quarter. A link's weight is the filing value directed to that entity, and node size reflects total value; the House and Senate are excluded (nearly every organization lobbies them) so the specialized targets stand out.
The most widely lobbied entity this quarter was Dept of Treasury, which was lobbied by 19 organizations.
Methodology
Every figure in this report starts from one number: the disclosed value of each lobbying filing, which we take as the income a registrant reported plus any in-house expenses (income + expenses) on its quarterly US Senate and House LDA disclosure. Before totalling anything we clean the filings — applying each amendment over the original it replaces, removing duplicates, and setting aside non-standard records such as registrations and terminations — and map every filing to a lobbying channel and industry using the organization's CRP industry code.
How the money is divided. A filing's full value counts once toward the organization that paid it and that organization's industry, so the industry and organization rankings (Sections A–C) reflect whole dollars. But a single filing usually names several government entities, several issue areas, and several lobbyists at once, and the disclosure never says how the fee was split among them. Rather than credit the full amount to each — which would count the same dollars over and over — we divide a filing's value evenly across the distinct items it names. So a $200,000 filing that lists four agencies contributes $50,000 to each in Section D, and the same even split is applied across issues in Section E and across lobbyists in Section F. That way every section's totals trace back to the same underlying money without double-counting.
Reading the movements. A “deviation” compares the quarter's value to the average of the prior six quarters, so a rise or fall is measured against an entity's own recent norm rather than against the rest of the field. Section B takes the wider view: it sums every industry into one channel total and plots it quarter by quarter, with a fitted line showing the overall direction of travel. Source: US Senate and House LDA disclosures.


