USA Lobbying on Mining - Washington (Q4 2025)





Core Natural Resources INC, Arcelormittal Mining Uk LTD, Cleveland-Cliffs, National Mining Assn, Stillwater Mining CO, Traxys North America Llc were unusually active lobbyists this quarter.
View the interactive network in Queen Street Analytics →
Each quarter we track movements in US federal lobbying, channel by channel. This edition covers Mining for Q4 of 2025, ranking the organizations, government entities, issues, and lobbyists whose disclosed spend moved most.
Central Themes in this Quarter’s Lobby Data
Critical Minerals List Expansion Spurs Sector Activity
The federal government's expanded 2025 Critical Minerals List, which now includes copper, silver, and metallurgical coal, is anticipated to influence investment and reshape permitting procedures, a development closely monitored by BHP Group and the American Exploration & Mining Assn in their advocacy before entities such as the Dept of Energy and the Bureau of Land Management. This move has coincided with heightened filings focusing on appropriations and project support for these vital minerals. Increased attention from mining lobbyists, including efforts by BHP Group and the American Exploration & Mining Assn, suggests a renewed emphasis on securing federal advantages tied to these additions.
📎 Interior Department releases final 2025 List of Critical Minerals · Interior Department releases final 2025 List of Critical Minerals · US releases 2025 list of critical minerals, featuring 10 additions
Federal Funding Reforms Ease Mineral Project Development
The implementation of a unified federal funding and permitting process for critical mineral projects in 2025 has significantly lowered administrative obstacles for mining companies pursuing federal support. Organizations such as the American Exploration & Mining Assn and National Mining Assn have ramped up lobbying activity, targeting the Department of the Interior and the House of Representatives to secure funding and regulatory benefits. Streamlined grant programs and coordination across agencies are reportedly driving faster development, with this surge in advocacy reflecting efforts to maximize opportunities under the reformed process.
📎 Federal Mineral Funding In 2025: Streamlined Processes Signal ... - Mondaq · How Does New U.S. Legislation Impact Critical Minerals Mining? · MINING SNAPSHOT – DRAFT 2025 CRITICAL MINERALS LIST RELEASED
New Legislation Alters Incentives, Lobbying Surges on Tax and Defense
The July passage of the 'One Big Beautiful Bill Act' is expected to reshape incentive structures for U.S. critical mineral projects, especially through changes to Section 45X production tax credits and increased appropriations for defense supply chains. The act's tighter restrictions on foreign entities and phased sunset of credits have prompted intensified lobbying campaigns by firms such as Iperionx Critical Minerals, which engaged with the Dept of Defense (DOD) and the Executive Office of the President (EOP), seeking to maximize access ahead of regulatory shifts.
📎 How Does New U.S. Legislation Impact Critical Minerals Mining? · USA Critical Minerals: The Full 2025 List & Supply Push · Critical Mineral Resources: National Policy and Critical Minerals List
Defense and Trade Focus Drive Mineral Lobbying Uptick
Late-2025 saw increased federal action targeting mineral imports from adversarial countries, alongside Defense Production Act investments and tighter restrictions on Russian and Chinese materials. Agencies and legislators, including the Dept of Commerce and the U.S. Trade Representative (USTR) as lobbied by the National Mining Assn and Talon Nickel USA, enhanced coordination on mineral security, with lobbying efforts reportedly concentrating on defense, trade, and foreign affairs issues relevant to metal mining and processing.
📎 Department of the Interior releases draft 2025 List of Critical Minerals · Final 2025 List of Critical Minerals - Federal Register · The year the US doubled down on critical minerals | Canary Media
Sharp Client Spending Increases Linked to Appropriations and Regulatory Issues
Several prominent mining clients—such as Core Natural Resources, which lobbied the House of Representatives, Senate, Environmental Protection Agency (EPA), and the Executive Office of the President, Arcelormittal Mining, and Traxys North America—recorded sharp rises in lobbying expenditures in Q4 2025. While their focus has included appropriations, regulatory reform, and advanced technology, intense activity around key federal agencies and committees is likely tied to recent expansions in funding opportunities and evolving regulatory frameworks.
📎 Mining Lobbying Profile • OpenSecrets

Section A: Lobbying Spend by Industry
How much each industry in this channel spent on federal lobbying in Q4 of 2025, compared with its average over the prior six quarters.
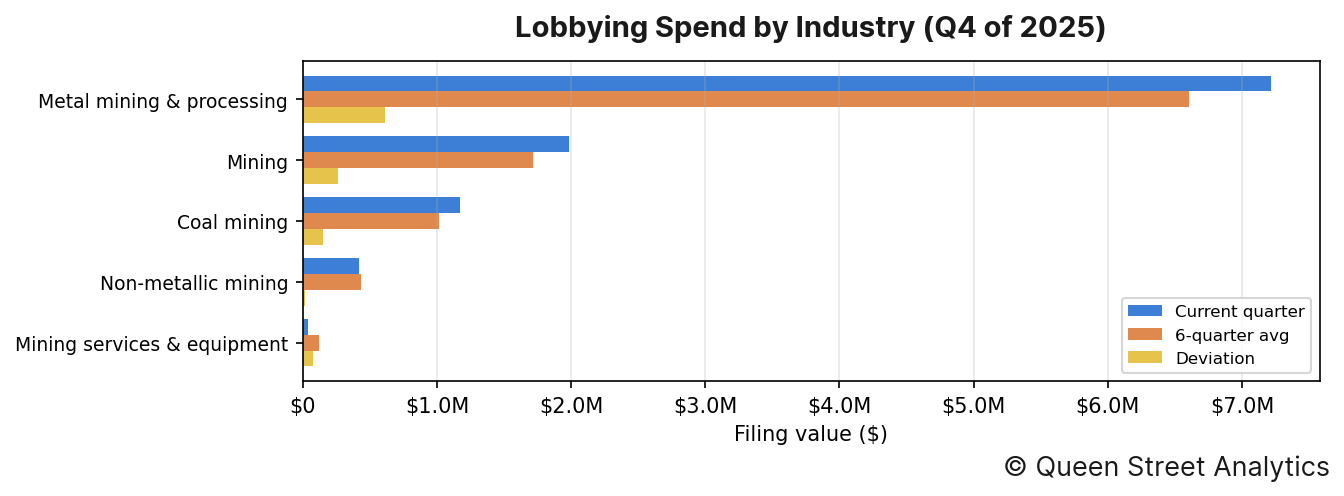
In Q4 of 2025, there was $10.8M worth of disclosed lobbying activity on Mining, roughly in line with the recent quarterly average of $9.9M. This activity can be broken down by industry as follows:
↳ There was $7.2M worth of Metal mining & processing lobbying, roughly in line with the recent quarterly average of $6.6M.
↳ There was $2.0M worth of Mining lobbying, 15% higher than the recent quarterly average of $1.7M.
↳ There was $1.2M worth of Coal mining lobbying, 15% higher than the recent quarterly average of $1.0M.
↳ There was $419k worth of Non-metallic mining lobbying, roughly in line with the recent quarterly average of $434k.
↳ There was $40k worth of Mining services & equipment lobbying, 66% lower than the recent quarterly average of $118k.
Section B: Lobbying Spend Trend
This channel's total disclosed lobbying spend across recent quarters, aggregated over all of its industries.
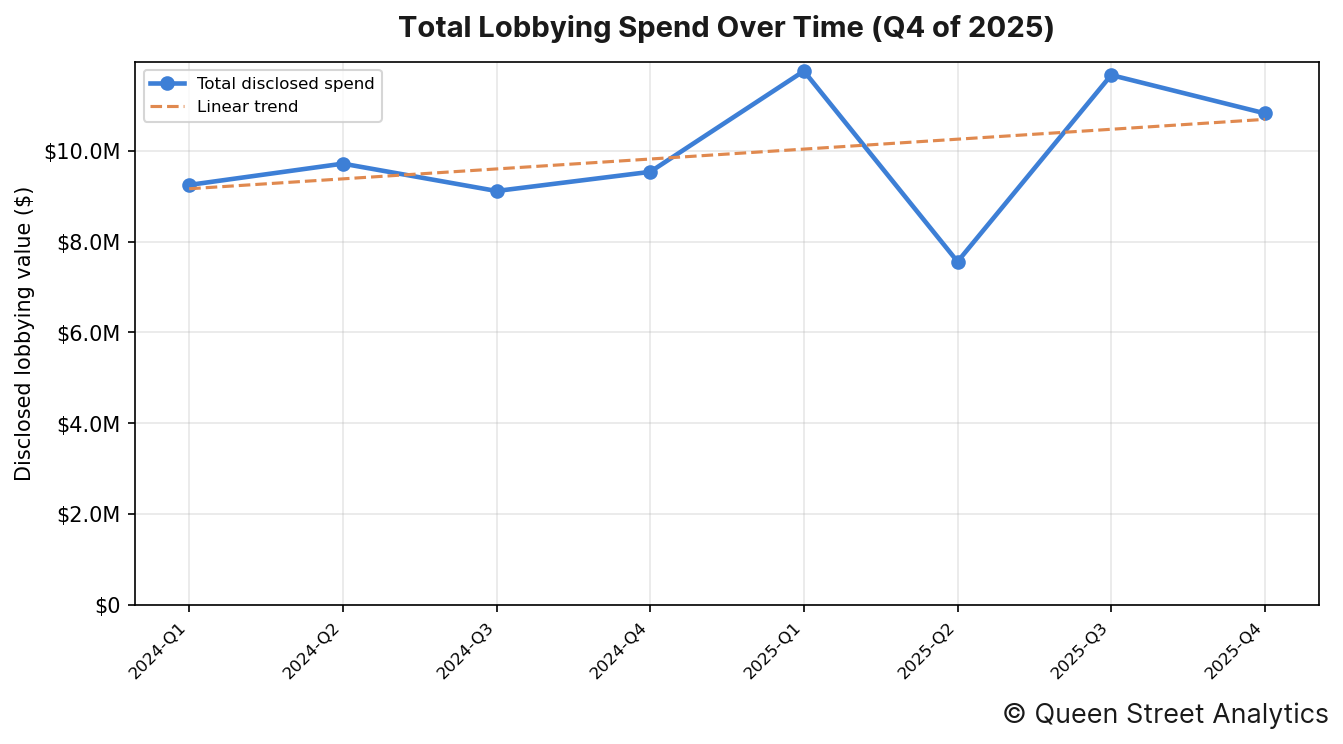
In Q4 of 2025, there was $10.8M worth of disclosed lobbying activity on Mining. Across the 8 quarters shown, the channel's total disclosed spend has risen over this period.
Organizations' Lobby Spend
The image below shows the organizations whose lobbying spend moved most from their six-quarter average.
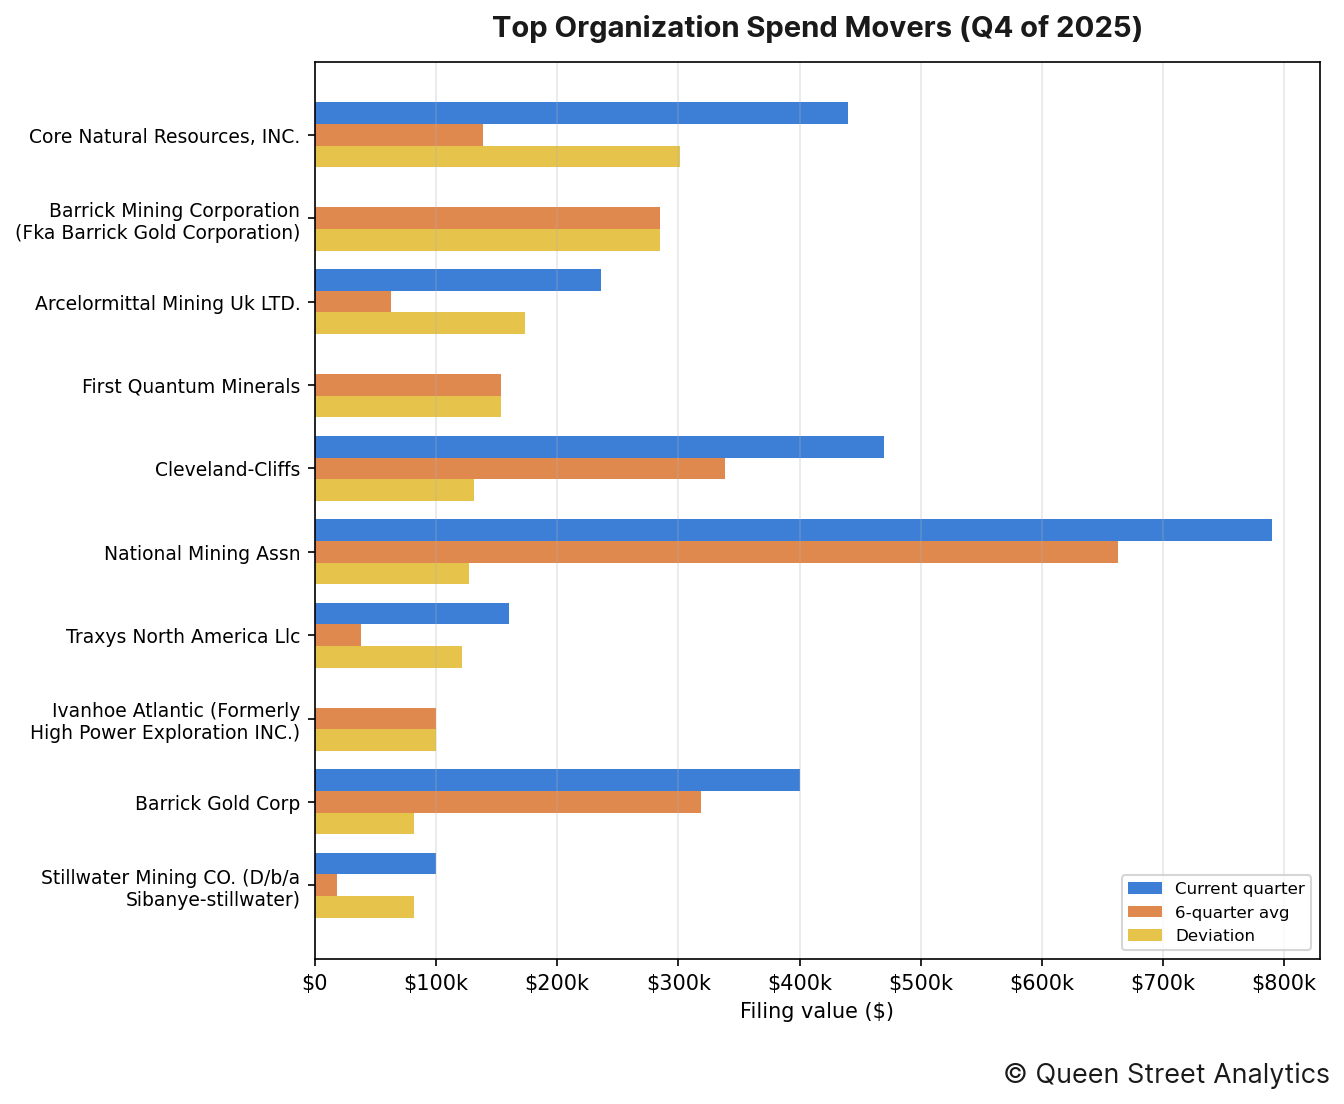
The organizations whose spending moved most from their own recent quarterly average were as follows:
↳ Core Natural Resources, INC. accounted for $440k in disclosed lobbying, 218% higher than the recent quarterly average of $138k.
↳ Barrick Mining Corporation (Fka Barrick Gold Corporation) accounted for $0 in disclosed lobbying, 100% lower than the recent quarterly average of $285k.
↳ Arcelormittal Mining Uk LTD. accounted for $236k in disclosed lobbying, 276% higher than the recent quarterly average of $63k.
↳ First Quantum Minerals accounted for $0 in disclosed lobbying, 100% lower than the recent quarterly average of $153k.
↳ Cleveland-Cliffs accounted for $470k in disclosed lobbying, 39% higher than the recent quarterly average of $338k.
↳ National Mining Assn accounted for $790k in disclosed lobbying, 19% higher than the recent quarterly average of $663k.
Section D: Government Entities Lobbied
This section documents this quarter's most lobbied federal government departments.
By industry
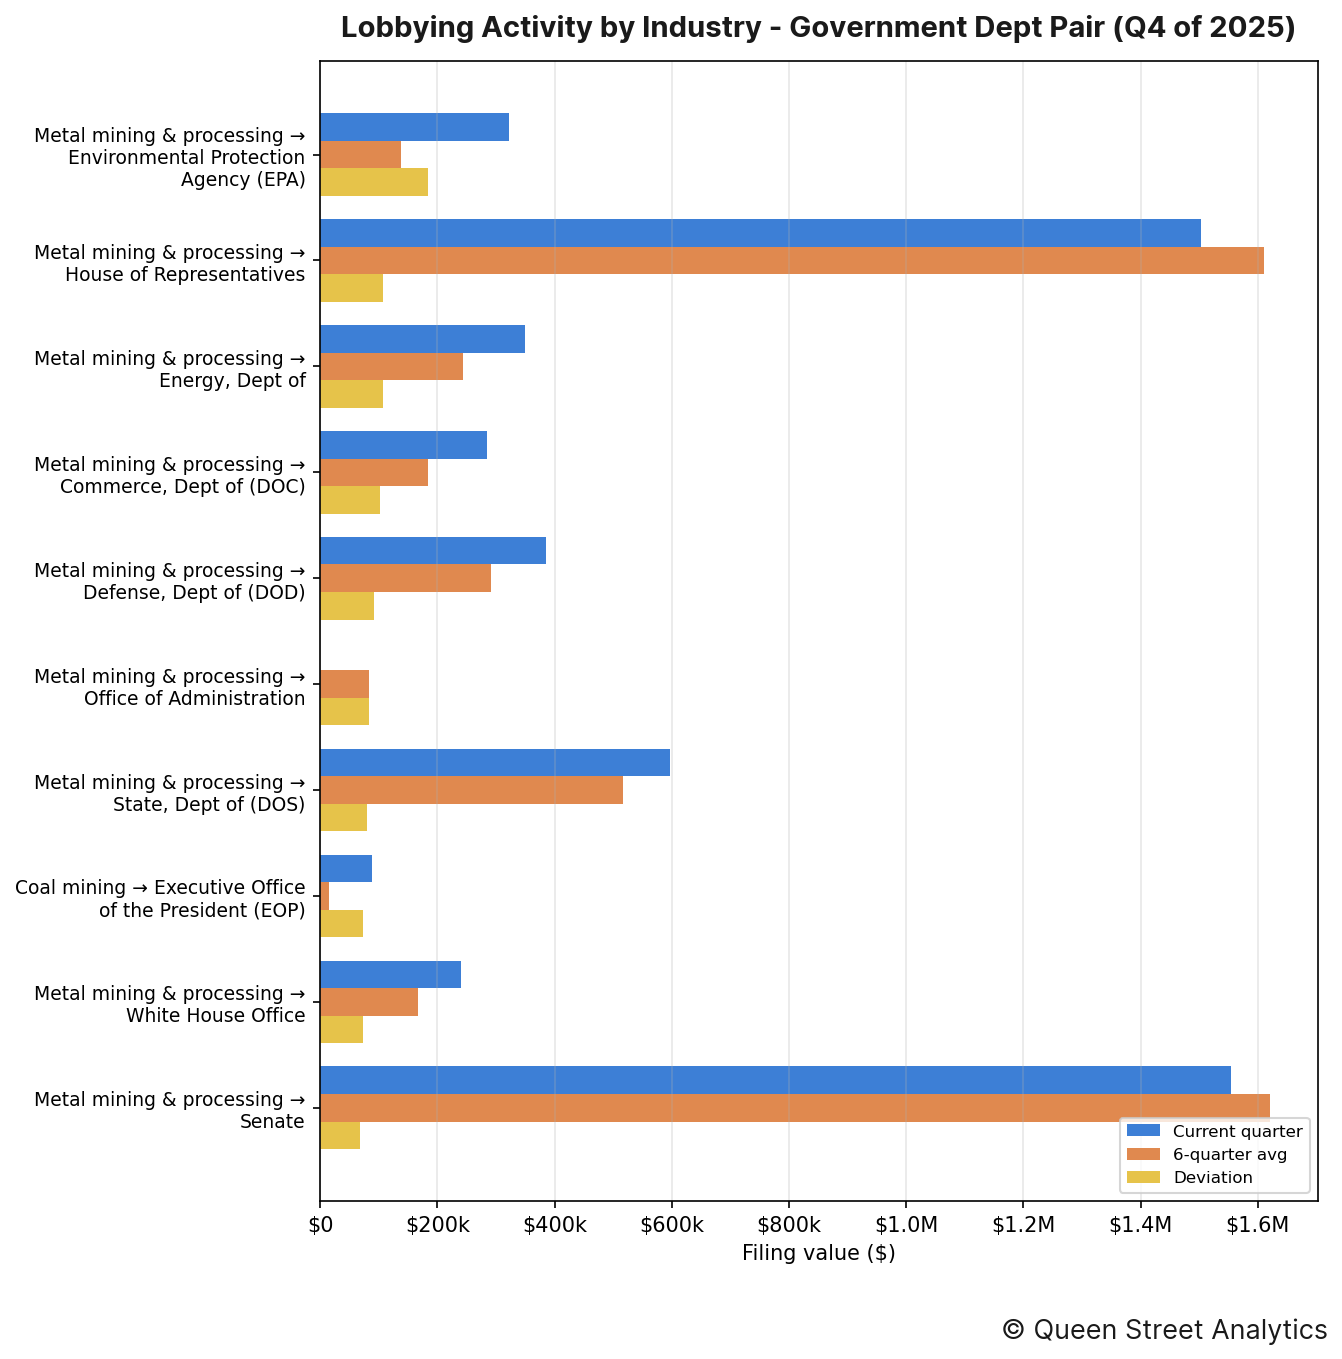
The industry–entity pairings that moved most this quarter were as follows:
↳ Metal mining & processing directed $322k of lobbying toward Environmental Protection Agency (EPA), 133% higher than the recent quarterly average of $138k.
↳ Metal mining & processing directed $1.5M of lobbying toward House of Representatives, roughly in line with the recent quarterly average of $1.6M.
↳ Metal mining & processing directed $350k of lobbying toward Dept of Energy, 44% higher than the recent quarterly average of $243k.
By organization
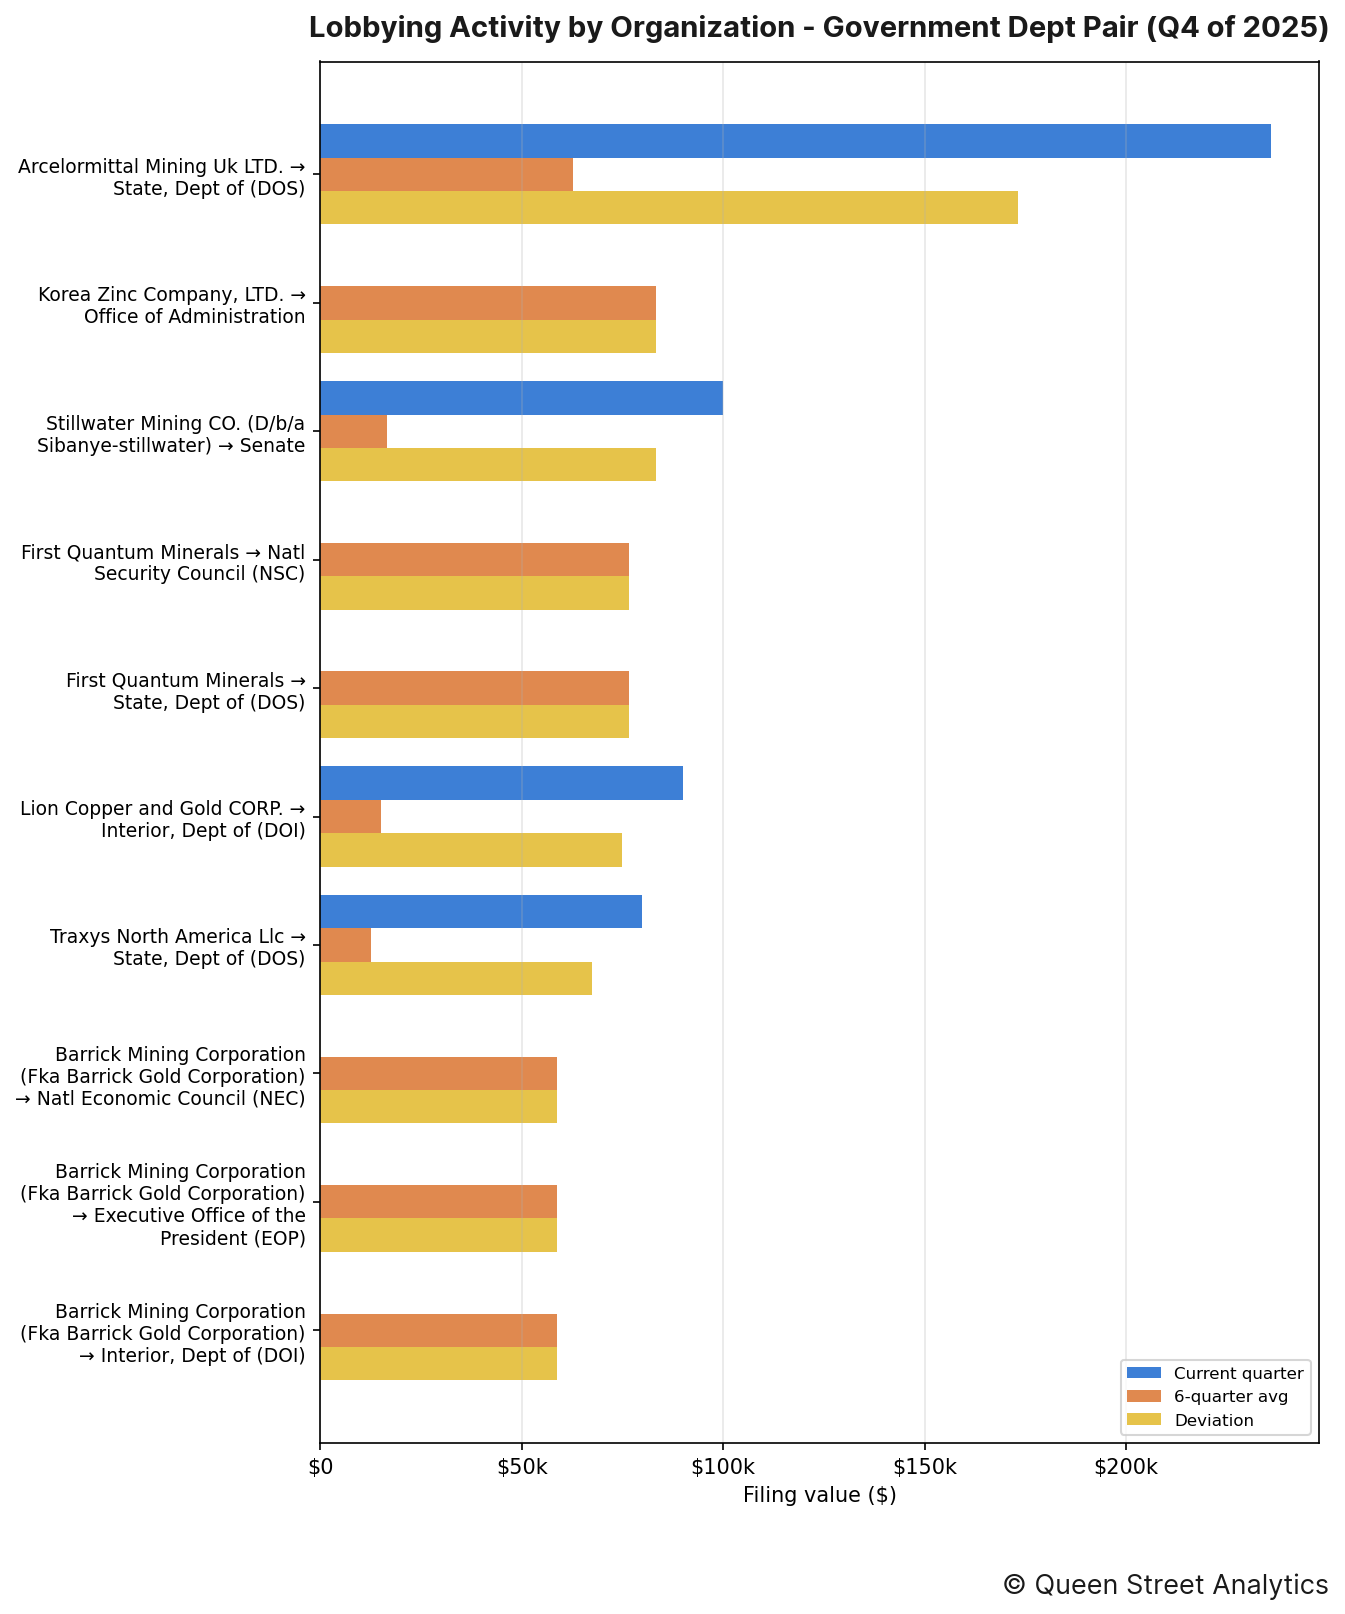
The organization–entity pairings that moved most this quarter were as follows:
↳ Arcelormittal Mining Uk LTD. directed $236k of lobbying toward Dept of State (DOS), 276% higher than the recent quarterly average of $63k.
↳ Korea Zinc Company, LTD. directed $0 of lobbying toward Office of Administration, 100% lower than the recent quarterly average of $83k.
↳ Stillwater Mining CO. (D/b/a Sibanye-stillwater) directed $100k of lobbying toward Senate, 500% higher than the recent quarterly average of $17k.
Section E: Lobbying Issues
This section documents this quarter's most lobbied-on issues.
By industry
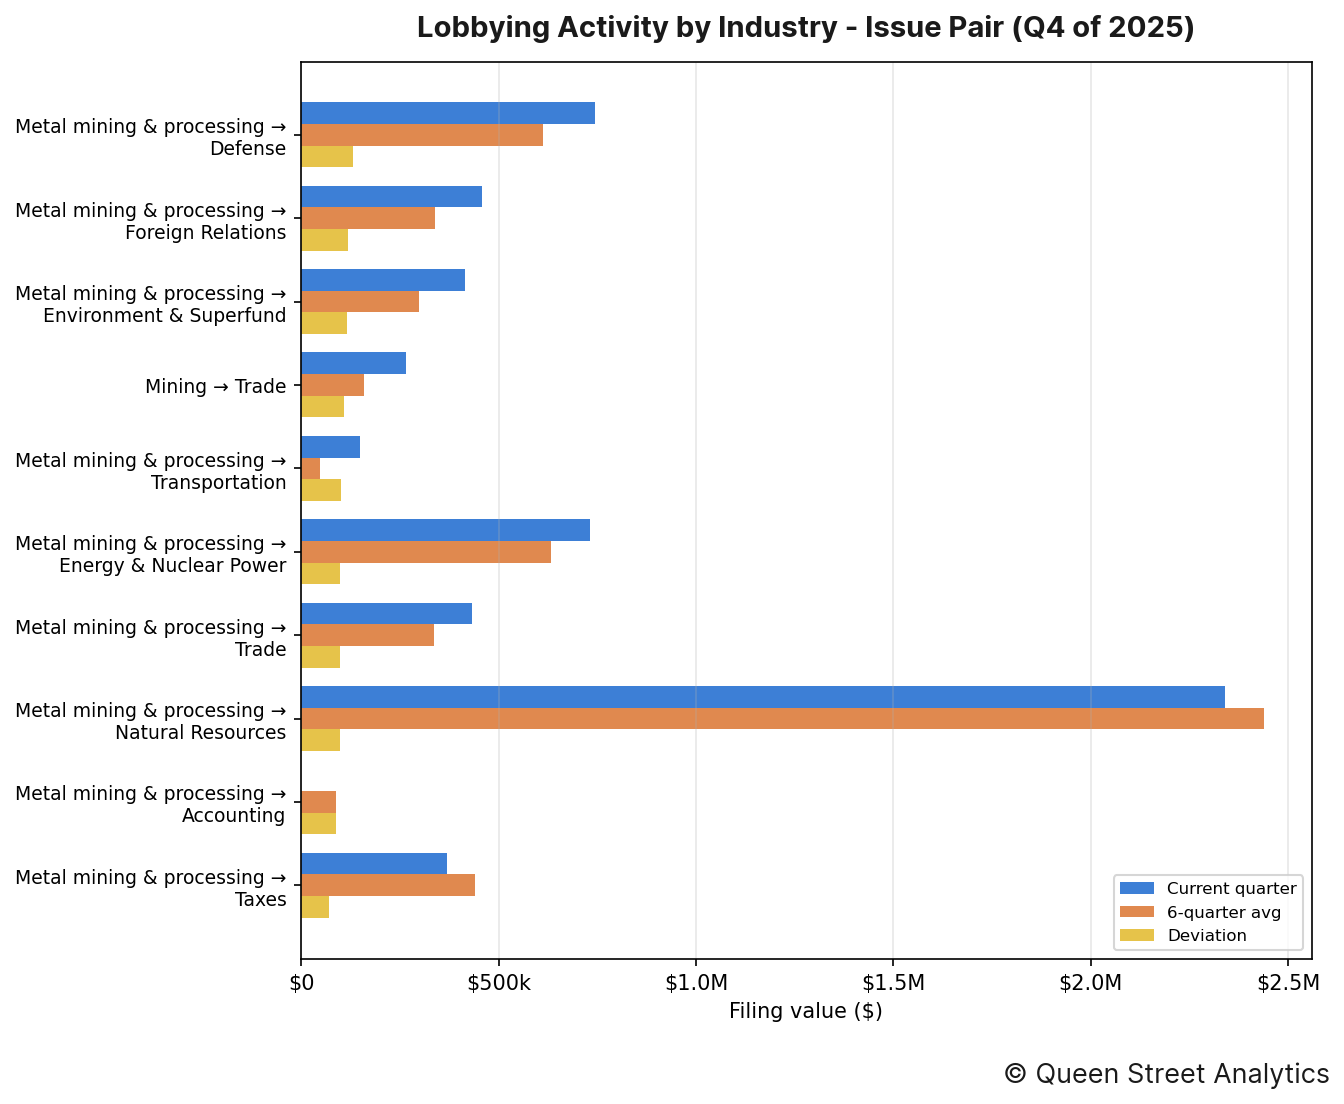
The industry–issue pairings that moved most this quarter were as follows:
↳ Metal mining & processing put $2.3M toward lobbying on Natural Resources, roughly in line with the recent quarterly average of $2.4M.
↳ Metal mining & processing put $745k toward lobbying on Defense, 22% higher than the recent quarterly average of $612k.
↳ Metal mining & processing put $458k toward lobbying on Foreign Relations, 35% higher than the recent quarterly average of $338k.
By organization
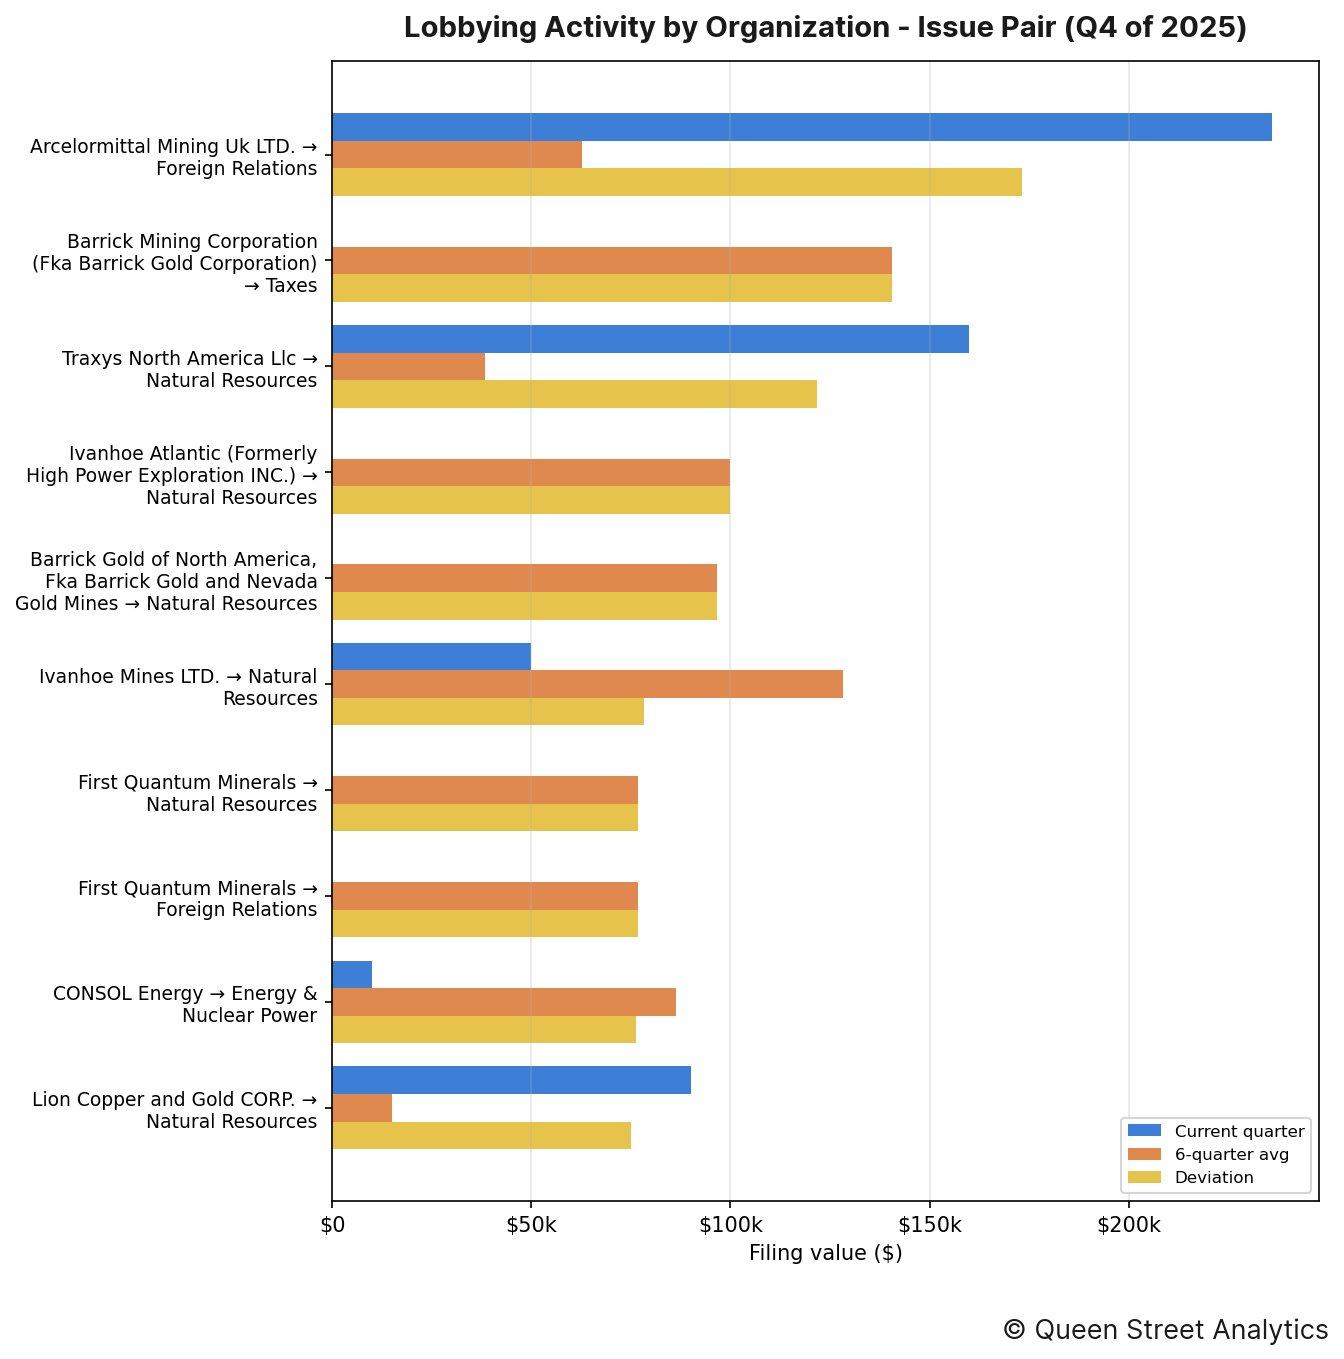
The organization–issue pairings that moved most this quarter were as follows:
↳ Arcelormittal Mining Uk LTD. put $236k toward lobbying on Foreign Relations, 276% higher than the recent quarterly average of $63k.
↳ Barrick Mining Corporation (Fka Barrick Gold Corporation) put $0 toward lobbying on Taxes, 100% lower than the recent quarterly average of $141k.
↳ Traxys North America Llc put $160k toward lobbying on Natural Resources, 317% higher than the recent quarterly average of $38k.
Section F: Most-Active Lobbyists
The figure below lists the lobbyists who managed the most imputed lobbying value this quarter, alongside their firm or organization. Because a filing's value is split evenly across the lobbyists it names, these dollar figures are imputed rather than directly disclosed.
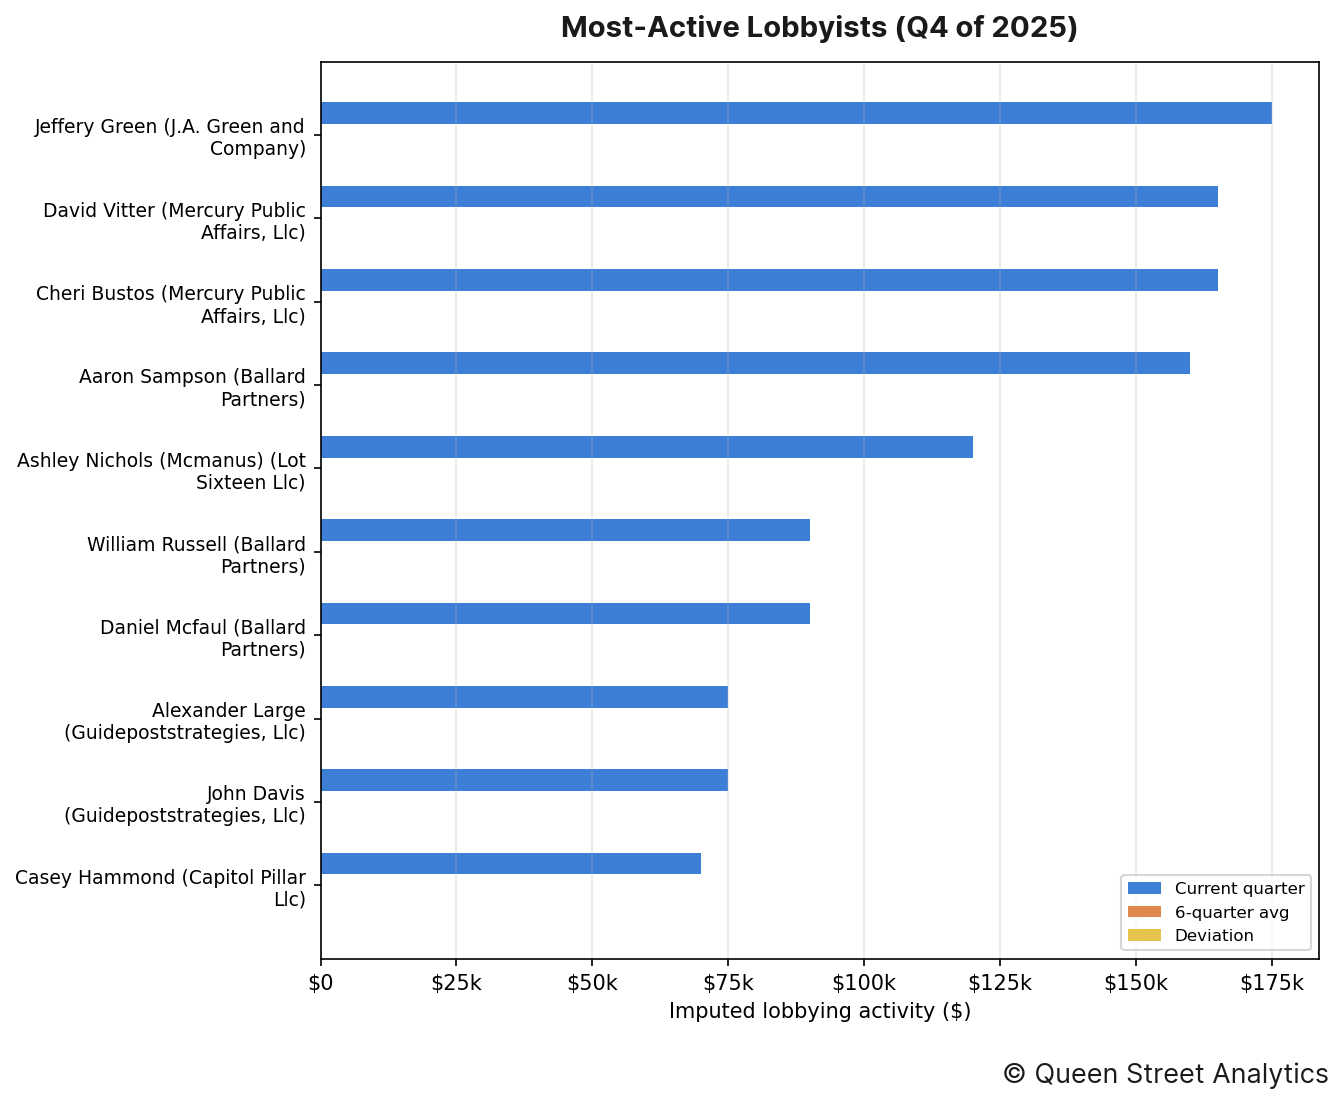
The lobbyists who managed the most imputed lobbying value this quarter were as follows:
↳ Jeffery Green (J.A. Green and Company) was credited with an imputed $175k in lobbying activity.
↳ David Vitter (Mercury Public Affairs, Llc) was credited with an imputed $165k in lobbying activity.
↳ Cheri Bustos (Mercury Public Affairs, Llc) was credited with an imputed $165k in lobbying activity.
↳ Aaron Sampson (Ballard Partners) was credited with an imputed $160k in lobbying activity.
↳ Ashley Nichols (Mcmanus) (Lot Sixteen Llc) was credited with an imputed $120k in lobbying activity.
Section G: Organization Network
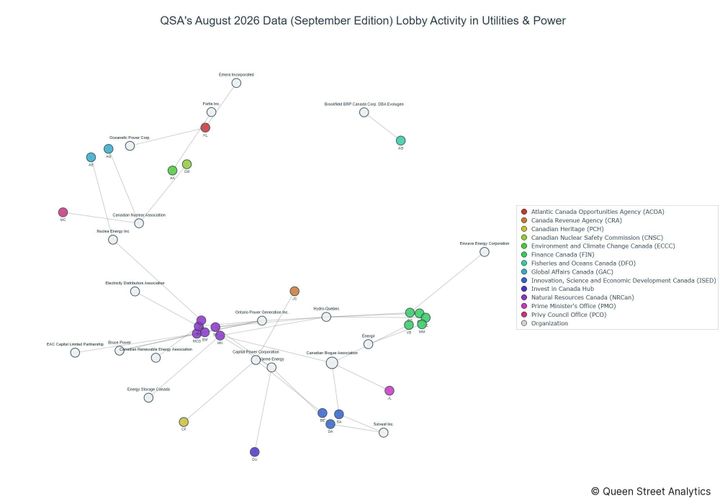
The header image for this edition maps how this channel's organizations (neutral nodes) connect to the federal entities they lobbied (colored nodes) this quarter. A link's weight is the filing value directed to that entity, and node size reflects total value; the House and Senate are excluded (nearly every organization lobbies them) so the specialized targets stand out.
The most widely lobbied entity this quarter was Dept of Energy, which was lobbied by 13 organizations.
Methodology
Every figure in this report starts from one number: the disclosed value of each lobbying filing, which we take as the income a registrant reported plus any in-house expenses (income + expenses) on its quarterly US Senate and House LDA disclosure. Before totalling anything we clean the filings — applying each amendment over the original it replaces, removing duplicates, and setting aside non-standard records such as registrations and terminations — and map every filing to a lobbying channel and industry using the organization's CRP industry code.
How the money is divided. A filing's full value counts once toward the organization that paid it and that organization's industry, so the industry and organization rankings (Sections A–C) reflect whole dollars. But a single filing usually names several government entities, several issue areas, and several lobbyists at once, and the disclosure never says how the fee was split among them. Rather than credit the full amount to each — which would count the same dollars over and over — we divide a filing's value evenly across the distinct items it names. So a $200,000 filing that lists four agencies contributes $50,000 to each in Section D, and the same even split is applied across issues in Section E and across lobbyists in Section F. That way every section's totals trace back to the same underlying money without double-counting.
Reading the movements. A “deviation” compares the quarter's value to the average of the prior six quarters, so a rise or fall is measured against an entity's own recent norm rather than against the rest of the field. Section B takes the wider view: it sums every industry into one channel total and plots it quarter by quarter, with a fitted line showing the overall direction of travel. Source: US Senate and House LDA disclosures.