USA Lobbying on Oil & Gas - Washington (Q4 2025)





Phillips 66, Occidental Petroleum, ConocoPhillips, BP America, Washington Gas Light Co, and American Fuel & Petrochem Manufacturers were unusually active lobbyists this quarter.
View the interactive network in Queen Street Analytics →
Each quarter we track movements in US federal lobbying, channel by channel. This edition covers Oil & Gas for Q4 of 2025, ranking the organizations, government entities, issues, and lobbyists whose disclosed spend moved most.
Central Themes in this Quarter’s Lobby Data
EPA Cleanup Plan Spurs Legal and Lobbying Action in Passaic River Case
EPA’s finalization of the Lister Ave. cleanup plan and Occidental’s appeal on cost allocation occurred alongside a measurable rise in oil and gas lobbying related to Superfund liability issues, with the American Petroleum Institute engaging the Environmental Protection Agency and the House of Representatives. The complexity and high stakes of the settlement and litigation appear to have prompted industry efforts, including those by Occidental Petroleum and the American Petroleum Institute, to influence regulatory pathways and liability standards before key federal entities.
📎 EPA Finalizes Cleanup Plan for Lister Ave. at Diamond Alkali Superfund ... · OxyChem fights responsibility for most of Passaic River cleanup | NJ ... · Court Approves $150M Settlement for Diamond Alkali Superfund Site · U.S. EPA finalizes cleanup plan for Newark Superfund Site
Legislative Momentum for Permitting and PHMSA Reform Draws Industry Advocacy
Recent lobbying surges, including activity by the American Petroleum Institute targeting the House of Representatives and the Senate, are linked to congressional activity on permitting reform and PHMSA reauthorization, including the SPEED Act. Oil and gas trade groups such as Devon Energy are apparently pushing for expedited review processes and regulatory clarity as these bills advance in late 2025.
📎 Congress.gov - H.R.4776 SPEED Act · Politico coverage on PHMSA reauthorizations
LNG Export Policy Scrutiny Incites Major Lobbying Campaigns
The Biden administration’s review of LNG export approvals and discussions about sanctions appear to have prompted notable oil and gas sector lobbying, with Chevron Corp and Occidental Petroleum actively engaging with federal entities such as the House of Representatives and the Senate, aimed at influencing federal decisions. Industry respondents have publicly advocated for maintaining swift permitting and opposed additional restrictions, signaling heightened sector engagement.
📎 Reuters: US reviewing LNG export policy · Bloomberg: Oil/Gas Trade Lobbies Respond to US Policy · S&P Global: Industry groups raise alarms
IRS Guidance for Clean Fuel Credit Triggers Comment Drives from Oil & Gas
Draft Section 45Z Clean Fuel Credit guidance generated concerted lobbying as stakeholders, including Chevron Corp and the American Petroleum Institute, sought to influence technical eligibility and carbon accounting rules through outreach to the Environmental Protection Agency and the House of Representatives. With tax policy uncertainty, oil and gas lobbyists coordinated responses aiming to shape the IRS regulations in favor of broader industry interests.
📎 Bloomberg Law coverage of 45Z guidance issuance · IRS 45Z News Release
‘Polluters Pay’ Policy Debates Heighten Corporate Liability Lobbying
Momentum around New Jersey’s ‘Polluters Pay’ Act—despite its stalling—has prompted elevated national lobbying by the American Petroleum Institute and the Interstate Natural Gas Assn of America, with particular focus on the Council on Environmental Quality (CEQ) and the Environmental Protection Agency (EPA), about environmental liability. These advocacy efforts have paralleled major EPA and Superfund actions in the Passaic River case, contributing to a climate of heightened engagement on financial responsibility measures.
📎 Why Newark’s Passaic River Cleanup Is Still Stuck - TAPinto

Section A: Lobbying Spend by Industry
How much each industry in this channel spent on federal lobbying in Q4 of 2025, compared with its average over the prior six quarters.
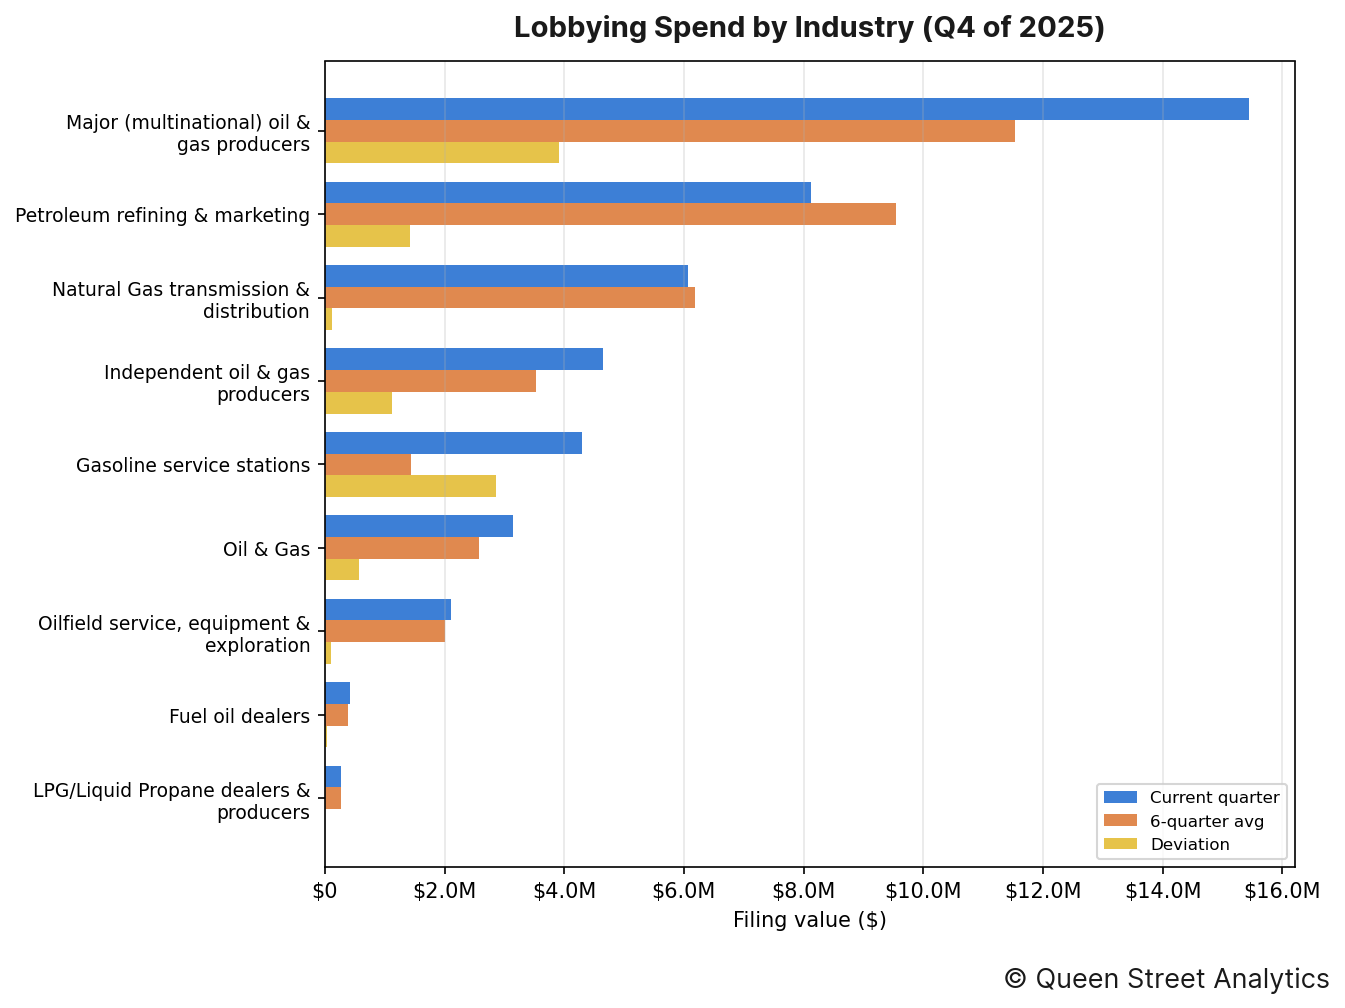
In Q4 of 2025, there was $44.2M worth of disclosed lobbying activity on Oil & Gas, 18% higher than the recent quarterly average of $37.5M. This activity can be broken down by industry as follows:
↳ There was $15.4M worth of Major (multinational) oil & gas producers lobbying, 34% higher than the recent quarterly average of $11.5M.
↳ There was $8.1M worth of Petroleum refining & marketing lobbying, 15% lower than the recent quarterly average of $9.5M.
↳ There was $6.1M worth of Natural Gas transmission & distribution lobbying, roughly in line with the recent quarterly average of $6.2M.
↳ There was $4.3M worth of Independent oil & gas producers lobbying, 23% higher than the recent quarterly average of $3.5M.
↳ There was $4.3M worth of Gasoline service stations lobbying, 198% higher than the recent quarterly average of $1.4M.
↳ There was $3.1M worth of Oil & Gas lobbying, 22% higher than the recent quarterly average of $2.6M.
Section B: Lobbying Spend Trend
This channel's total disclosed lobbying spend across recent quarters, aggregated over all of its industries.
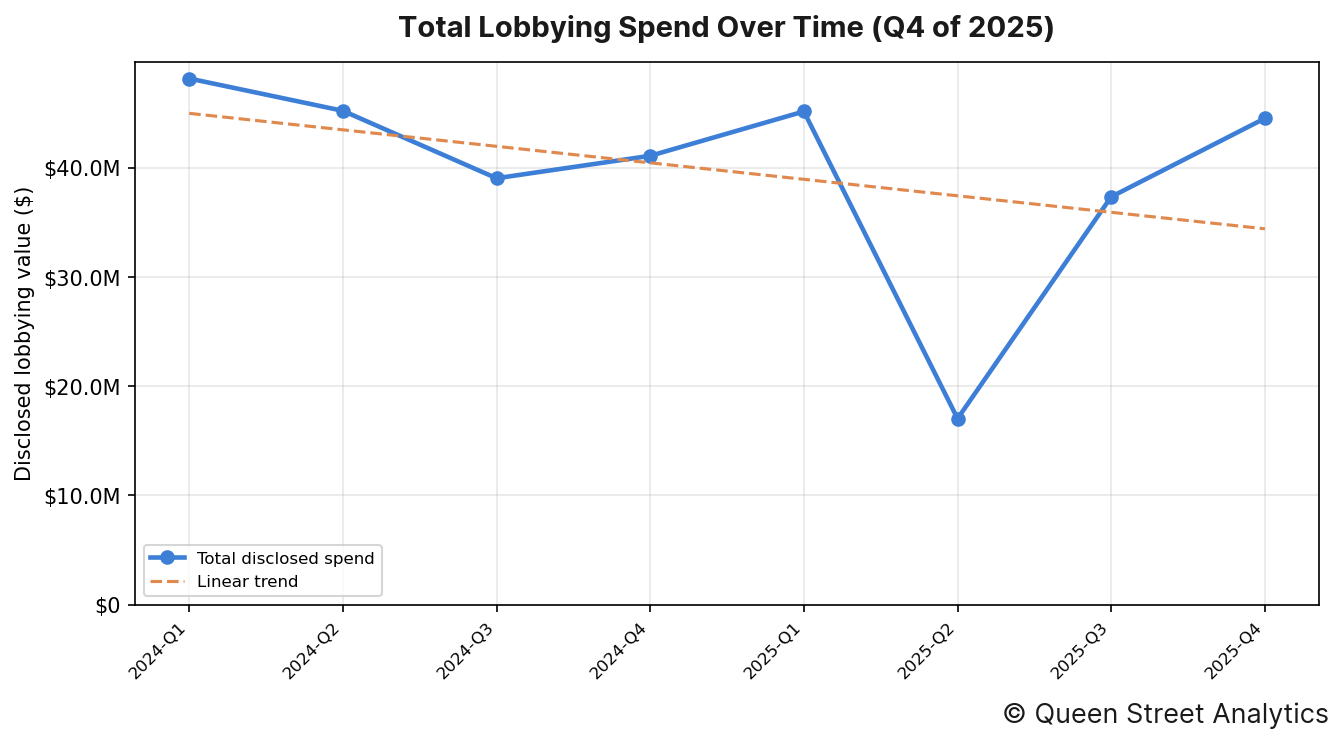
In Q4 of 2025, there was $44.2M worth of disclosed lobbying activity on Oil & Gas. Across the 8 quarters shown, the channel's total disclosed spend has held roughly steady over this period.
Organizations' Lobby Spend
The image below shows the organizations whose lobbying spend moved most from their six-quarter average.
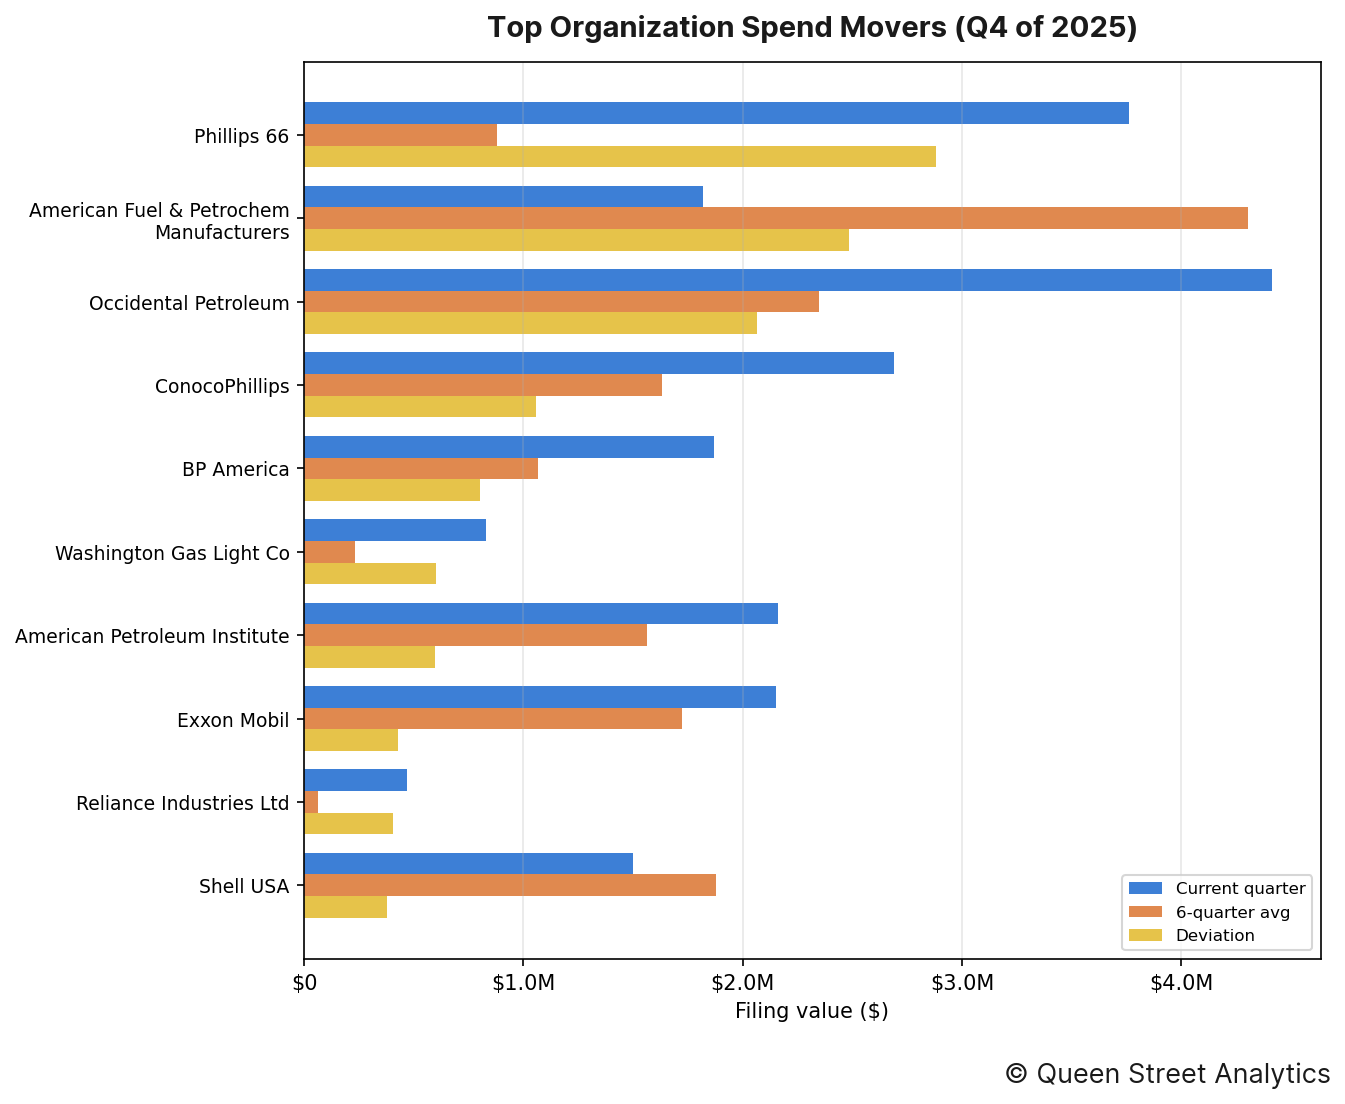
The organizations whose spending moved most from their own recent quarterly average were as follows:
↳ Phillips 66 accounted for $3.8M in disclosed lobbying, 327% higher than the recent quarterly average of $880k.
↳ American Fuel & Petrochem Manufacturers accounted for $1.8M in disclosed lobbying, 58% lower than the recent quarterly average of $4.3M.
↳ Occidental Petroleum accounted for $4.4M in disclosed lobbying, 88% higher than the recent quarterly average of $2.3M.
↳ ConocoPhillips accounted for $2.7M in disclosed lobbying, 65% higher than the recent quarterly average of $1.6M.
↳ BP America accounted for $1.9M in disclosed lobbying, 75% higher than the recent quarterly average of $1.1M.
↳ Washington Gas Light Co accounted for $830k in disclosed lobbying, 260% higher than the recent quarterly average of $231k.
Section D: Government Entities Lobbied
This section documents this quarter's most lobbied federal government departments.
By industry
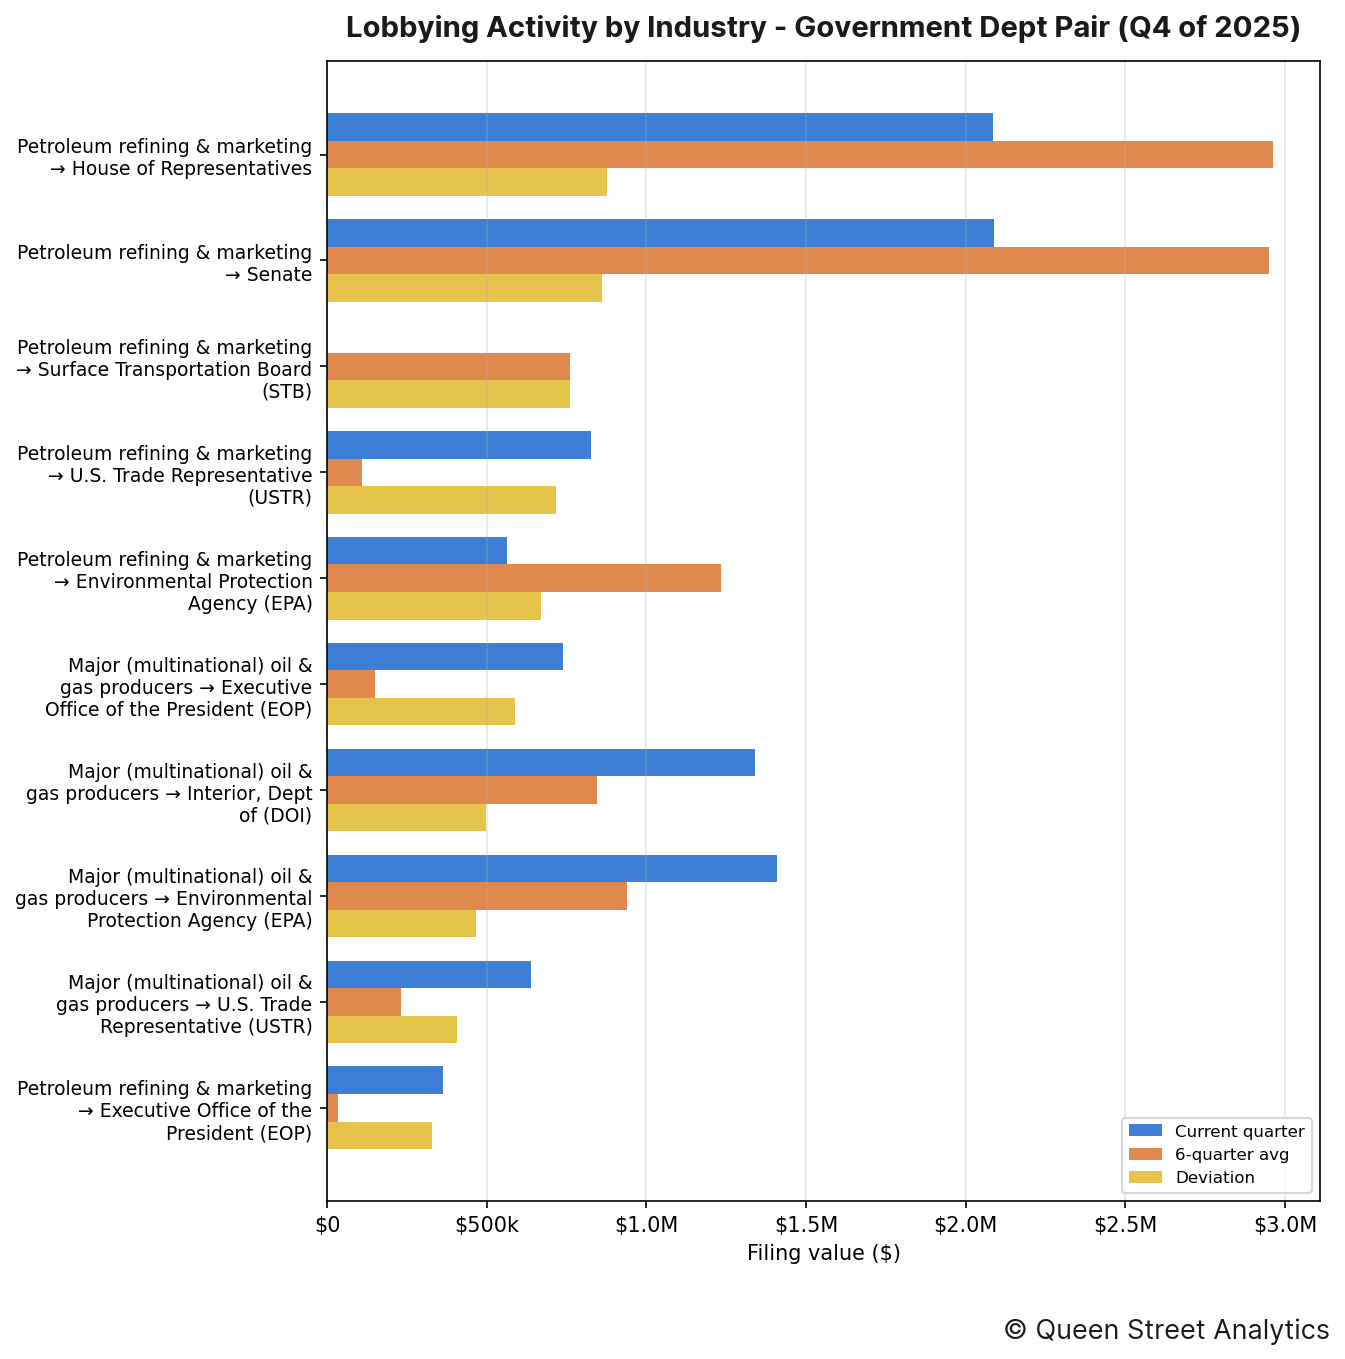
The industry–entity pairings that moved most this quarter were as follows:
↳ Petroleum refining & marketing directed $2.1M of lobbying toward House of Representatives, 30% lower than the recent quarterly average of $3.0M.
↳ Petroleum refining & marketing directed $2.1M of lobbying toward Senate, 29% lower than the recent quarterly average of $2.9M.
↳ Petroleum refining & marketing directed $0 of lobbying toward Surface Transportation Board (STB), 100% lower than the recent quarterly average of $760k.
By organization
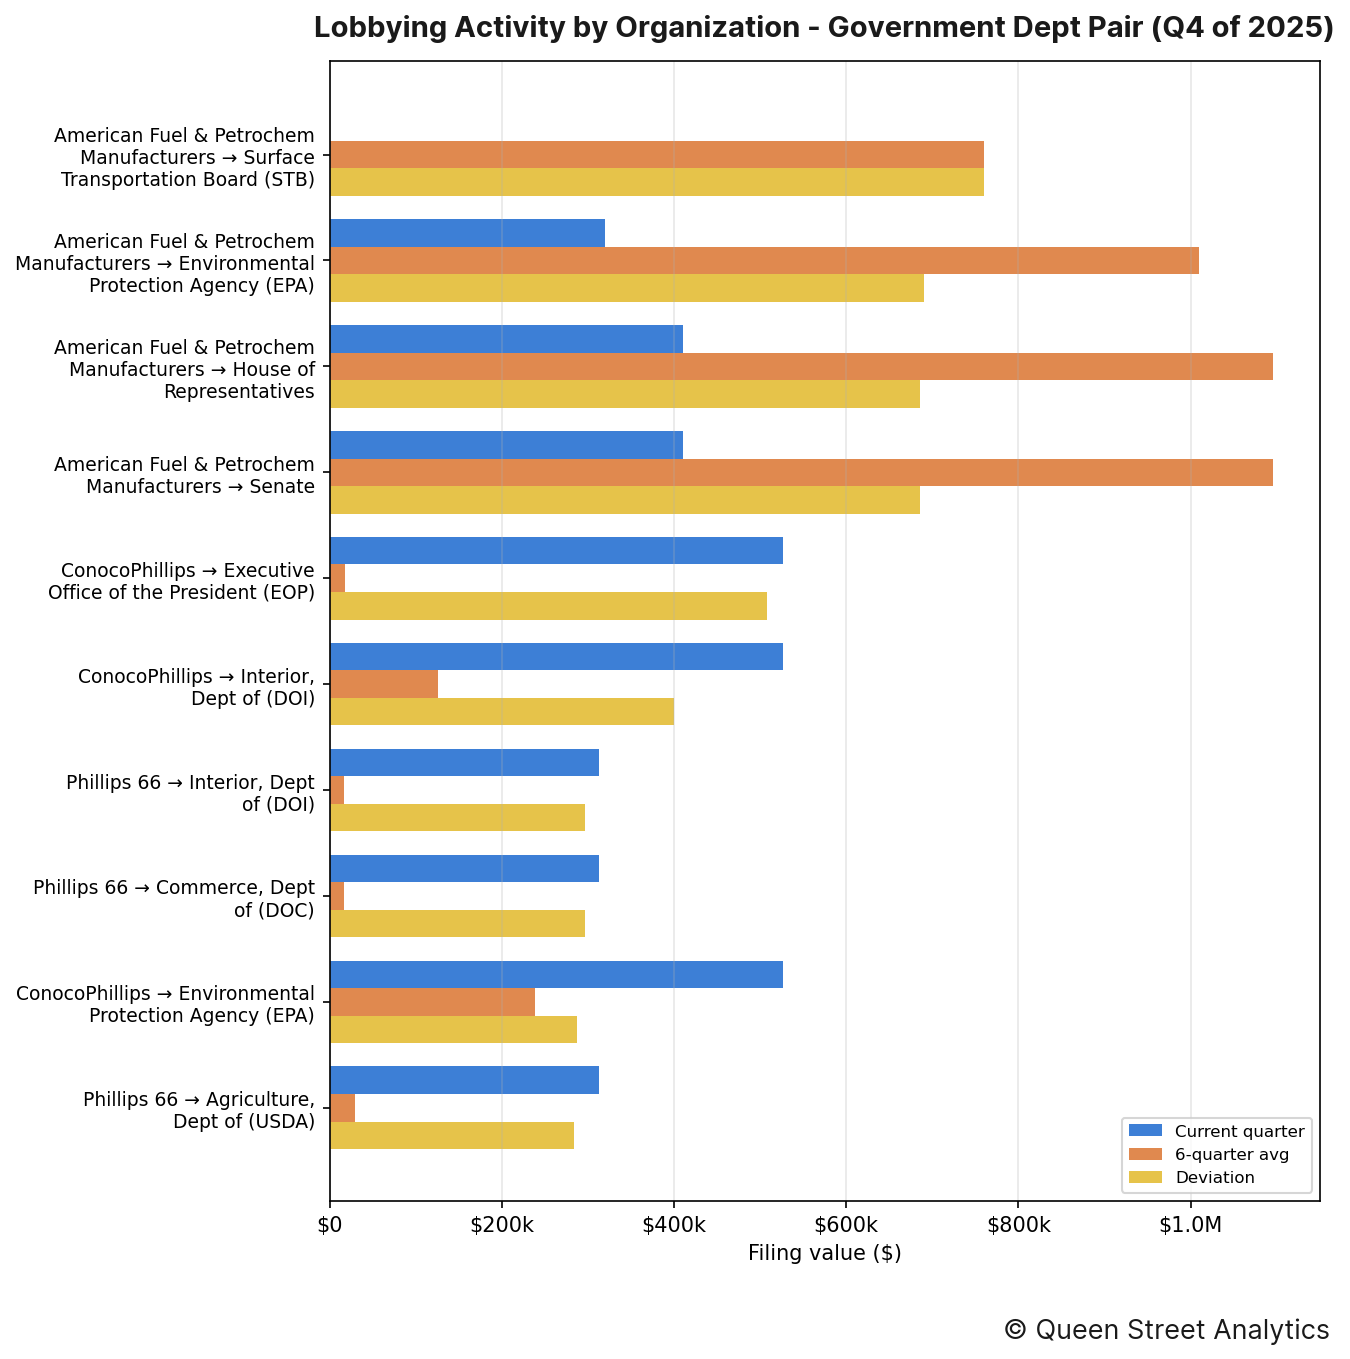
The organization–entity pairings that moved most this quarter were as follows:
↳ American Fuel & Petrochem Manufacturers directed $0 of lobbying toward Surface Transportation Board (STB), 100% lower than the recent quarterly average of $760k.
↳ American Fuel & Petrochem Manufacturers directed $320k of lobbying toward Environmental Protection Agency (EPA), 68% lower than the recent quarterly average of $1.0M.
↳ American Fuel & Petrochem Manufacturers directed $410k of lobbying toward Senate, 63% lower than the recent quarterly average of $1.1M.
Section E: Lobbying Issues
This section documents this quarter's most lobbied-on issues.
By industry
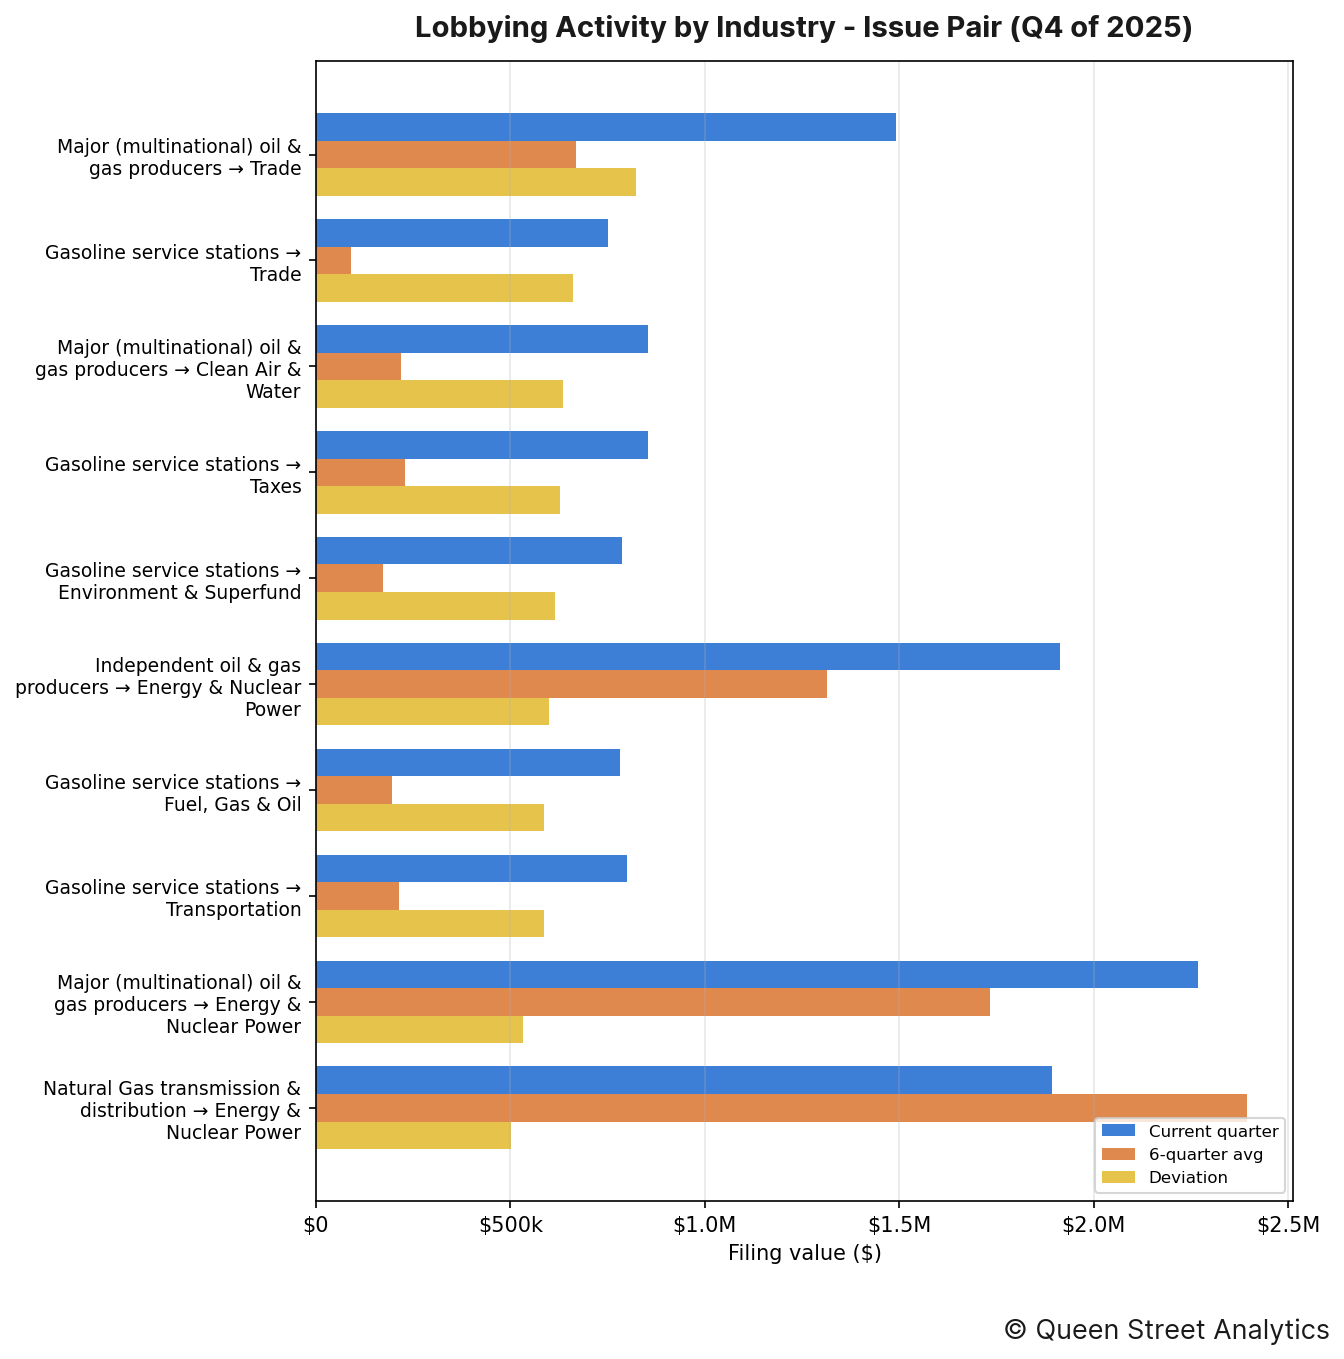
The industry–issue pairings that moved most this quarter were as follows:
↳ Major (multinational) oil & gas producers put $1.5M toward lobbying on Trade, 123% higher than the recent quarterly average of $668k.
↳ Gasoline service stations put $752k toward lobbying on Trade, 726% higher than the recent quarterly average of $91k.
↳ Major (multinational) oil & gas producers put $853k toward lobbying on Clean Air & Water, 292% higher than the recent quarterly average of $218k.
By organization
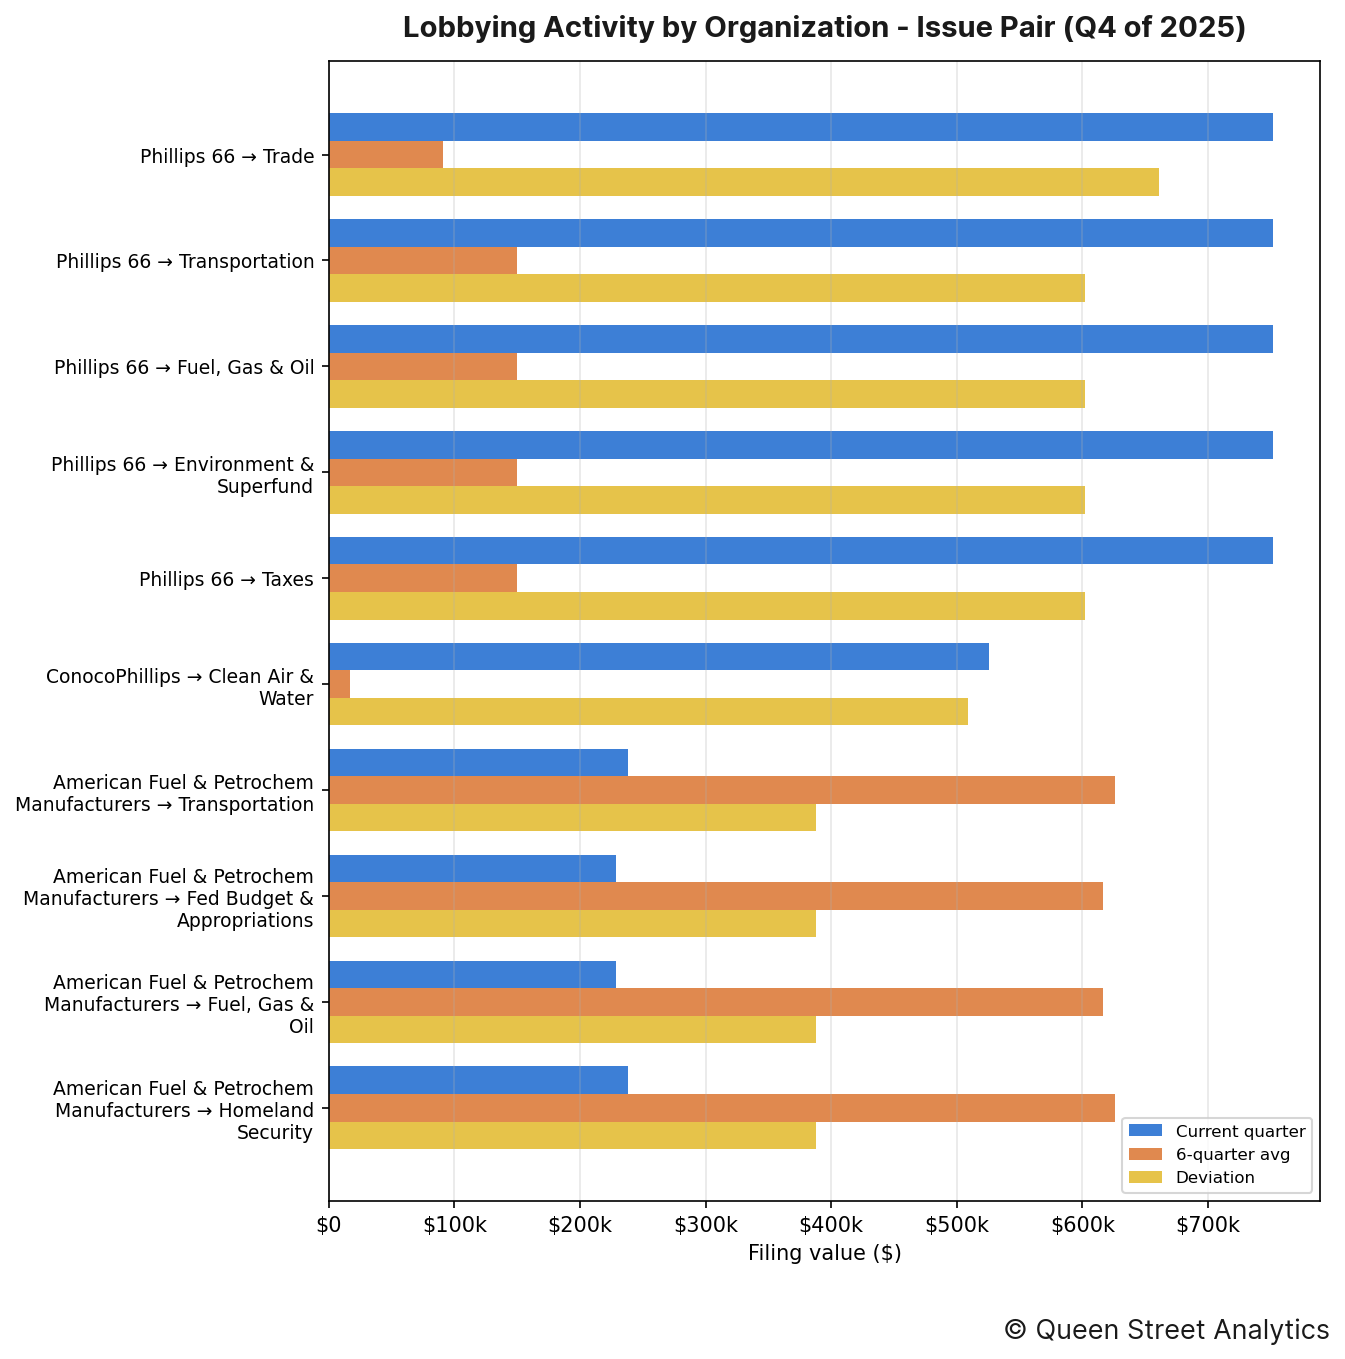
The organization–issue pairings that moved most this quarter were as follows:
↳ Phillips 66 put $752k toward lobbying on Trade, 726% higher than the recent quarterly average of $91k.
↳ Phillips 66 put $752k toward lobbying on Transportation, 402% higher than the recent quarterly average of $150k.
↳ Phillips 66 put $752k toward lobbying on Taxes, 402% higher than the recent quarterly average of $150k.
Section F: Most-Active Lobbyists
The figure below lists the lobbyists who managed the most imputed lobbying value this quarter, alongside their firm or organization. Because a filing's value is split evenly across the lobbyists it names, these dollar figures are imputed rather than directly disclosed.
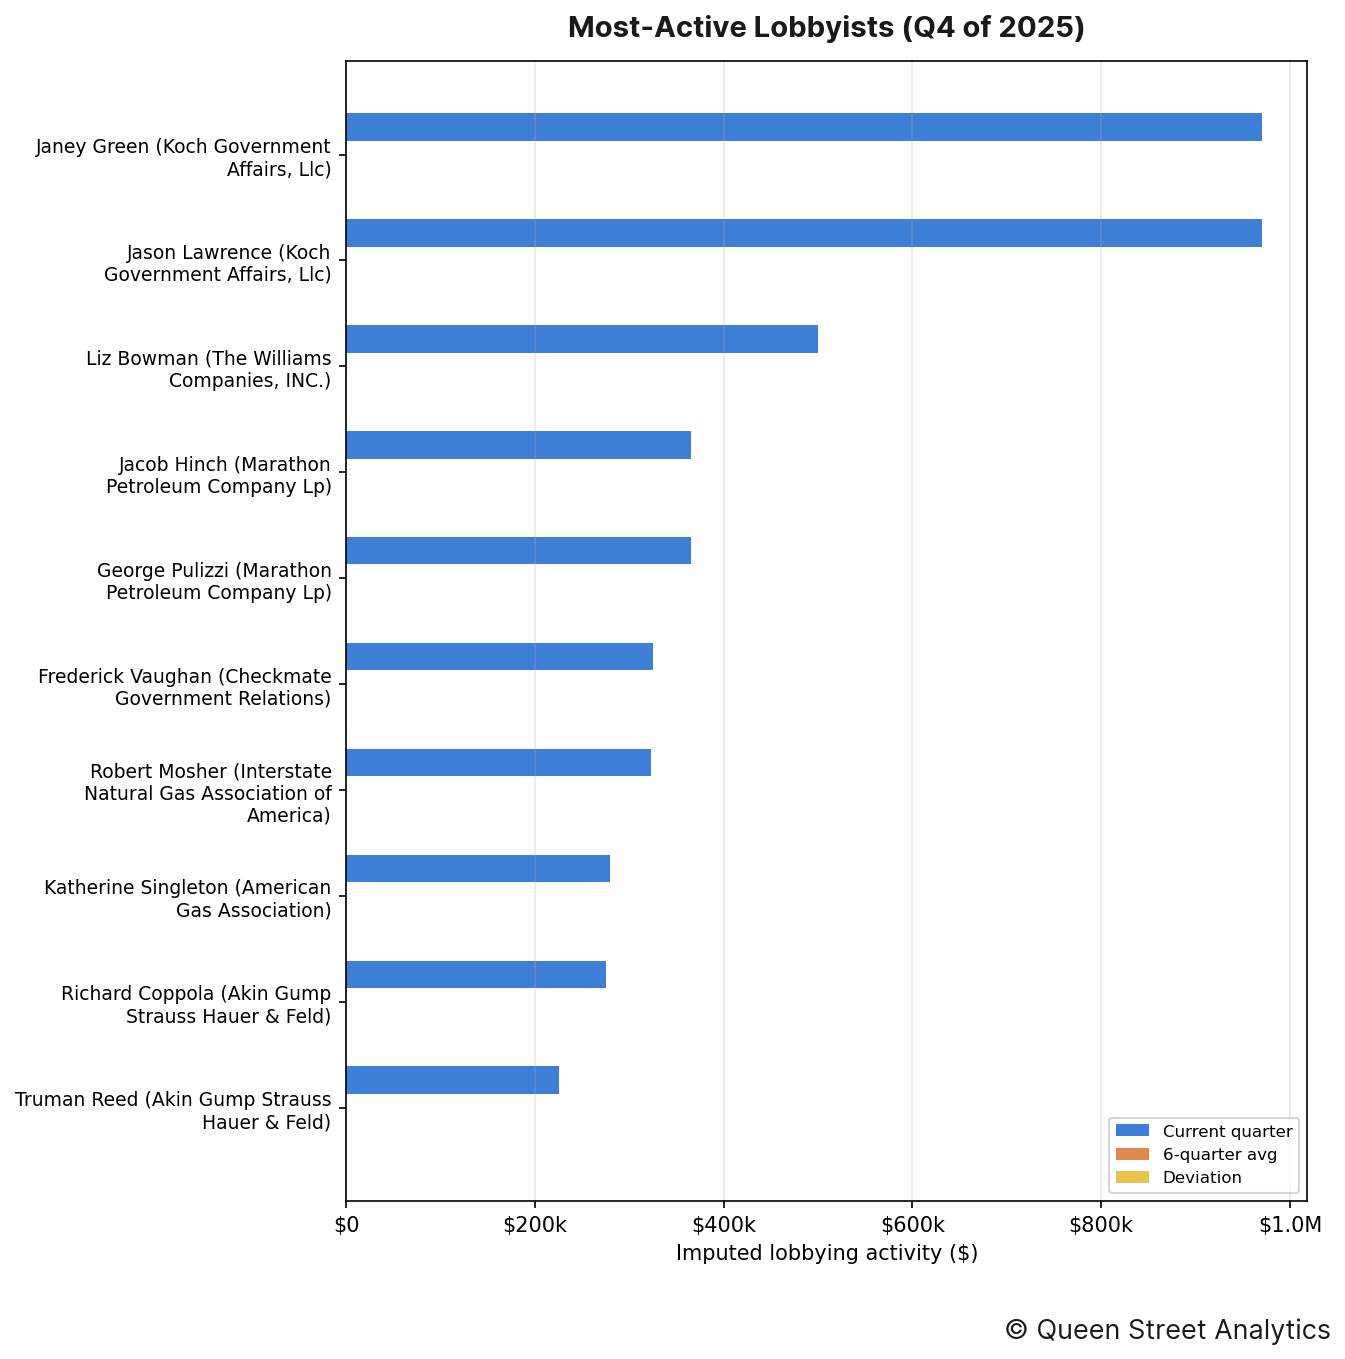
The lobbyists who managed the most imputed lobbying value this quarter were as follows:
↳ Janey Green (Koch Government Affairs, Llc) was credited with an imputed $970k in lobbying activity.
↳ Jason Lawrence (Koch Government Affairs, Llc) was credited with an imputed $970k in lobbying activity.
↳ Liz Bowman (The Williams Companies, INC) was credited with an imputed $500k in lobbying activity.
↳ Jacob Hinch (Marathon Petroleum Company Lp) was credited with an imputed $365k in lobbying activity.
↳ George Pulizzi (Marathon Petroleum Company Lp) was credited with an imputed $365k in lobbying activity.
Section G: Organization Network
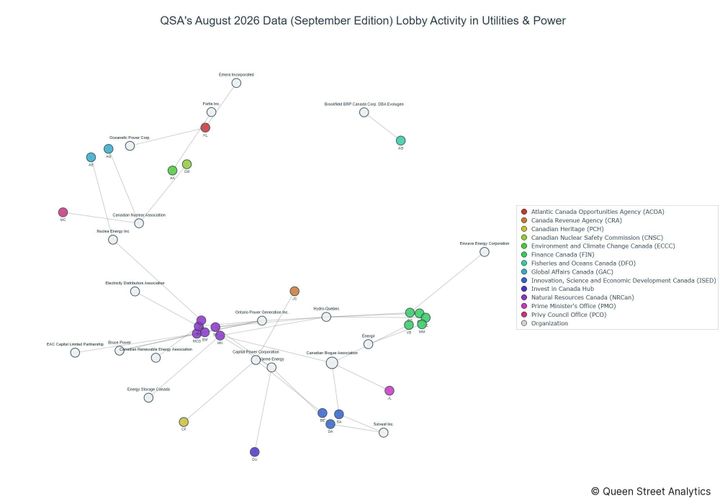
The header image for this edition maps how this channel's organizations (neutral nodes) connect to the federal entities they lobbied (colored nodes) this quarter. A link's weight is the filing value directed to that entity, and node size reflects total value; the House and Senate are excluded (nearly every organization lobbies them) so the specialized targets stand out.
The most widely lobbied entity this quarter was Dept of Energy, which was lobbied by 15 organizations.
Methodology
Every figure in this report starts from one number: the disclosed value of each lobbying filing, which we take as the income a registrant reported plus any in-house expenses (income + expenses) on its quarterly US Senate and House LDA disclosure. Before totalling anything we clean the filings — applying each amendment over the original it replaces, removing duplicates, and setting aside non-standard records such as registrations and terminations — and map every filing to a lobbying channel and industry using the organization's CRP industry code.
How the money is divided. A filing's full value counts once toward the organization that paid it and that organization's industry, so the industry and organization rankings (Sections A–C) reflect whole dollars. But a single filing usually names several government entities, several issue areas, and several lobbyists at once, and the disclosure never says how the fee was split among them. Rather than credit the full amount to each — which would count the same dollars over and over — we divide a filing's value evenly across the distinct items it names. So a $200,000 filing that lists four agencies contributes $50,000 to each in Section D, and the same even split is applied across issues in Section E and across lobbyists in Section F. That way every section's totals trace back to the same underlying money without double-counting.
Reading the movements. A “deviation” compares the quarter's value to the average of the prior six quarters, so a rise or fall is measured against an entity's own recent norm rather than against the rest of the field. Section B takes the wider view: it sums every industry into one channel total and plots it quarter by quarter, with a fitted line showing the overall direction of travel. Source: US Senate and House LDA disclosures.