USA Lobbying on Environment - Washington (Q1 2026)





Waste Connections Us INC, Veolia North America Llc, Republic Services, Los Angeles County Sanitation District, Tri-city Regional Sanitary District, and Sacramento Regional County Sanitation District were unusually active lobbyists this quarter.
View the interactive network in Queen Street Analytics →
Each quarter we track movements in US federal lobbying, channel by channel. This edition covers Environment for Q1 of 2026, ranking the organizations, government entities, issues, and lobbyists whose disclosed spend moved most.
Central Themes in this Quarter’s Lobby Data
Congress Advances Water Infrastructure Act Amid Record Lobbying
The Senate EPW Committee’s progression of the Water Resources Development Act (WRDA) of 2026 aligns with unprecedented lobbying for sewer, water, and wastewater system funding in early 2026, notably from Tri-city Regional Sanitary District engaging with the Senate, House of Representatives, and the Environmental Protection Agency (EPA), as well as Sacramento Regional County Sanitation District with both the House of Representatives and the Senate. Industry actors, including Los Angeles County Sanitation District and Key Largo Wastewater Treatment District, have targeted appropriations, reflecting efforts to shape how substantial federal investments and program reauthorizations will be implemented, and mirroring pressure from local leaders for robust water infrastructure adaptation under climate and demand stress.
📎 EPW Committee Passes Bipartisan Water Resources Development Act of 2026 · U.S. Water Infrastructure and Federal Policy in 2026: Rebuilding a ... · What Congress Needs to Advance on Water Infrastructure for America’s ...
PFAS Regulatory Uncertainty Spurs Lobbying Surge
Rapid developments on PFAS regulation, including EPA’s hazardous substance designations and new monitoring rules, are fueling lobbying from waste and water utilities such as Los Angeles County Sanitation District and Veolia North America, Llc, which have lobbied both the House of Representatives, Senate, and Environmental Protection Agency (EPA) regarding compliance liabilities. Congressional debates on shielding wastewater and landfill operators from PFAS-related liability—mirrored in lobbying filings from Waste Management, INC. and Republic Services—remain unresolved, prompting ongoing federal engagement by major industry players.
📎 Key EPA Actions to Address PFAS | US EPA · Ahead of 2026, Congress hears diverging calls for PFAS regulation · 2026 mid-year PFAS update: How federal and state regulation is shaping ...
EPA Regulatory Agenda Prompts Strategic Lobbying on Waste and Water
The EPA’s new regulatory agenda, which includes proposed rule changes for PFAS, NPDES permitting, and waste management, has triggered increased lobbying as sector stakeholders such as Waste Connections Us, INC. and Central Contra Costa Sanitary District seek to shape enforcement, reporting obligations, and funding access through engagement with the Environmental Protection Agency (EPA) and the House of Representatives. Several filings correspond to efforts to influence deregulatory actions and potential rollbacks of previous standards—a key concern for both utilities and private waste businesses like Waste Control Specialists Llc.
📎 EPA Outlines Deregulatory Agenda Covering PFAS, Waste, Water, and · Important 2026 Water Law and Policy Developments · US Environmental Law & Policy: 2026 Status Updates
Industry Renews Push for Recycling Funding and Permitting Reform
Aggressive advocacy from waste and recycling companies such as Republic Services and Recology INC. is targeting Congress, the Environmental Protection Agency (EPA), and the Senate for recycling system modernization, permitting clarity, and opposition to certain producer responsibility measures. Legislative priorities have included appropriations for recycling, plastics management, and the mitigation of risks from hazardous materials, with lobbying efforts closely paralleling policymakers’ ongoing focus on infrastructure and circular economy reforms in 2026.
📎 2026 Legislative priorities: Strengthening America’s waste & recycling ... · Important 2026 Water Law and Policy Developments

Section A: Lobbying Spend by Industry
How much each industry in this channel spent on federal lobbying in Q1 of 2026, compared with its average over the prior six quarters.
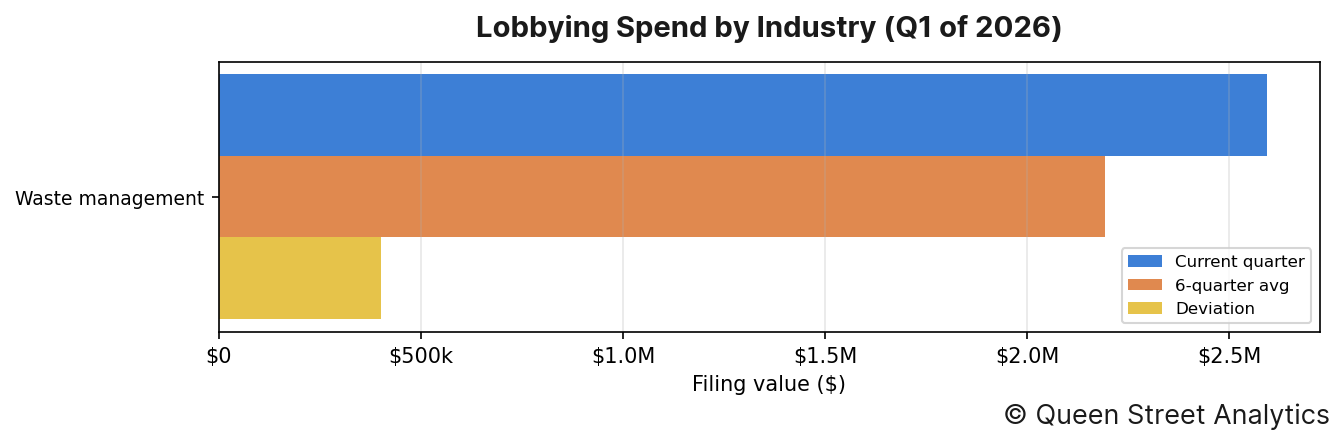
In Q1 of 2026, there was $2.6M worth of disclosed lobbying activity on Environment, 18% higher than the recent quarterly average of $2.2M. This activity can be broken down by industry as follows:
↳ There was $2.6M worth of Waste management lobbying, 18% higher than the recent quarterly average of $2.2M.
Section B: Lobbying Spend Trend
This channel's total disclosed lobbying spend across recent quarters, aggregated over all of its industries.
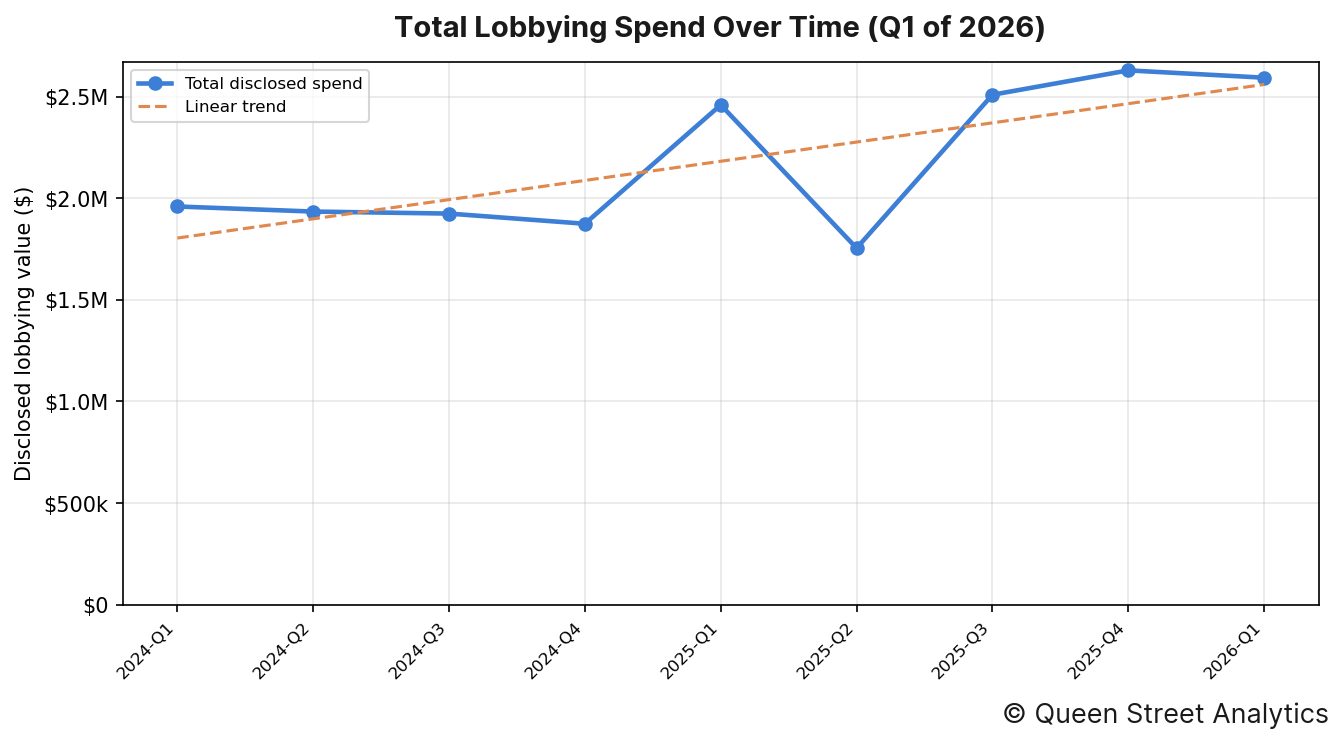
In Q1 of 2026, there was $2.6M worth of disclosed lobbying activity on Environment. Across the 9 quarters shown, the channel's total disclosed spend has risen over this period.
Organizations' Lobby Spend
The image below shows the organizations whose lobbying spend moved most from their six-quarter average.
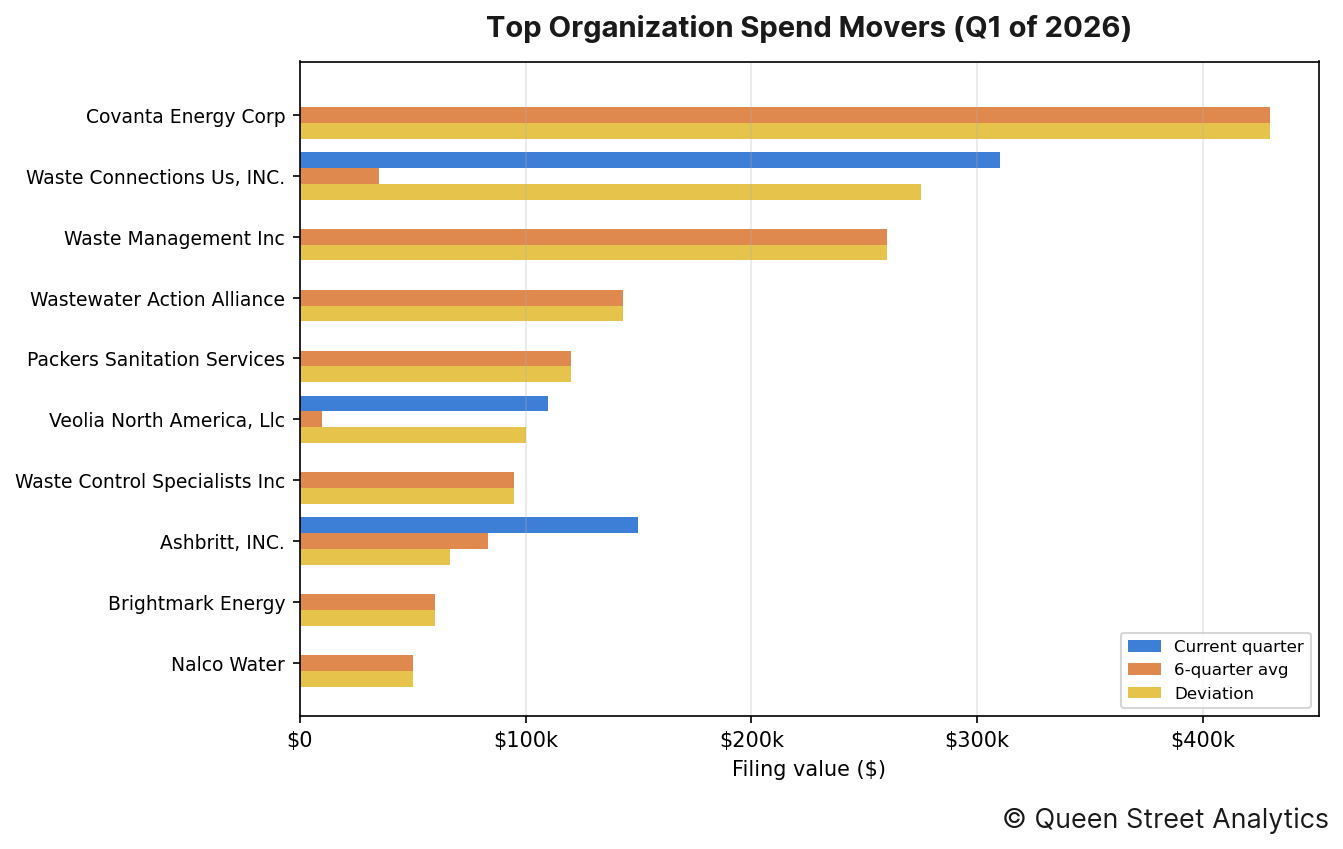
The organizations whose spending moved most from their own recent quarterly average were as follows:
↳ Covanta Energy Corp accounted for $0 in disclosed lobbying, 100% lower than the recent quarterly average of $430k.
↳ Waste Connections Us, INC. accounted for $310k in disclosed lobbying, 786% higher than the recent quarterly average of $35k.
↳ Waste Management Inc accounted for $0 in disclosed lobbying, 100% lower than the recent quarterly average of $260k.
↳ Wastewater Action Alliance accounted for $0 in disclosed lobbying, 100% lower than the recent quarterly average of $143k.
↳ Packers Sanitation Services accounted for $0 in disclosed lobbying, 100% lower than the recent quarterly average of $120k.
↳ Veolia North America, Llc accounted for $110k in disclosed lobbying, 1000% higher than the recent quarterly average of $10k.
Section D: Government Entities Lobbied
This section documents this quarter's most lobbied federal government departments.
By industry
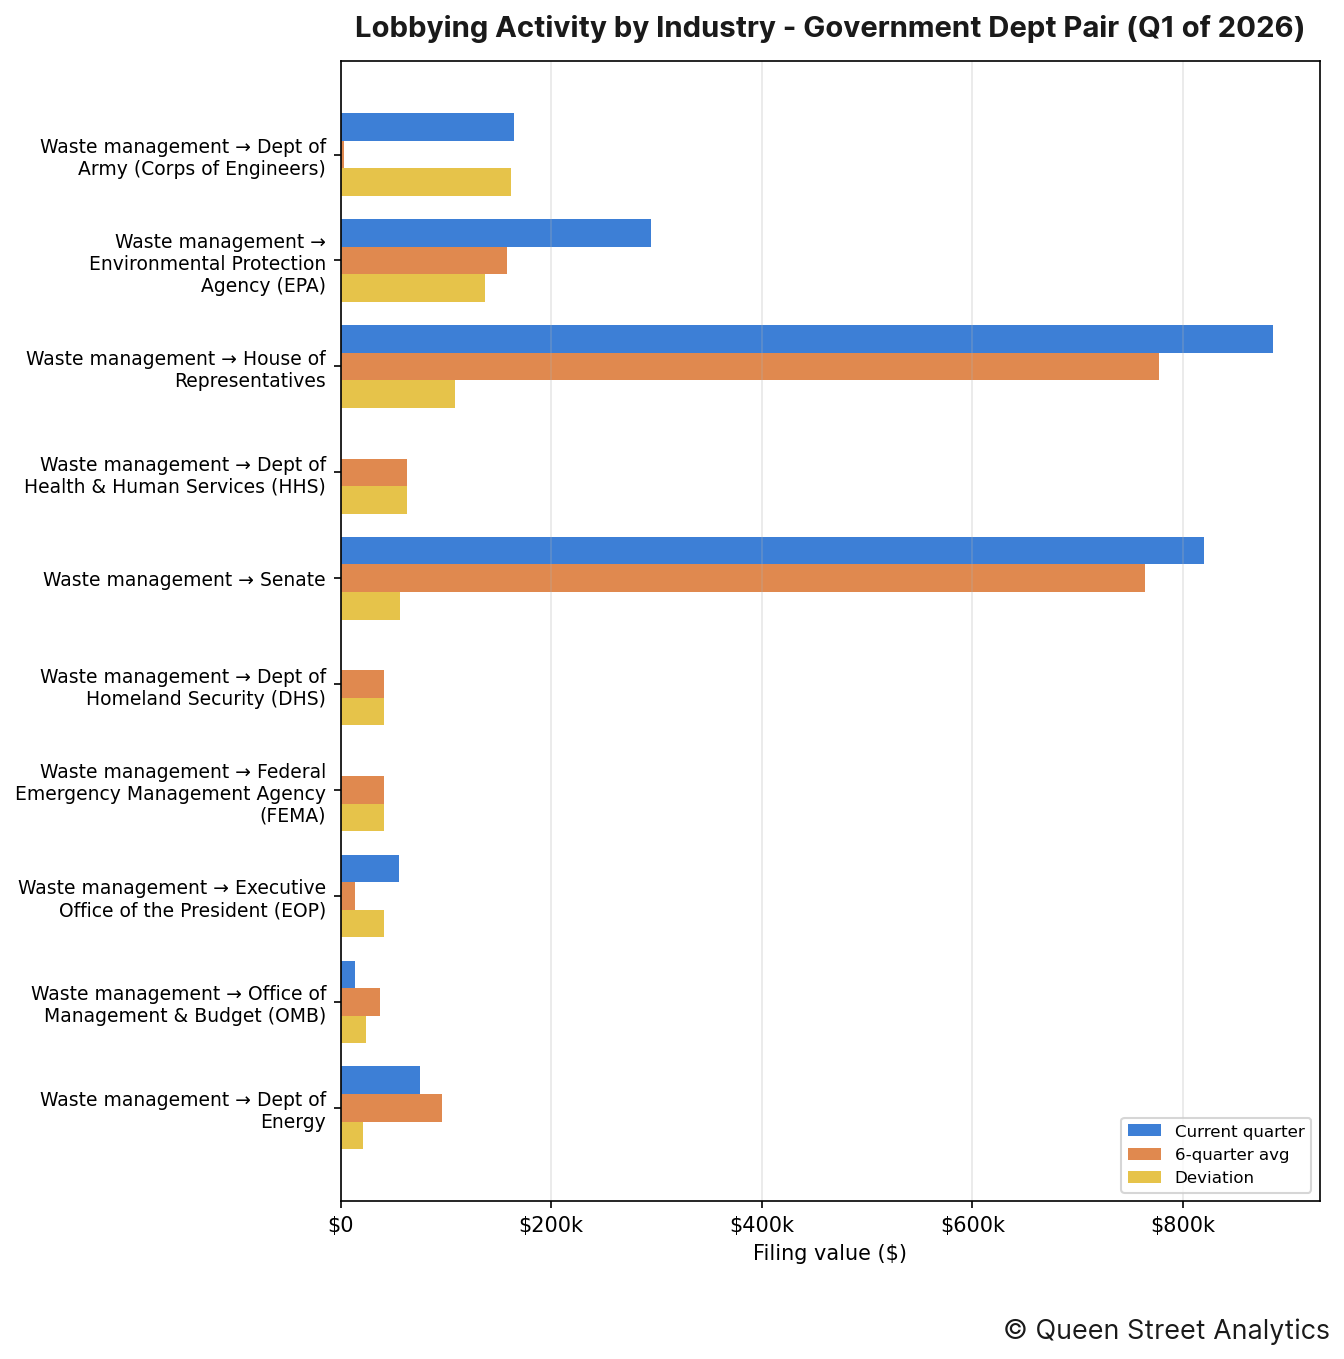
The industry–entity pairings that moved most this quarter were as follows:
↳ Waste management directed $165k of lobbying toward Dept of Army (Corps of Engineers), 4850% higher than the recent quarterly average of $3k.
↳ Waste management directed $295k of lobbying toward Environmental Protection Agency (EPA), 87% higher than the recent quarterly average of $158k.
↳ Waste management directed $885k of lobbying toward House of Representatives, 14% higher than the recent quarterly average of $777k.
By organization
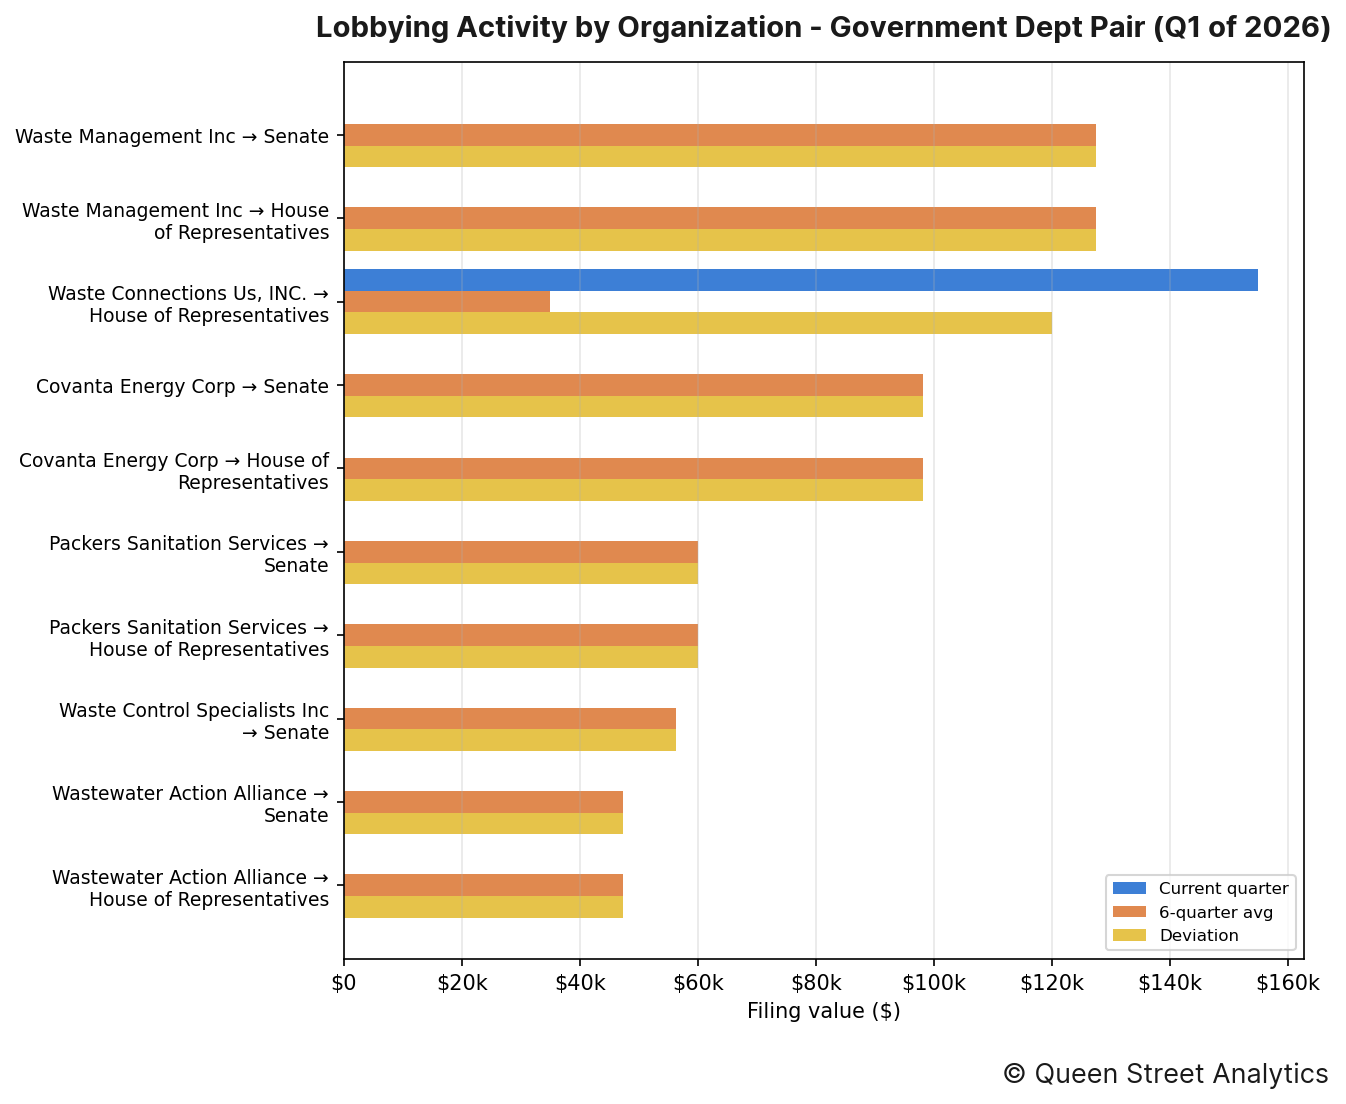
The organization–entity pairings that moved most this quarter were as follows:
↳ Waste Management Inc directed $0 of lobbying toward Senate, 100% lower than the recent quarterly average of $128k.
↳ Waste Management Inc directed $0 of lobbying toward House of Representatives, 100% lower than the recent quarterly average of $128k.
↳ Waste Connections Us, INC. directed $155k of lobbying toward House of Representatives, 343% higher than the recent quarterly average of $35k.
Section E: Lobbying Issues
This section documents this quarter's most lobbied-on issues.
By industry
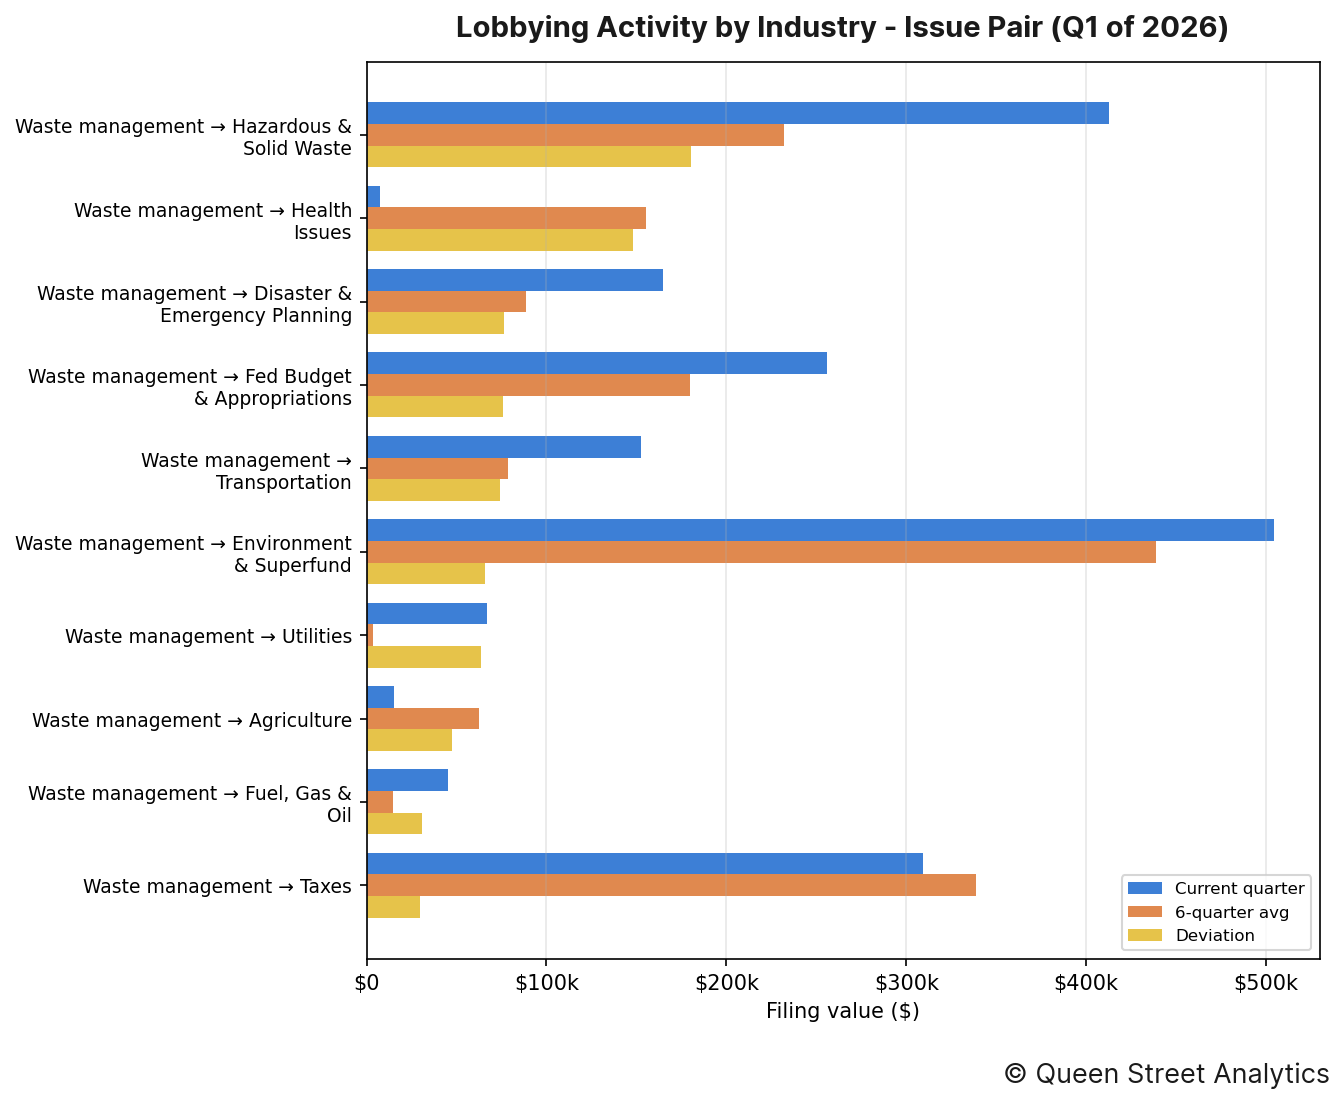
The industry–issue pairings that moved most this quarter were as follows:
↳ Waste management put $413k toward lobbying on Hazardous & Solid Waste, 78% higher than the recent quarterly average of $232k.
↳ Waste management put $8k toward lobbying on Health Issues, 95% lower than the recent quarterly average of $155k.
↳ Waste management put $165k toward lobbying on Disaster & Emergency Planning, 86% higher than the recent quarterly average of $89k.
By organization
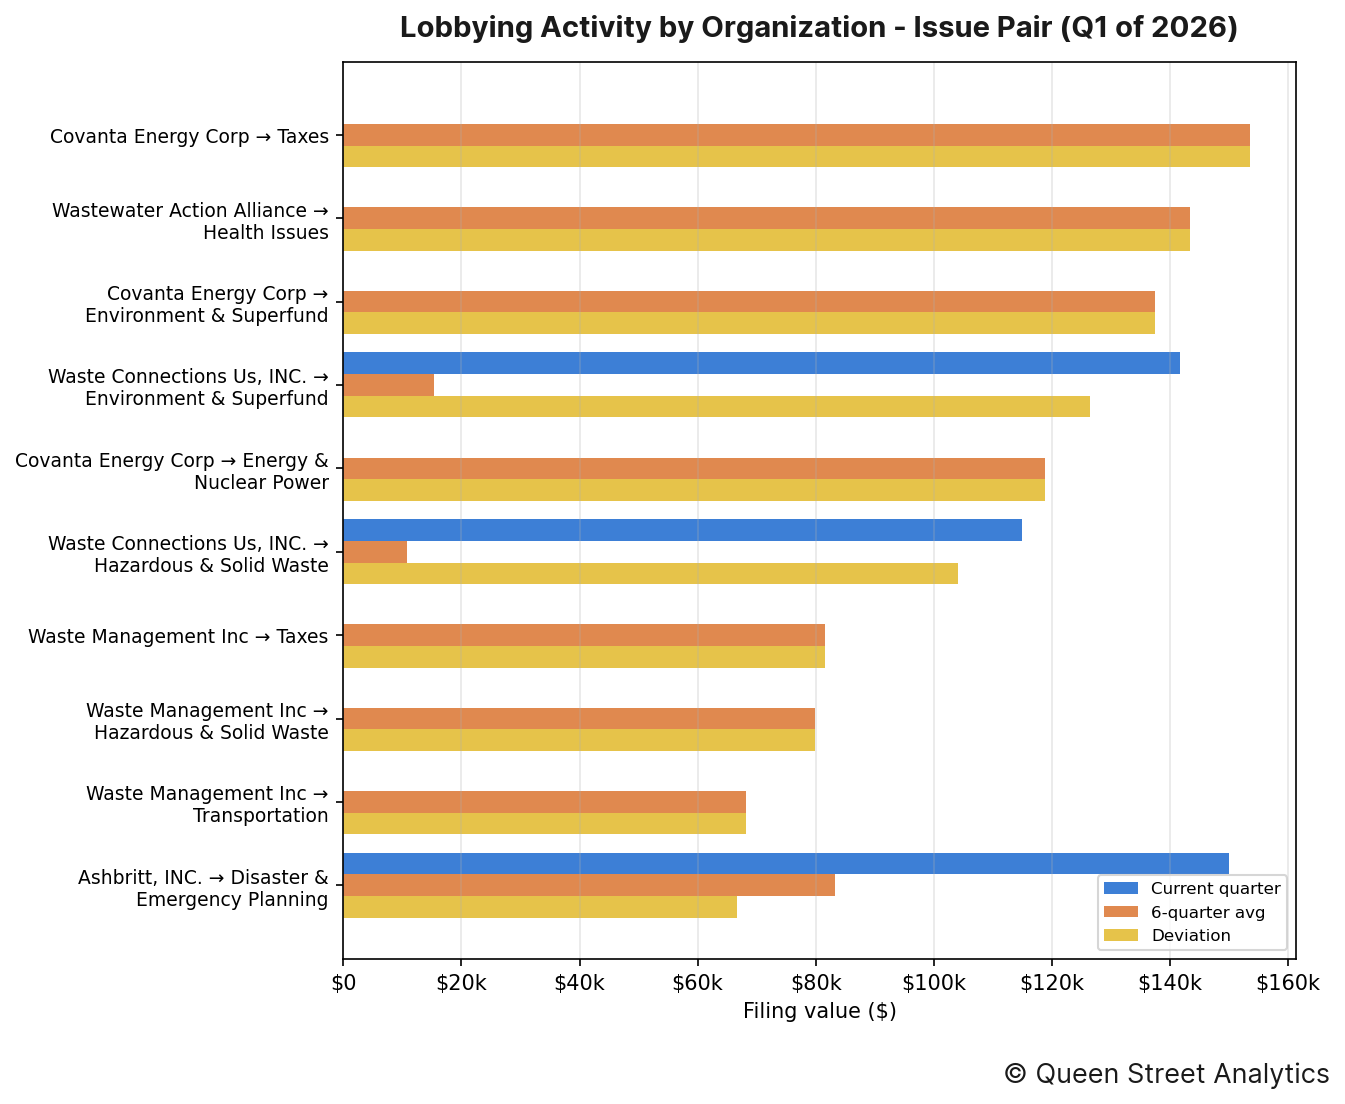
The organization–issue pairings that moved most this quarter were as follows:
↳ Covanta Energy Corp put $0 toward lobbying on Taxes, 100% lower than the recent quarterly average of $154k.
↳ Wastewater Action Alliance put $0 toward lobbying on Health Issues, 100% lower than the recent quarterly average of $143k.
↳ Covanta Energy Corp put $0 toward lobbying on Environment & Superfund, 100% lower than the recent quarterly average of $138k.
Section F: Most-Active Lobbyists
The figure below lists the lobbyists who managed the most imputed lobbying value this quarter, alongside their firm or organization. Because a filing's value is split evenly across the lobbyists it names, these dollar figures are imputed rather than directly disclosed.
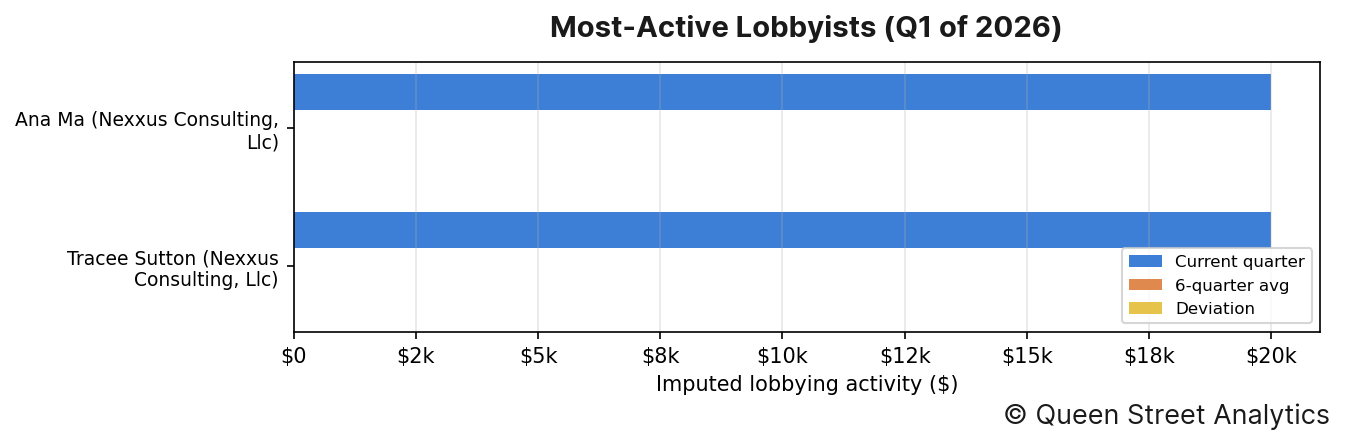
The lobbyists who managed the most imputed lobbying value this quarter were as follows:
↳ Ana Ma (Nexxus Consulting, Llc) was credited with an imputed $20k in lobbying activity.
↳ Tracee Sutton (Nexxus Consulting, Llc) was credited with an imputed $20k in lobbying activity.
Section G: Organization Network
The header image for this edition maps how this channel's organizations (neutral nodes) connect to the federal entities they lobbied (colored nodes) this quarter. A link's weight is the filing value directed to that entity, and node size reflects total value; the House and Senate are excluded (nearly every organization lobbies them) so the specialized targets stand out.
The most widely lobbied entity this quarter was Environmental Protection Agency (EPA), which was lobbied by 10 organizations.
Methodology
Every figure in this report starts from one number: the disclosed value of each lobbying filing, which we take as the income a registrant reported plus any in-house expenses (income + expenses) on its quarterly US Senate and House LDA disclosure. Before totalling anything we clean the filings — applying each amendment over the original it replaces, removing duplicates, and setting aside non-standard records such as registrations and terminations — and map every filing to a lobbying channel and industry using the organization's CRP industry code.
How the money is divided. A filing's full value counts once toward the organization that paid it and that organization's industry, so the industry and organization rankings (Sections A–C) reflect whole dollars. But a single filing usually names several government entities, several issue areas, and several lobbyists at once, and the disclosure never says how the fee was split among them. Rather than credit the full amount to each — which would count the same dollars over and over — we divide a filing's value evenly across the distinct items it names. So a $200,000 filing that lists four agencies contributes $50,000 to each in Section D, and the same even split is applied across issues in Section E and across lobbyists in Section F. That way every section's totals trace back to the same underlying money without double-counting.
Reading the movements. A “deviation” compares the quarter's value to the average of the prior six quarters, so a rise or fall is measured against an entity's own recent norm rather than against the rest of the field. Section B takes the wider view: it sums every industry into one channel total and plots it quarter by quarter, with a fitted line showing the overall direction of travel. Source: US Senate and House LDA disclosures.