USA Lobbying on Finance & Insurance - Washington (Q1 2026)





National Association of Realtors, American Bankers Association, Aflac Incorporated, Mastercard Worldwide, America's Health Insurance Plans were unusually active lobbyists this quarter.
View the interactive network in Queen Street Analytics →
Each quarter we track movements in US federal lobbying, channel by channel. This edition covers Finance & Insurance for Q1 of 2026, ranking the organizations, government entities, issues, and lobbyists whose disclosed spend moved most.
Central Themes in this Quarter’s Lobby Data
ACA Subsidy Extension Spurs Insurance Lobby Spending
Insurers including America's Health Insurance Plans Inc (Ahip) and the American Council of Life Insurers elevated their advocacy as federal lawmakers, such as those in the House of Representatives and the Senate, debated renewal of enhanced Affordable Care Act (ACA) subsidies set to expire in 2026. Filings show direct focus on ACA premium tax credit extensions, with sector stakeholders targeting both reconciliation legislation and tax title enhancements. These spikes plausibly coincide with heightened anxieties over health access and affordability, as confirmed by multiple sector and legal overviews.
📎 2026 Legislative and Regulatory Outlook | Insights | Holland & Knight · 4 “Big, Beautiful Bill” changes that will reshape care in 2026
Surge in Realtor and Real Estate Lobbying Amid Housing, Flood Insurance Legislation
Real estate groups, particularly the National Association of Realtors and the Community Bankers Association of Illinois, responded to major Congressional action on federal housing relief and flood insurance, including lobbying activity directed toward the House of Representatives and the Senate. Lobbying disclosures cited engagement with the Road to Housing and Choice in Affordable Housing Acts, plus sustained attention to flood insurance program reauthorization. These efforts align with new bills, appropriations debates, and competitive housing policy shifts documented in multiple legal and public sector updates.
📎 Farm Bill 2026: Overview – National Agricultural Law Center · New U.S. Laws in 2026: What Every Citizen Needs to Know · Appropriations Watch: FY 2026-2026-06-11 - crfb.org
Crypto and Banking Lobbying Rises with Stablecoin Regulation Implementation
A marked uptick in advocacy by crypto firms and banks, including the Community Bankers Association of Illinois lobbying the Federal Deposit Insurance Corporation (FDIC) and the Federal Reserve System, coincided with the rollout of stablecoin-related regulations following the GENIUS Act’s implementation phase. Filings emphasized pending FDIC, OCC, and Federal Reserve rules covering payments and digital asset interfaces, and sector groups like the Community Bankers Association of Illinois reportedly intensified efforts to shape timelines and final regulatory standards. Multiple industry legal alerts corroborate the active regulatory and lobbying environment for digital payments and stablecoins.
📎 2026 and Fundamental Changes to the U.S. Payments System · Regulatory Agendas: FRB, FDIC, OCC, CFPB, SEC, CFTC, and FinCEN
Mortgage Industry Intensifies Lobbying During Regulatory Overhaul
A sharp escalation in mortgage-related lobbying, including stepped-up efforts by the Credit Union National Association, INC. Dba America's Credit Unions, paralleled sweeping executive orders and rulemakings targeting disclosure, repayment standards, and civil penalties within the sector. Realtors and top lenders, alongside lobbyists engaging the Consumer Financial Protection Bureau (CFPB) and the Federal Housing Finance Agency (FHFA), notably increased activity on proposals related to mortgage access, servicing reforms, and compliance cost reduction. Independent updates and regulatory analyses validate a period of intense regulatory flux motivating sector participation.
📎 April 2026 Regulatory Update: Mortgage Overhaul & Examiner Findings · Consumer Financial Protection Bureau Releases Regulatory Agenda
Farm Bill Movement Fuels Rural Finance and Bank Sector Lobbying
Heightened bank and lending industry advocacy, including efforts by the Community Bankers Association of Illinois with the House of Representatives and Credit Union National Association, INC. Dba America's Credit Unions with the Consumer Financial Protection Bureau, tracked with legislative progress on the 2026 Farm Bill and associated appropriations. Filings referenced rural finance, agricultural export guarantees, and credit extension, reflecting the bill’s broad impact on rural development and insurance programs. Sector engagement was corroborated by timely legal analyses and appropriations coverage.
📎 Farm Bill 2026: Overview – National Agricultural Law Center · Appropriations Watch: FY 2026-2026-06-11 - crfb.org

Section A: Lobbying Spend by Industry
How much each industry in this channel spent on federal lobbying in Q1 of 2026, compared with its average over the prior six quarters.
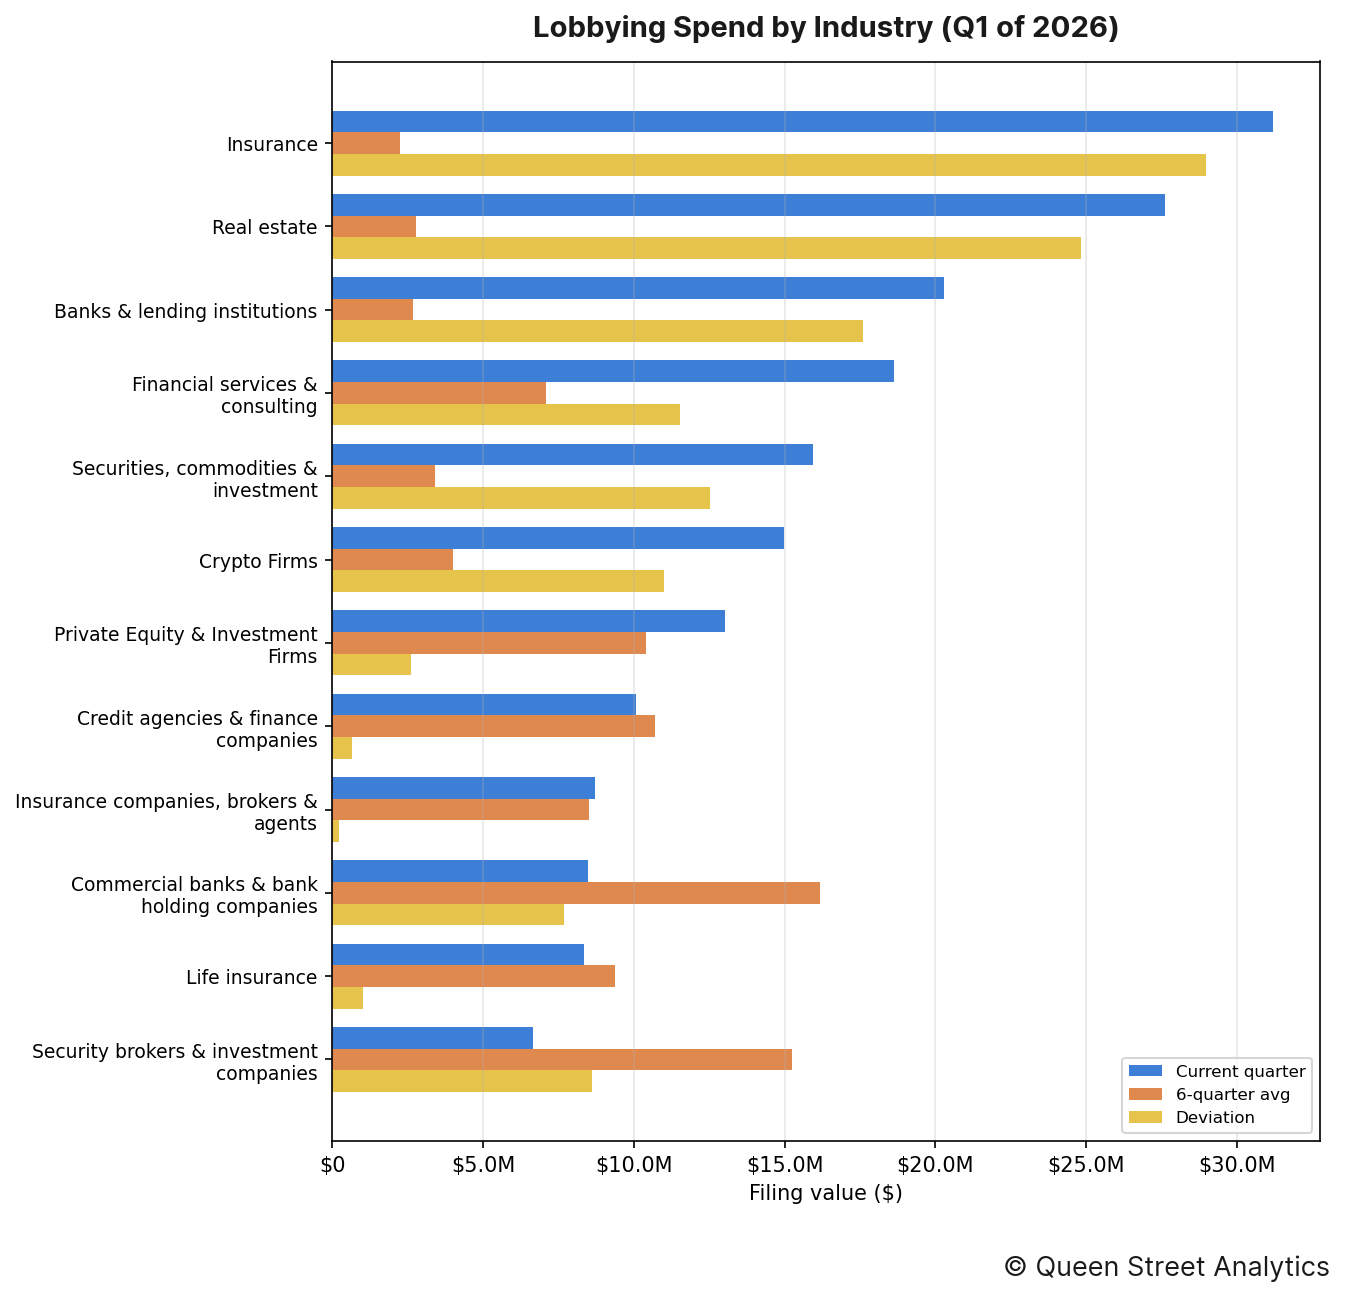
In Q1 of 2026, there was $222.3M worth of disclosed lobbying activity on Finance & Insurance, 23% higher than the recent quarterly average of $180.2M. This activity can be broken down by industry as follows:
↳ There was $31.2M worth of Insurance lobbying, 1291% higher than the recent quarterly average of $2.2M.
↳ There was $27.6M worth of Real estate lobbying, 894% higher than the recent quarterly average of $2.8M.
↳ There was $20.3M worth of Banks & lending institutions lobbying, 657% higher than the recent quarterly average of $2.7M.
↳ There was $18.6M worth of Financial services & consulting lobbying, 162% higher than the recent quarterly average of $7.1M.
↳ There was $15.9M worth of Securities, commodities & investment lobbying, 367% higher than the recent quarterly average of $3.4M.
↳ There was $15.0M worth of Crypto Firms lobbying, 276% higher than the recent quarterly average of $4.0M.
Section B: Lobbying Spend Trend
This channel's total disclosed lobbying spend across recent quarters, aggregated over all of its industries.
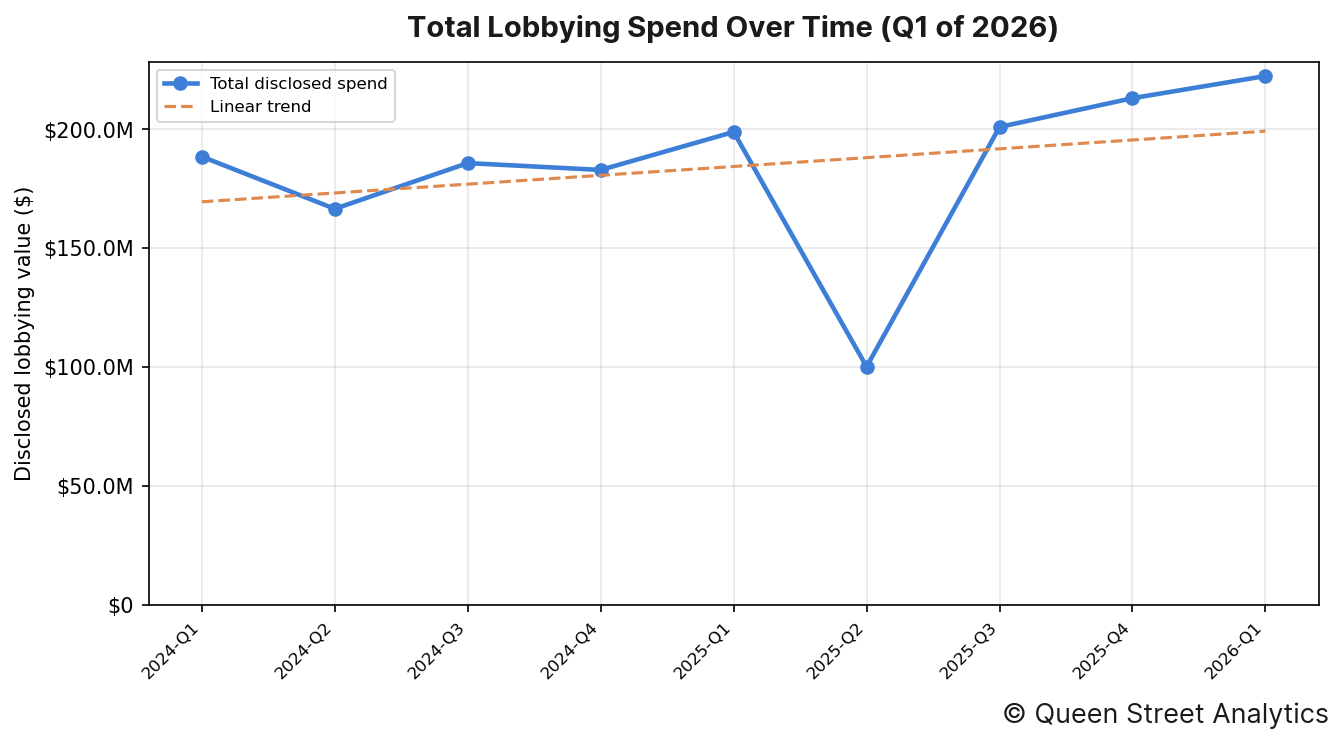
In Q1 of 2026, there was $222.3M worth of disclosed lobbying activity on Finance & Insurance. Across the 9 quarters shown, the channel's total disclosed spend has risen over this period.
Organizations' Lobby Spend
The image below shows the organizations whose lobbying spend moved most from their six-quarter average.
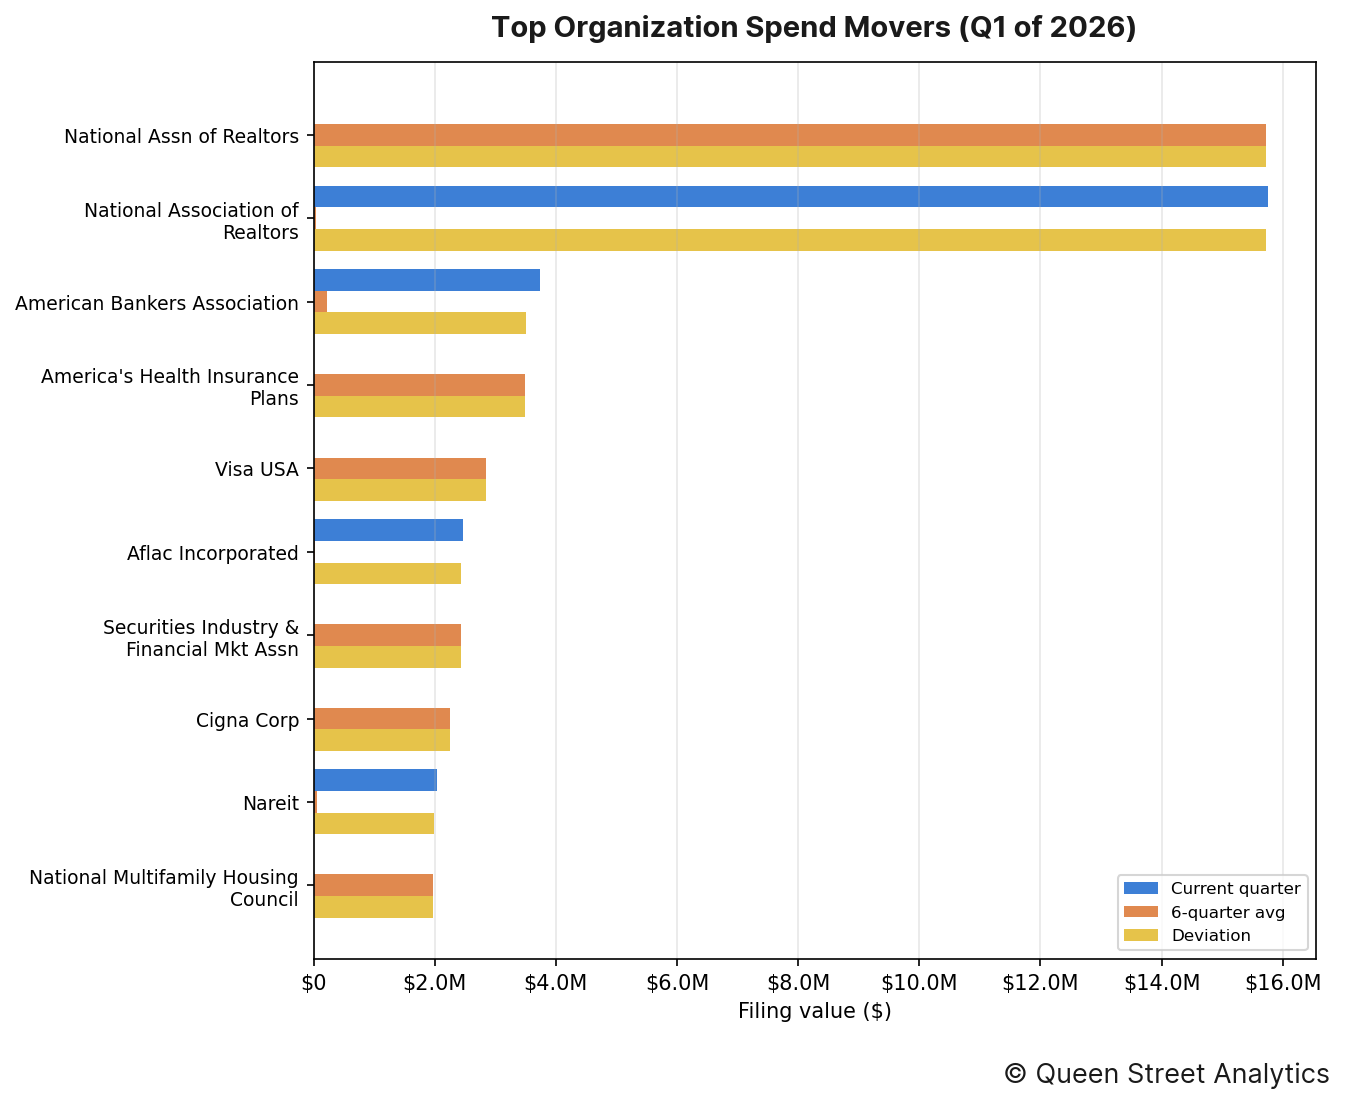
The organizations whose spending moved most from their own recent quarterly average were as follows:
↳ National Assn of Realtors accounted for $0 in disclosed lobbying, 100% lower than the recent quarterly average of $15.7M.
↳ National Association of Realtors accounted for $15.8M in disclosed lobbying, 37724% higher than the recent quarterly average of $42k.
↳ American Bankers Association accounted for $3.7M in disclosed lobbying, 1560% higher than the recent quarterly average of $225k.
↳ America's Health Insurance Plans accounted for $0 in disclosed lobbying, 100% lower than the recent quarterly average of $3.5M.
↳ Visa USA accounted for $0 in disclosed lobbying, 100% lower than the recent quarterly average of $2.9M.
↳ Aflac Incorporated accounted for $2.5M in disclosed lobbying, 12200% higher than the recent quarterly average of $20k.
Section D: Government Entities Lobbied
This section documents this quarter's most lobbied federal government departments.
By industry
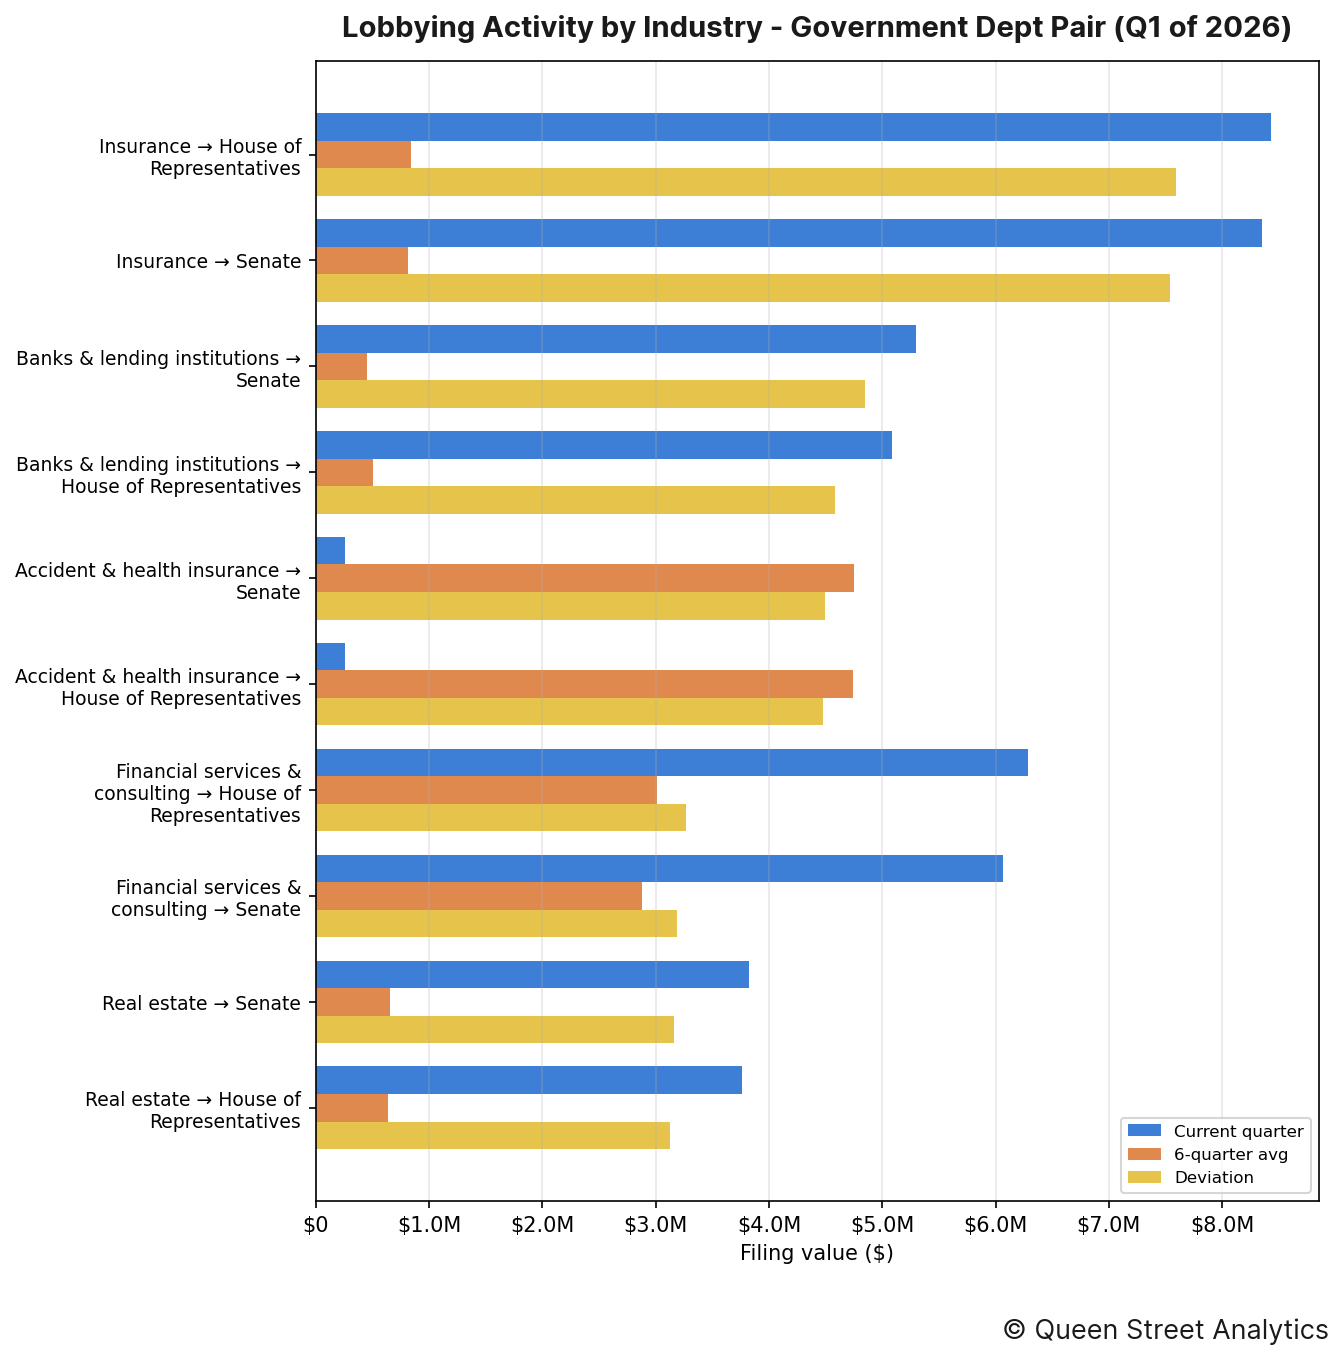
The industry–entity pairings that moved most this quarter were as follows:
↳ Insurance directed $8.4M of lobbying toward House of Representatives, 908% higher than the recent quarterly average of $837k.
↳ Insurance directed $8.3M of lobbying toward Senate, 930% higher than the recent quarterly average of $810k.
↳ Banks & lending institutions directed $5.3M of lobbying toward Senate, 1067% higher than the recent quarterly average of $454k.
By organization
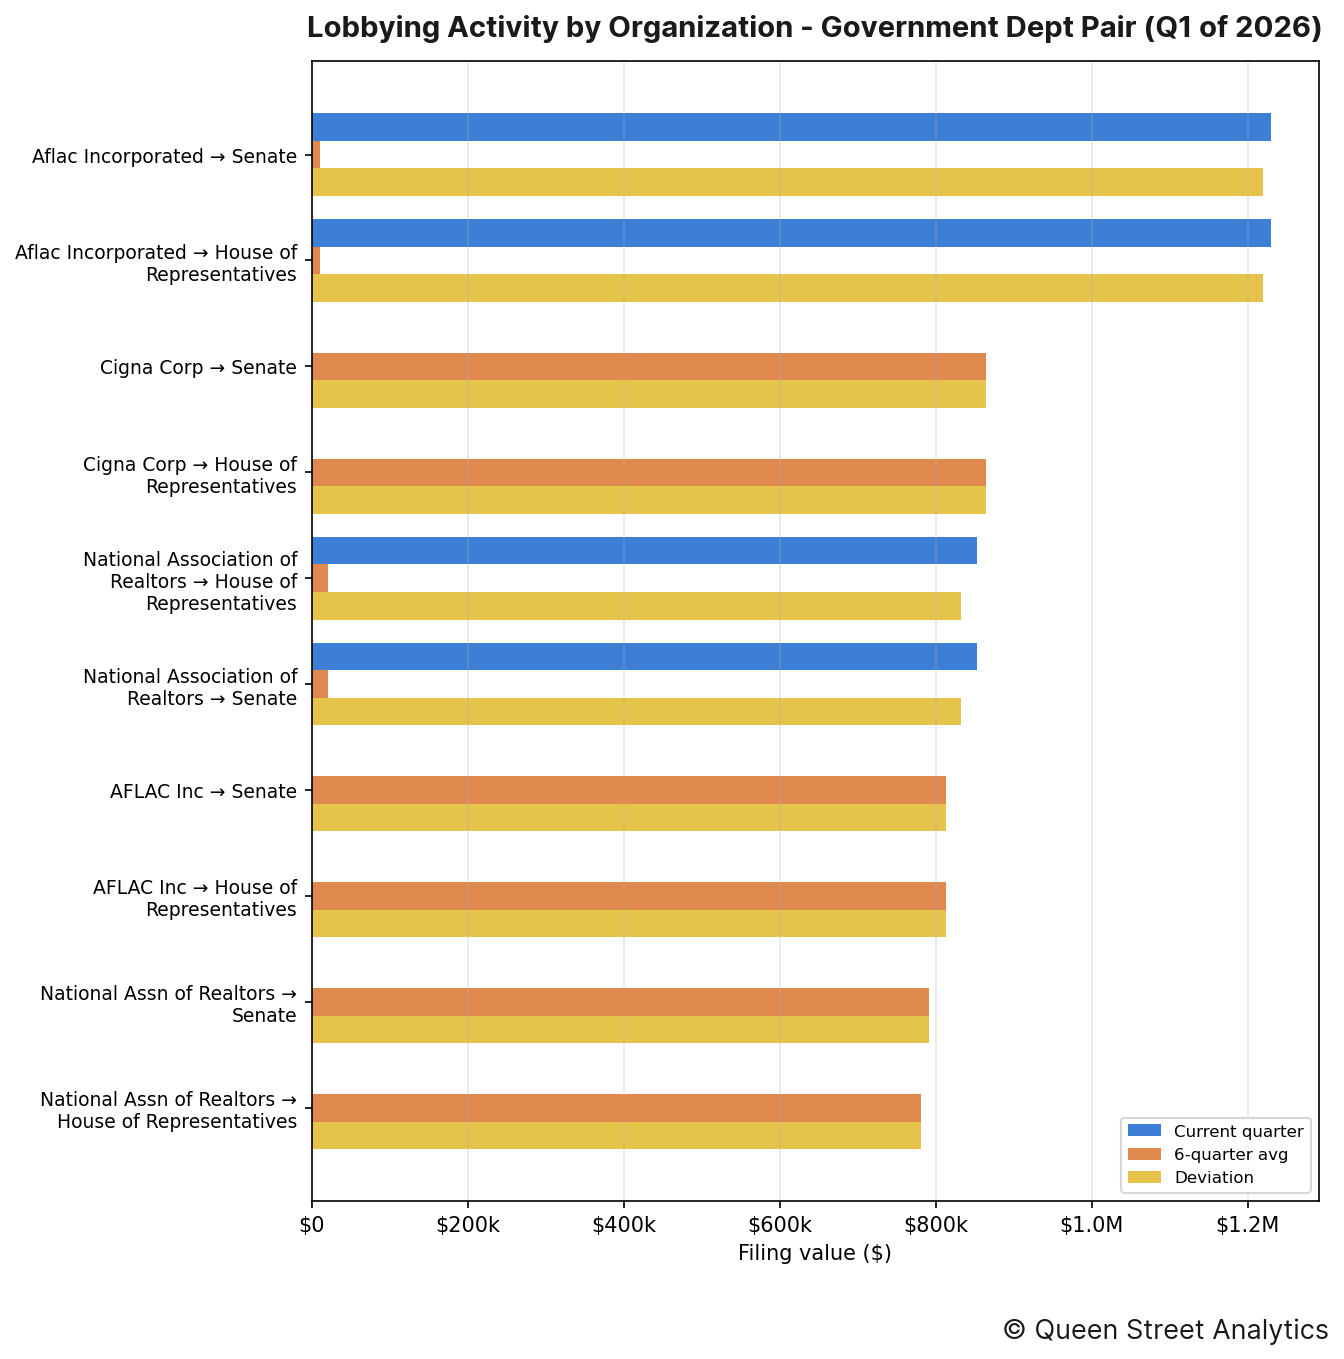
The organization–entity pairings that moved most this quarter were as follows:
↳ Aflac Incorporated directed $1.2M of lobbying toward Senate, 12200% higher than the recent quarterly average of $10k.
↳ Aflac Incorporated directed $1.2M of lobbying toward House of Representatives, 12200% higher than the recent quarterly average of $10k.
↳ Cigna Corp directed $0 of lobbying toward Senate, 100% lower than the recent quarterly average of $865k.
Section E: Lobbying Issues
This section documents this quarter's most lobbied-on issues.
By industry
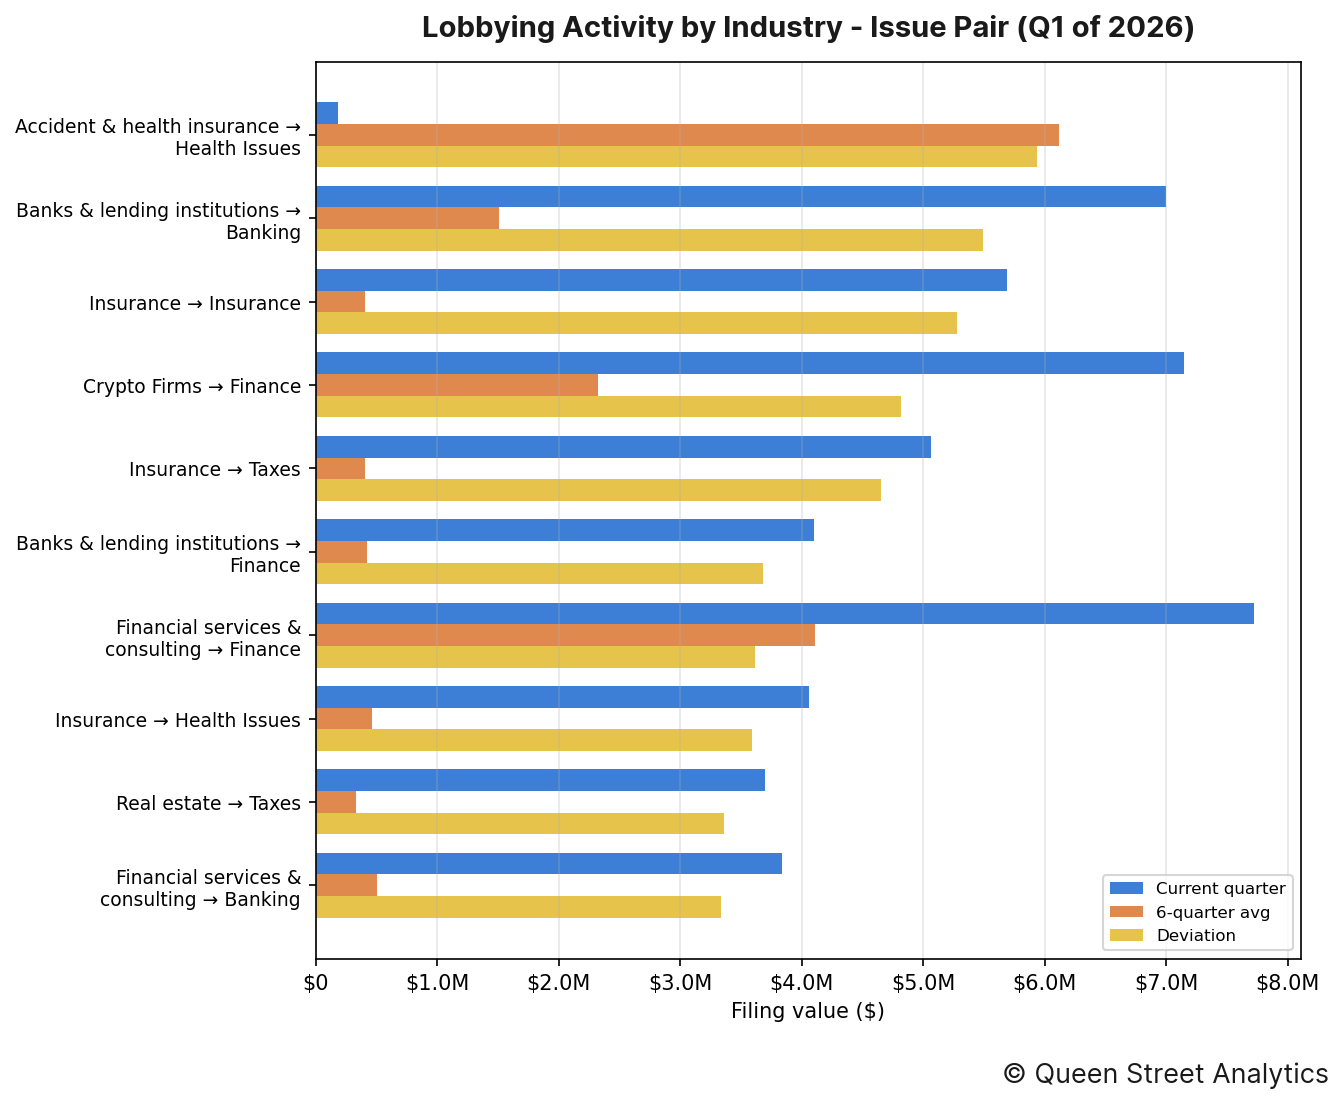
The industry–issue pairings that moved most this quarter were as follows:
↳ Accident & health insurance put $180k toward lobbying on Health Issues, 97% lower than the recent quarterly average of $6.1M.
↳ Banks & lending institutions put $7.0M toward lobbying on Banking, 365% higher than the recent quarterly average of $1.5M.
↳ Insurance put $5.7M toward lobbying on Insurance, 1293% higher than the recent quarterly average of $408k.
By organization
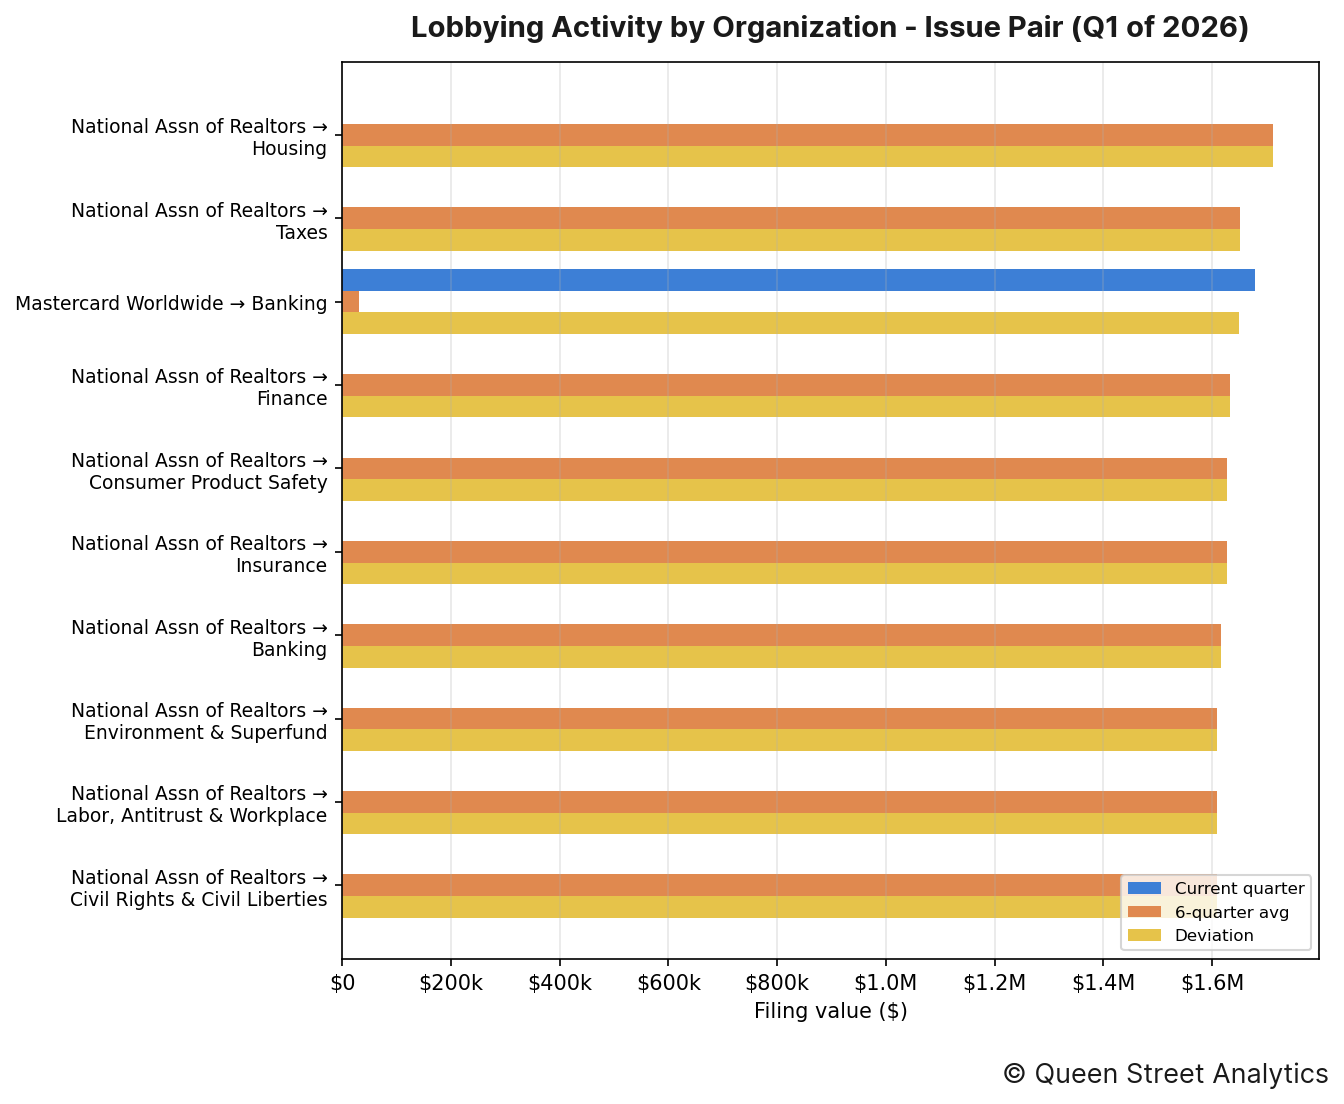
The organization–issue pairings that moved most this quarter were as follows:
↳ National Assn of Realtors put $0 toward lobbying on Housing, 100% lower than the recent quarterly average of $1.7M.
↳ National Assn of Realtors put $0 toward lobbying on Taxes, 100% lower than the recent quarterly average of $1.7M.
↳ Mastercard Worldwide put $1.7M toward lobbying on Banking, 5500% higher than the recent quarterly average of $30k.
Section F: Most-Active Lobbyists
The figure below lists the lobbyists who managed the most imputed lobbying value this quarter, alongside their firm or organization. Because a filing's value is split evenly across the lobbyists it names, these dollar figures are imputed rather than directly disclosed.
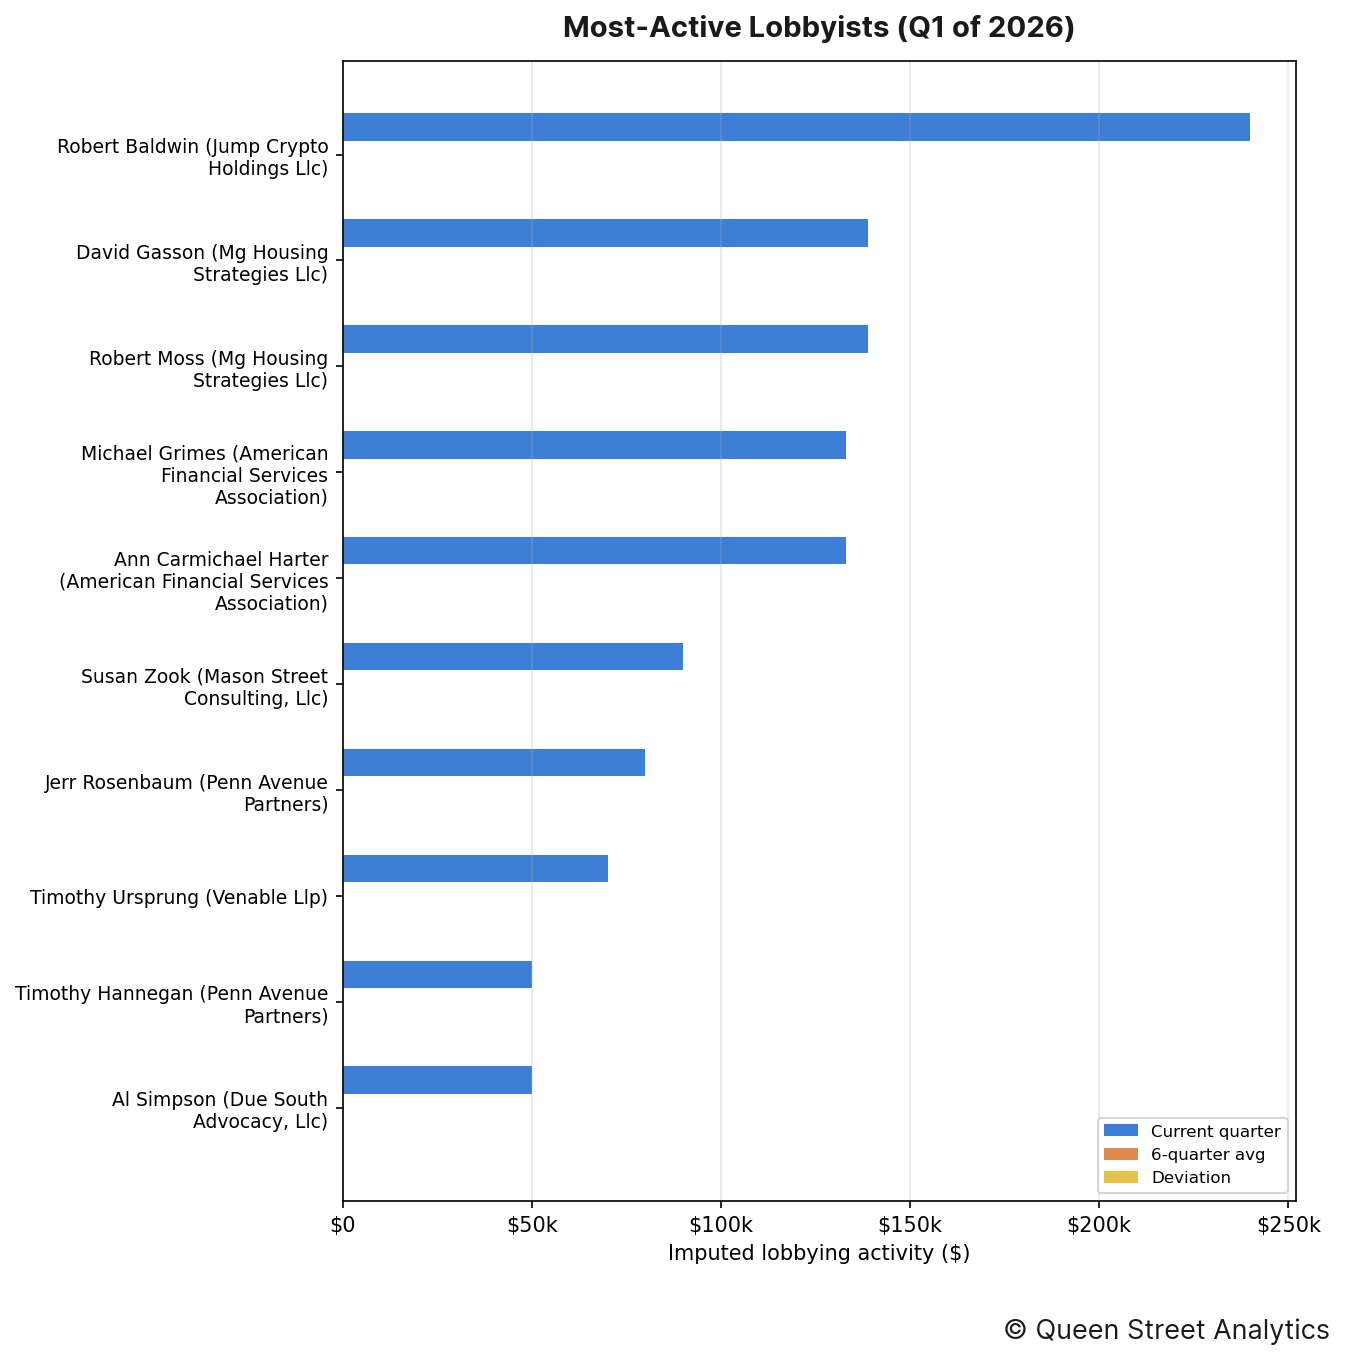
The lobbyists who managed the most imputed lobbying value this quarter were as follows:
↳ Robert Baldwin (Jump Crypto Holdings Llc) was credited with an imputed $240k in lobbying activity.
↳ David Gasson (Mg Housing Strategies Llc) was credited with an imputed $139k in lobbying activity.
↳ Robert Moss (Mg Housing Strategies Llc) was credited with an imputed $139k in lobbying activity.
↳ Michael Grimes (American Financial Services Association) was credited with an imputed $133k in lobbying activity.
↳ Ann Carmichael Harter (American Financial Services Association) was credited with an imputed $133k in lobbying activity.
Section G: Organization Network
The header image for this edition maps how this channel's organizations (neutral nodes) connect to the federal entities they lobbied (colored nodes) this quarter. A link's weight is the filing value directed to that entity, and node size reflects total value; the House and Senate are excluded (nearly every organization lobbies them) so the specialized targets stand out.
The most widely lobbied entity this quarter was Dept of Treasury, which was lobbied by 18 organizations.
Methodology
Every figure in this report starts from one number: the disclosed value of each lobbying filing, which we take as the income a registrant reported plus any in-house expenses (income + expenses) on its quarterly US Senate and House LDA disclosure. Before totalling anything we clean the filings — applying each amendment over the original it replaces, removing duplicates, and setting aside non-standard records such as registrations and terminations — and map every filing to a lobbying channel and industry using the organization's CRP industry code.
How the money is divided. A filing's full value counts once toward the organization that paid it and that organization's industry, so the industry and organization rankings (Sections A–C) reflect whole dollars. But a single filing usually names several government entities, several issue areas, and several lobbyists at once, and the disclosure never says how the fee was split among them. Rather than credit the full amount to each — which would count the same dollars over and over — we divide a filing's value evenly across the distinct items it names. So a $200,000 filing that lists four agencies contributes $50,000 to each in Section D, and the same even split is applied across issues in Section E and across lobbyists in Section F. That way every section's totals trace back to the same underlying money without double-counting.
Reading the movements. A “deviation” compares the quarter's value to the average of the prior six quarters, so a rise or fall is measured against an entity's own recent norm rather than against the rest of the field. Section B takes the wider view: it sums every industry into one channel total and plots it quarter by quarter, with a fitted line showing the overall direction of travel. Source: US Senate and House LDA disclosures.