USA Lobbying on Defense - Washington (Q3 2026)


General Dynamics, Calista Corp, BAE Systems, AM General Corp, and Thales USA were unusually active lobbyists this quarter.
View the interactive network in Queen Street Analytics →
Each quarter we track movements in US federal lobbying, channel by channel. This edition covers Defense for Q3 of 2026, ranking the organizations, government entities, issues, and lobbyists whose disclosed spend moved most.
Central Themes in this Quarter’s Lobby Data
NDAA Stalemate Fuels Lobbying Surge on Advanced Systems and Shipbuilding
The FY 2027 National Defense Authorization Act advanced in the House but remained bogged down in Senate disputes through late July, intensifying industry lobbying by shipbuilders and electronics contractors such as General Dynamics, which engaged both the House of Representatives and the Department of Defense. Ongoing negotiations around procurement powers, cyber policy, and health amendments prompted direct outreach from top contractors, including General Dynamics, aiming to shape the bill’s final scope and appropriations.
📎 S. 4784, the National Defense Authorization Act for Fiscal Year 2027 · H.R. 8800 – National Defense Authorization Act for Fiscal Year 2027 · The FY27 NDAA: What Passed, What Failed, and What Comes Next
Unprecedented Defense Budget Debate Spurs Client Spending Spikes
Contractors notably increased lobbying as a record-setting $1.5 trillion topline defense request remained unresolved, with critical procurement and Navy modernization funding at stake. Companies such as General Dynamics—whose lobbying efforts in 2026-Q3 targeted the Office of Management & Budget (OMB), the Dept of Defense (DOD), and the House of Representatives—along with BAE Systems and Booz Allen Hamilton, allocated sharp spending increases to influence not only policy outcomes but also the timing of appropriations crucial for workforce and advanced systems programs.
📎 Tracking FY 2027 Defense Appropriations, Reconciliation, and the ... - CSIS · H.R. 8800 National Defense Authorization Act for Fiscal Year 2027 · NATIONAL DEFENSE AUTHORIZATION ACT FOR FISCAL YEAR 2027 R E P O R T
Industrial Base Modernization and Acquisition Reform Drive Targeted Lobbying
Lobbying filings indicate increased advocacy on industrial base investments, including shipyard development, advanced manufacturing, and acquisition policy reforms, with major contractors such as BAE Systems and General Dynamics engaging the Department of Defense and the House of Representatives on these issues. Industry push centered on multiyear procurement authorities and streamlined contracting, with contractors eager to secure positions in anticipated NDAA-driven modernization programs.
📎 The 2026 NDAA reshaped acquisition. Here’s a peek at 2027 reforms · NATIONAL DEFENSE AUTHORIZATION ACT FOR FISCAL YEAR 2027 R E P O R T · Congressional Research Service summary of NDAA trends
Supplemental Operations Funding Cited in Ground Systems Lobbying Uptick
Pending supplemental funding for military operations—specifically noted in requests related to ongoing conflicts—triggered escalated advocacy by contractors with ground vehicle and logistics portfolios, including General Dynamics in its outreach to the Department of the Army and House of Representatives. Uncertainty over contingency funding levels for rapid equipment production coincided with Q3 lobbying increases by companies such as AM General and BAE Systems.
📎 Tracking FY 2027 Defense Appropriations, Reconciliation, and the ... - CSIS · H.R. 8800 National Defense Authorization Act for Fiscal Year 2027

Section A: Lobbying Spend by Industry
How much each industry in this channel spent on federal lobbying in Q3 of 2026, compared with its average over the prior six quarters.
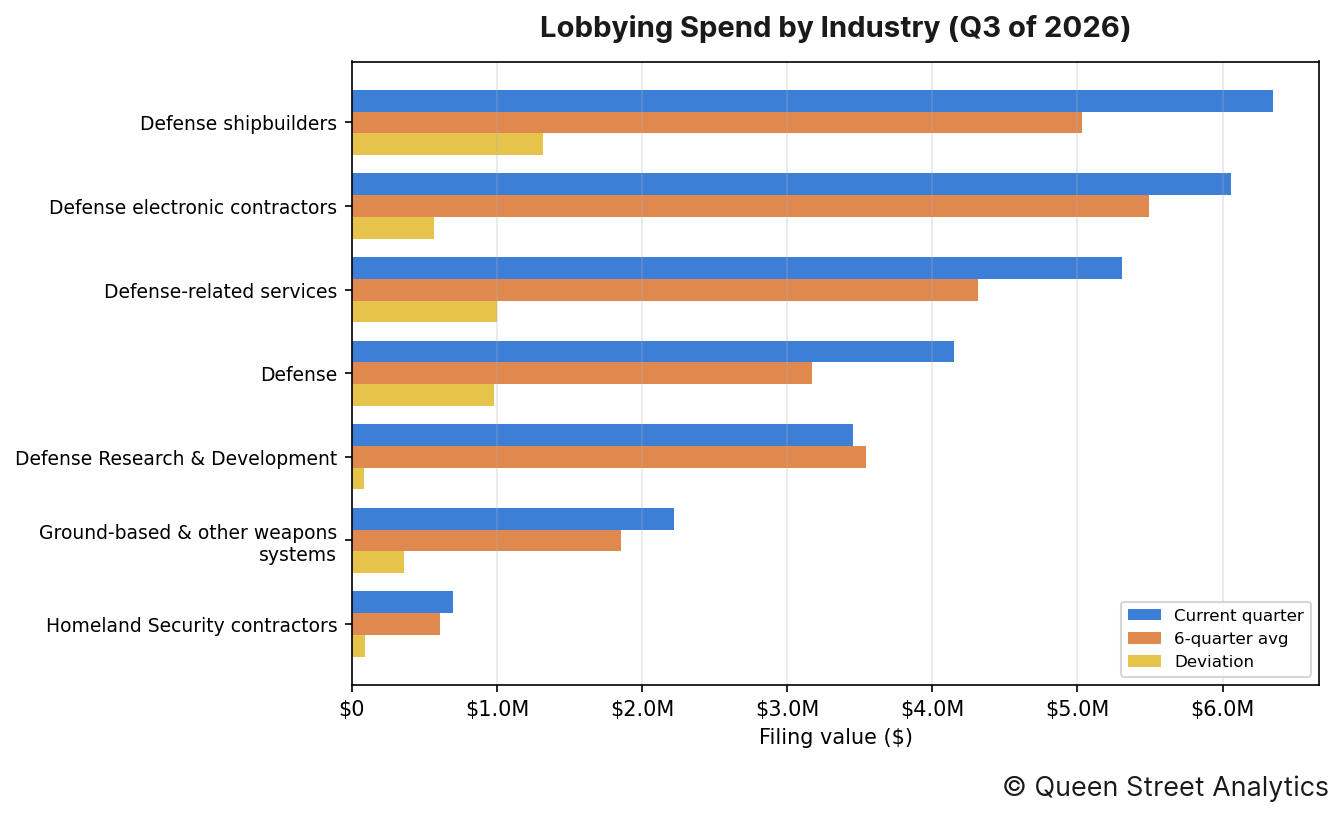
In Q3 of 2026, there was $28.2M worth of disclosed lobbying activity on Defense, 18% higher than the recent quarterly average of $24.0M. This activity can be broken down by industry as follows:
↳ There was $6.3M worth of Defense shipbuilders lobbying, 26% higher than the recent quarterly average of $5.0M.
↳ There was $6.1M worth of Defense electronic contractors lobbying, 10% higher than the recent quarterly average of $5.5M.
↳ There was $5.3M worth of Defense-related services lobbying, 23% higher than the recent quarterly average of $4.3M.
↳ There was $4.2M worth of Defense lobbying, 31% higher than the recent quarterly average of $3.2M.
↳ There was $3.5M worth of Defense Research & Development lobbying, roughly in line with the recent quarterly average of $3.5M.
↳ There was $2.2M worth of Ground-based & other weapons systems lobbying, 20% higher than the recent quarterly average of $1.9M.
Section B: Lobbying Spend Trend
This channel's total disclosed lobbying spend across recent quarters, aggregated over all of its industries.
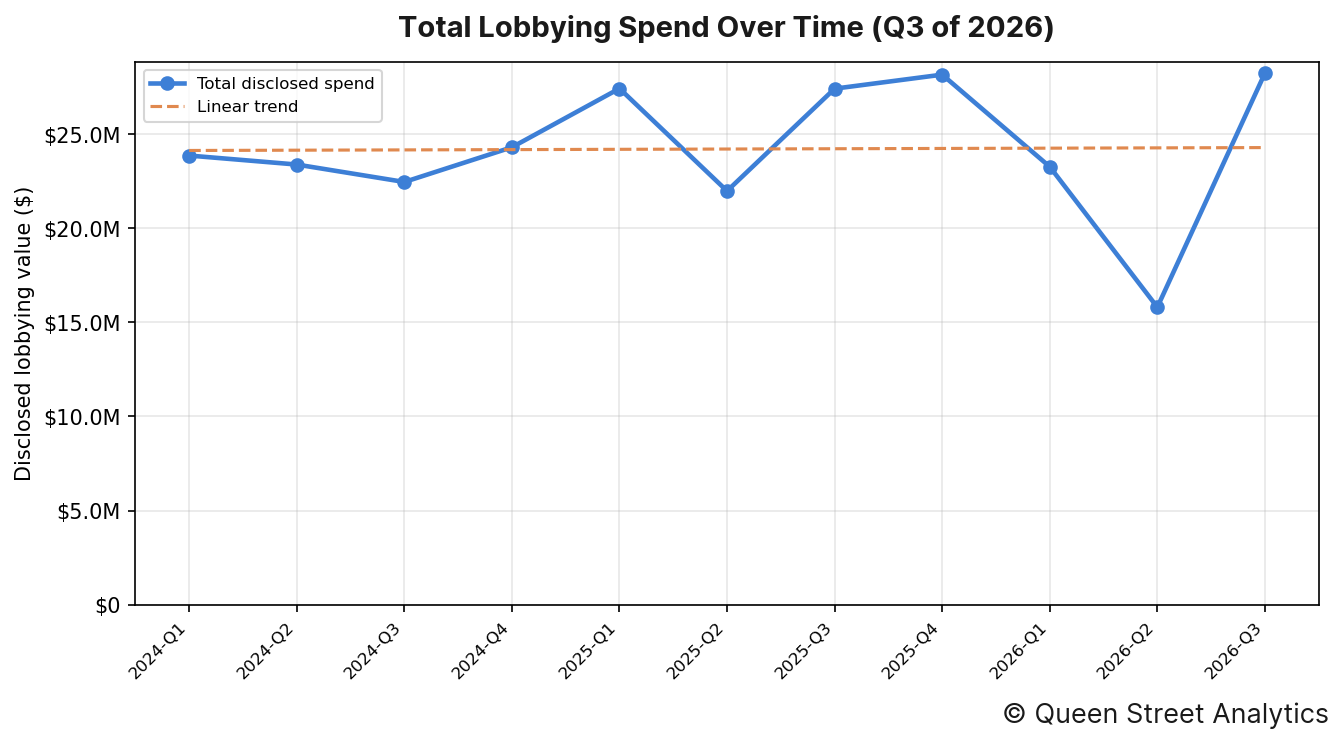
In Q3 of 2026, there was $28.2M worth of disclosed lobbying activity on Defense. Across the 11 quarters shown, the channel's total disclosed spend has risen over this period.
Organizations' Lobby Spend
The image below shows the organizations whose lobbying spend moved most from their six-quarter average.
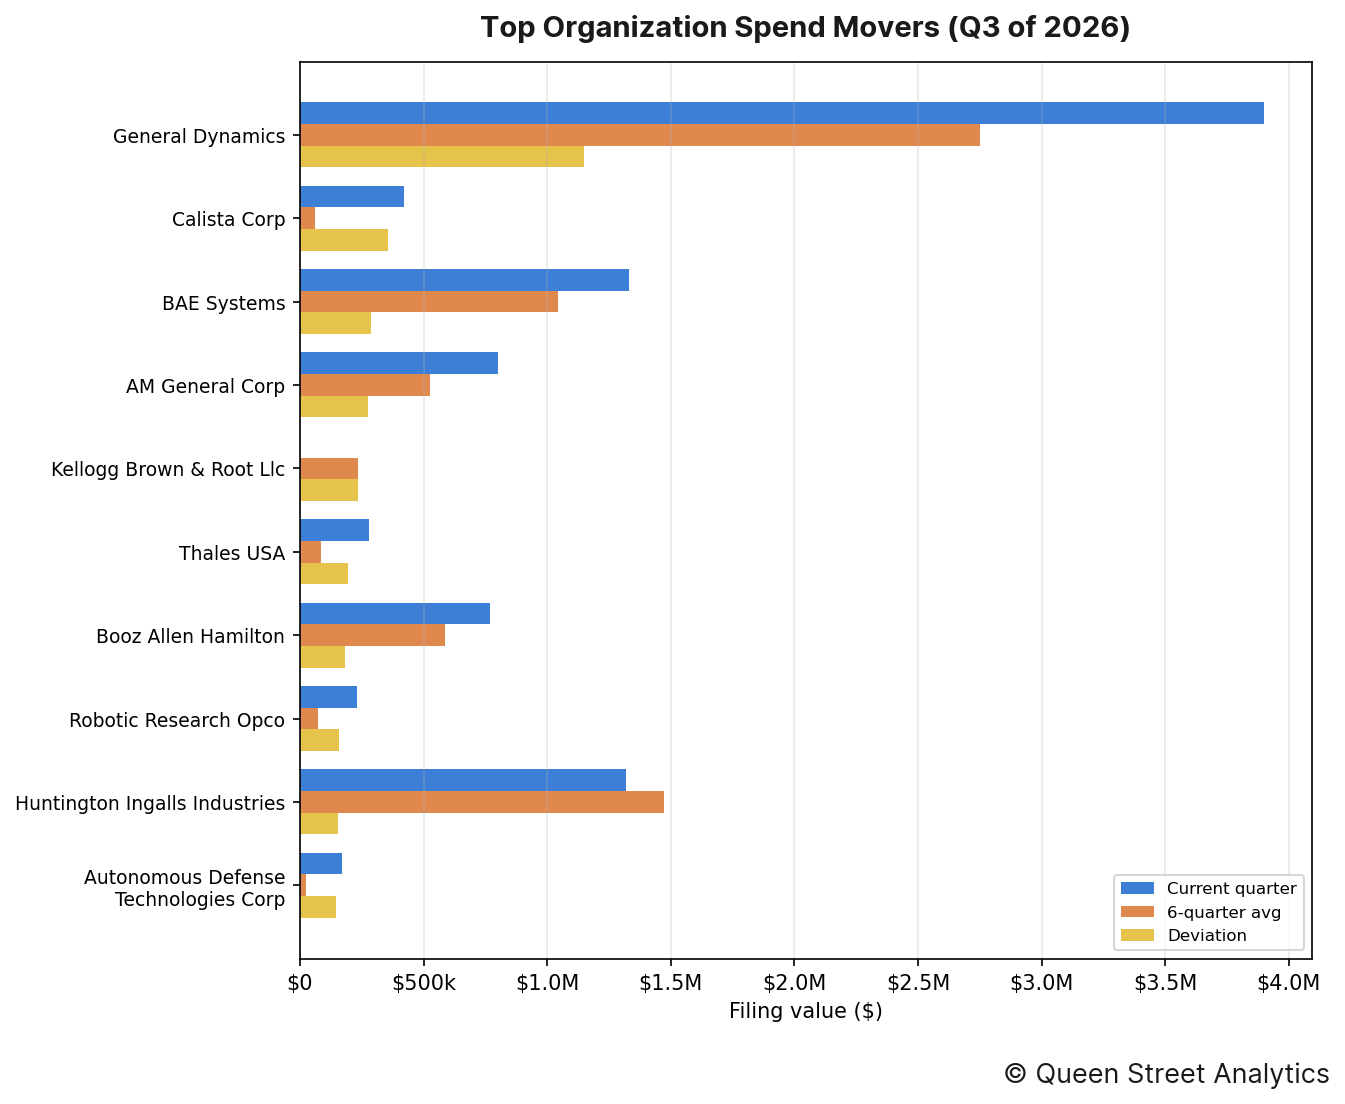
The organizations whose spending moved most from their own recent quarterly average were as follows:
↳ General Dynamics accounted for $3.9M in disclosed lobbying, 42% higher than the recent quarterly average of $2.7M.
↳ Calista Corp accounted for $420k in disclosed lobbying, 578% higher than the recent quarterly average of $62k.
↳ BAE Systems accounted for $1.3M in disclosed lobbying, 27% higher than the recent quarterly average of $1.0M.
↳ AM General Corp accounted for $800k in disclosed lobbying, 52% higher than the recent quarterly average of $525k.
↳ Kellogg Brown & Root Llc accounted for $0 in disclosed lobbying, 100% lower than the recent quarterly average of $235k.
↳ Thales USA accounted for $280k in disclosed lobbying, 229% higher than the recent quarterly average of $85k.
Section D: Government Entities Lobbied
This section documents this quarter's most lobbied federal government departments.
By industry
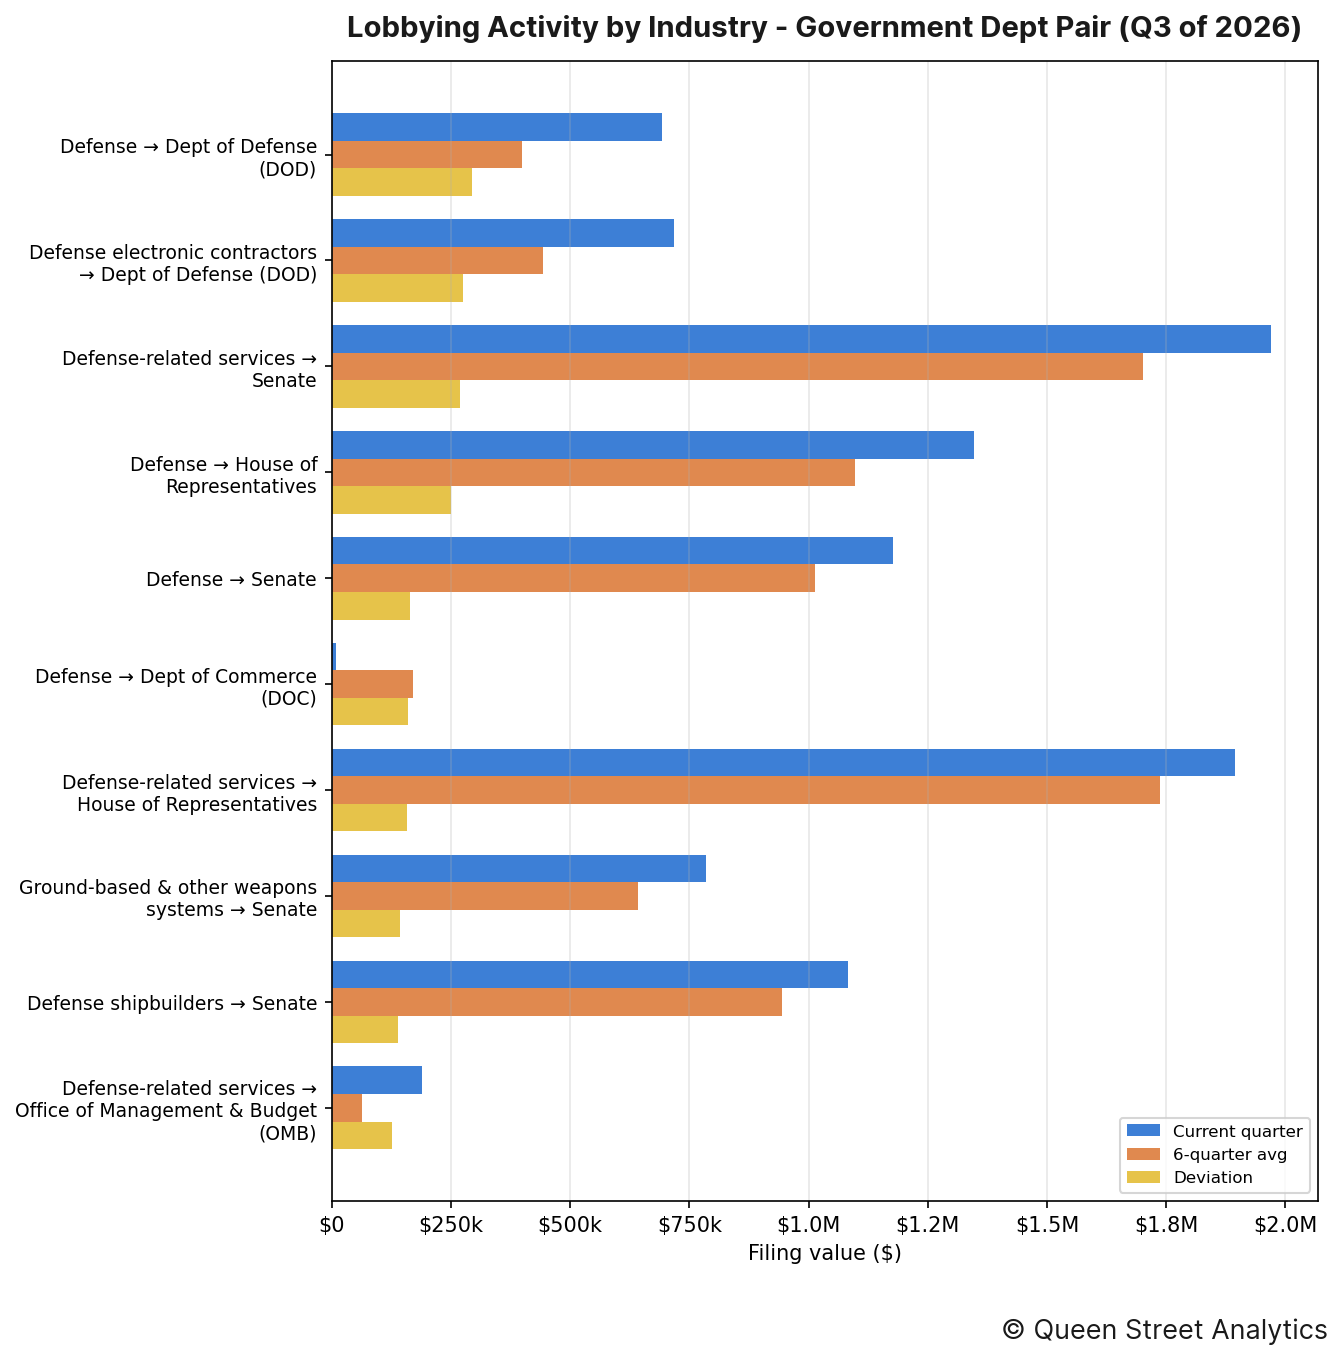
The industry–entity pairings that moved most this quarter were as follows:
↳ Defense directed $693k of lobbying toward Dept of Defense (DOD), 74% higher than the recent quarterly average of $399k.
↳ Defense electronic contractors directed $717k of lobbying toward Dept of Defense (DOD), 62% higher than the recent quarterly average of $443k.
↳ Defense-related services directed $2.0M of lobbying toward Senate, 16% higher than the recent quarterly average of $1.7M.
By organization
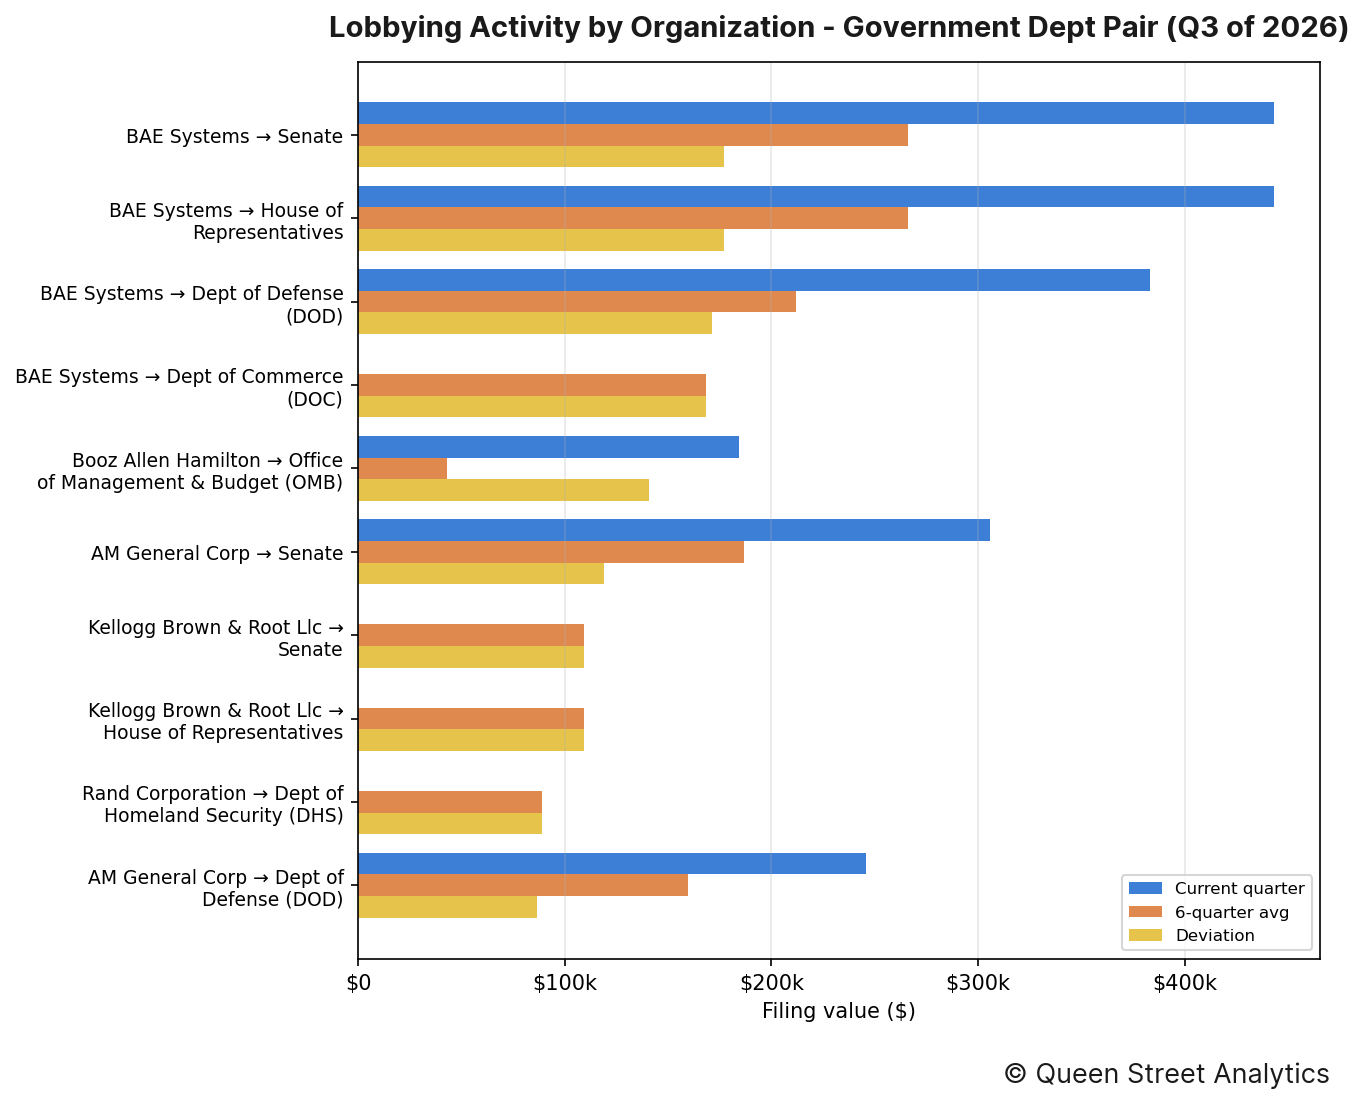
The organization–entity pairings that moved most this quarter were as follows:
↳ BAE Systems directed $443k of lobbying toward Senate, 67% higher than the recent quarterly average of $266k.
↳ BAE Systems directed $443k of lobbying toward House of Representatives, 67% higher than the recent quarterly average of $266k.
↳ BAE Systems directed $383k of lobbying toward Dept of Defense (DOD), 81% higher than the recent quarterly average of $212k.
Section E: Lobbying Issues
This section documents this quarter's most lobbied-on issues.
By industry
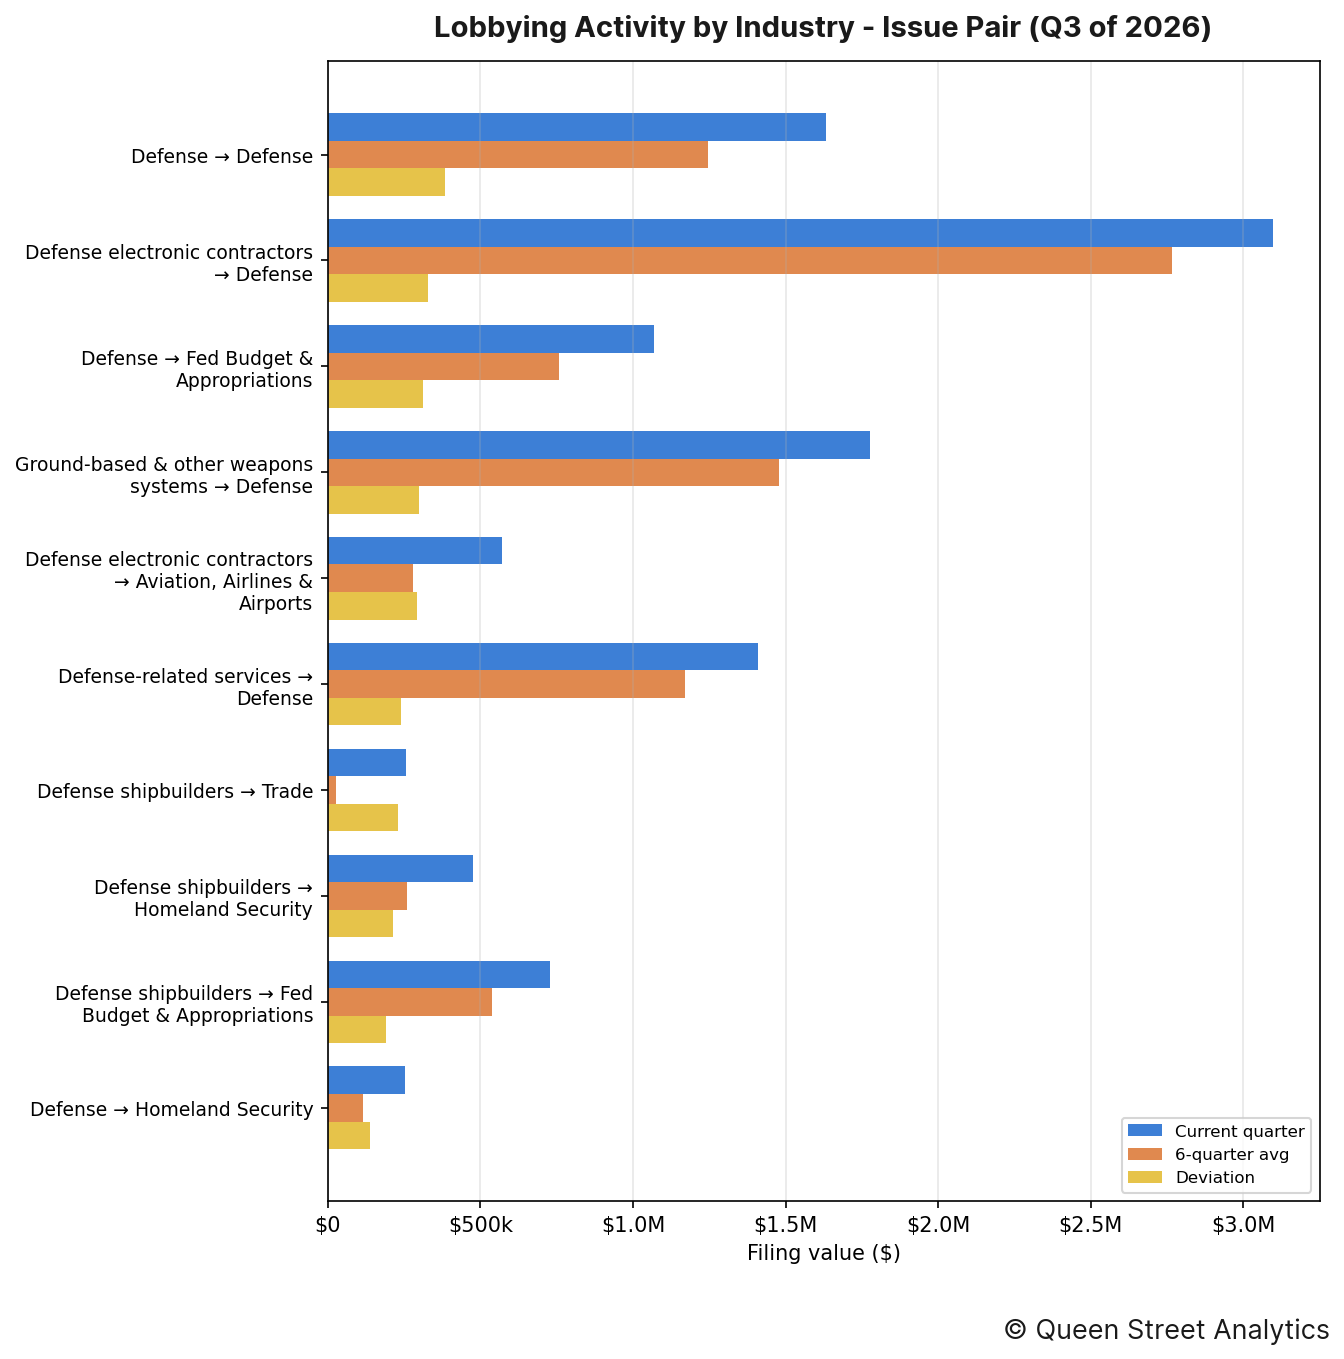
The industry–issue pairings that moved most this quarter were as follows:
↳ Defense put $1.6M toward lobbying on Defense, 31% higher than the recent quarterly average of $1.2M.
↳ Defense electronic contractors put $3.1M toward lobbying on Defense, 12% higher than the recent quarterly average of $2.8M.
↳ Defense put $1.1M toward lobbying on Fed Budget & Appropriations, 41% higher than the recent quarterly average of $757k.
By organization
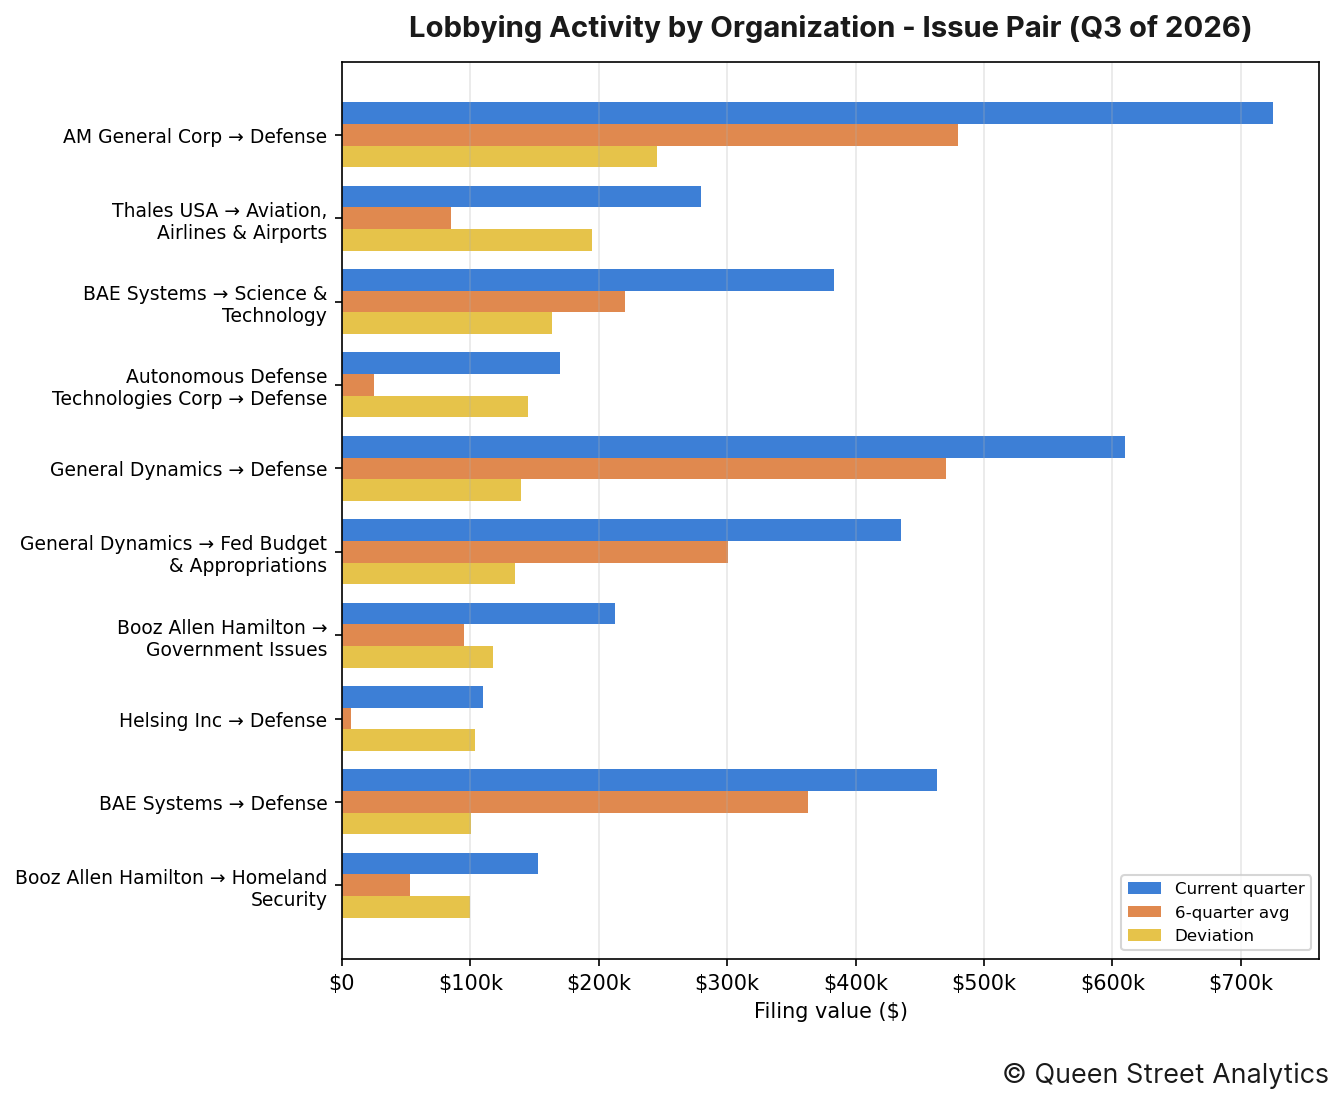
The organization–issue pairings that moved most this quarter were as follows:
↳ AM General Corp put $725k toward lobbying on Defense, 51% higher than the recent quarterly average of $480k.
↳ Thales USA put $280k toward lobbying on Aviation, Airlines & Airports, 229% higher than the recent quarterly average of $85k.
↳ BAE Systems put $383k toward lobbying on Science & Technology, 74% higher than the recent quarterly average of $220k.
Section F: Most-Active Lobbyists
The figure below lists the lobbyists who managed the most imputed lobbying value this quarter, alongside their firm or organization. Because a filing's value is split evenly across the lobbyists it names, these dollar figures are imputed rather than directly disclosed.
No lobbyist activity to report this quarter.
Section G: Organization Network
The header image for this edition maps how this channel's organizations (neutral nodes) connect to the federal entities they lobbied (colored nodes) this quarter. A link's weight is the filing value directed to that entity, and node size reflects total value; the House and Senate are excluded (nearly every organization lobbies them) so the specialized targets stand out.
The most widely lobbied entity this quarter was Dept of Defense (DOD), which was lobbied by 13 organizations.
Methodology
Every figure in this report starts from one number: the disclosed value of each lobbying filing, which we take as the income a registrant reported plus any in-house expenses (income + expenses) on its quarterly US Senate and House LDA disclosure. Before totalling anything we clean the filings — applying each amendment over the original it replaces, removing duplicates, and setting aside non-standard records such as registrations and terminations — and map every filing to a lobbying channel and industry using the organization's CRP industry code.
How the money is divided. A filing's full value counts once toward the organization that paid it and that organization's industry, so the industry and organization rankings (Sections A–C) reflect whole dollars. But a single filing usually names several government entities, several issue areas, and several lobbyists at once, and the disclosure never says how the fee was split among them. Rather than credit the full amount to each — which would count the same dollars over and over — we divide a filing's value evenly across the distinct items it names. So a $200,000 filing that lists four agencies contributes $50,000 to each in Section D, and the same even split is applied across issues in Section E and across lobbyists in Section F. That way every section's totals trace back to the same underlying money without double-counting.
Reading the movements. A “deviation” compares the quarter's value to the average of the prior six quarters, so a rise or fall is measured against an entity's own recent norm rather than against the rest of the field. Section B takes the wider view: it sums every industry into one channel total and plots it quarter by quarter, with a fitted line showing the overall direction of travel. Source: US Senate and House LDA disclosures.


