USA Lobbying on Tribal Affairs - Washington (Q4 2025)





Cherokee Nation, Lytton Rancheria of California, Confederated Tribes of the Umatilla Indian Reservation, Poarch Band of Creek Indians, Chenega Supply Chain Solutions LLC were unusually active lobbyists this quarter.
View the interactive network in Queen Street Analytics →
Each quarter we track movements in US federal lobbying, channel by channel. This edition covers Tribal Affairs for Q4 of 2025, ranking the organizations, government entities, issues, and lobbyists whose disclosed spend moved most.
Central Themes in this Quarter’s Lobby Data
Water Settlement Legislation Drives Record Advocacy Activity
A wave of bills on tribal water rights—including provisions for Navajo, Hopi, and San Juan Southern Paiute Tribes—moved through Congress, mirroring a surge in lobbying spend from The Navajo Nation and Yavapai-Apache Nation targeting the House of Representatives, Senate, and the Department of the Interior. Policymakers appear focused on finalizing settlements and expanding federal infrastructure and water trust funds, with advocacy groups such as The Three Affiliated Tribes of North Dakota and the Confederated Tribes of the Umatilla Indian Reservation targeting both Congress and the Department of the Interior.
📎 Congress.gov, H.R.2025 - Northeastern Arizona Indian Water Rights Settlement Act · Western States Water Council - Symposium announcement and legislative roundup · GovTrack.us - Bill summary and legislative status · Congressional Research Service summary of Indian Water Settlements (June 2025)
Lobbying Intensifies Over Historic Preservation Fund Reauthorization
Significant advocacy efforts tracked the introduction of the Historic Preservation Fund Reauthorization Act and related calls for increased appropriations to benefit tribal preservation projects, with the National Association of Tribal Historic Preservation Officers lobbying the House of Representatives and the Department of the Interior on these issues. Tribal coalitions demanded larger allocations for Tribal Historic Preservation Officers, while multiple filers, including the National Association of Tribal Historic Preservation Officers and the Seminole Tribe of Florida, referenced concerns over funding, NEPA, and NAGPRA in their disclosures.
📎 National Trust for Historic Preservation call to action (Nov. 2025) · Congress.gov - H.R.3418 Historic Preservation Fund Reauthorization Act · ACHP Advisory letter urging higher FY2025 HPF appropriations · ATNI Tribal Resolution #2025-15 seeking 20% HPF allocation for THPOs
New Law Answers Calls for Easier Tribal Trust Land Homeownership
Following persistent lobbying on land trust reform by the Seminole Tribe of Florida and J. Conrad Seneca, Seneca Nation President with both the House of Representatives and the Senate, Congress enacted the Tribal Trust Land Homeownership Act. The law mandates streamlined federal procedures for mortgage and lease approvals on tribal lands, with advocacy groups such as the Confederated Tribes of the Umatilla Indian Reservation—who actively engaged with the House of Representatives and Department of Interior—quick to praise provisions aimed at breaking longstanding economic development barriers for Native communities.
📎 GovInfo.gov - Public Law 119-88 text (Tribal Trust Land Homeownership Act of 2025) · GovTrack.us - S.723 (passed version) · NAIHC press release applauding Senate passage
Federal Economic Development Consultations and Grants Aligned with Advocacy
Consultations and grant offerings targeting tribal economic development accelerated in the latter half of 2025, reflecting focal points in many lobbying filings by Northwest Native Chamber with the House of Representatives and Senate, and Cook Inlet Region Incorporated (Ciri) with the House of Representatives. Increases in federal appropriations for Native entrepreneurship, small business support, and infrastructure programs were highlighted in cross-agency reporting, including efforts from Spirit Lake Tribe with the Bureau of Indian Affairs (BIA).
📎 Social and Economic Development Strategies -SEDS · Consultations | U.S. Economic Development Administration · FY 2025 NATIVE AMERICAN FUNDING CROSSCUT
Tribal Clients Sharply Increase Direct Lobbying to Congress and Interior
Multiple tribal governments—including Cherokee Nation, Lytton Rancheria, and Poarch Band of Creek Indians—reported lobbying outlays several times higher than their historical averages targeting the House, Senate, BIA, and Department of the Interior during this period, with Prairie Island Indian Community and Confederated Tribes of the Umatilla Indian Reservation also engaging with the House of Representatives and Department of the Interior. Public disclosures cite advocacy on issues from land trust policy to economic development and settlement legislation, though specific project details remain largely undisclosed.
📎 Cherokee Nation Lobbies on Gaming, Sovereignty Issues

Section A: Lobbying Spend by Industry
How much each industry in this channel spent on federal lobbying in Q4 of 2025, compared with its average over the prior six quarters.
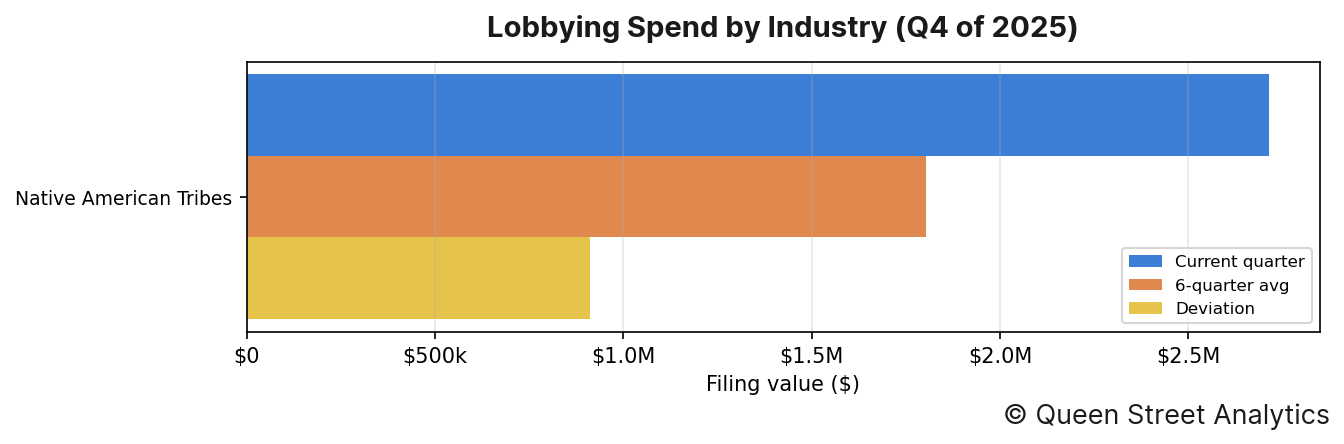
In Q4 of 2025, there was $2.7M worth of disclosed lobbying activity on Tribal Affairs, 51% higher than the recent quarterly average of $1.8M. This activity can be broken down by industry as follows:
↳ There was $2.7M worth of Native American Tribes lobbying, 51% higher than the recent quarterly average of $1.8M.
Section B: Lobbying Spend Trend
This channel's total disclosed lobbying spend across recent quarters, aggregated over all of its industries.
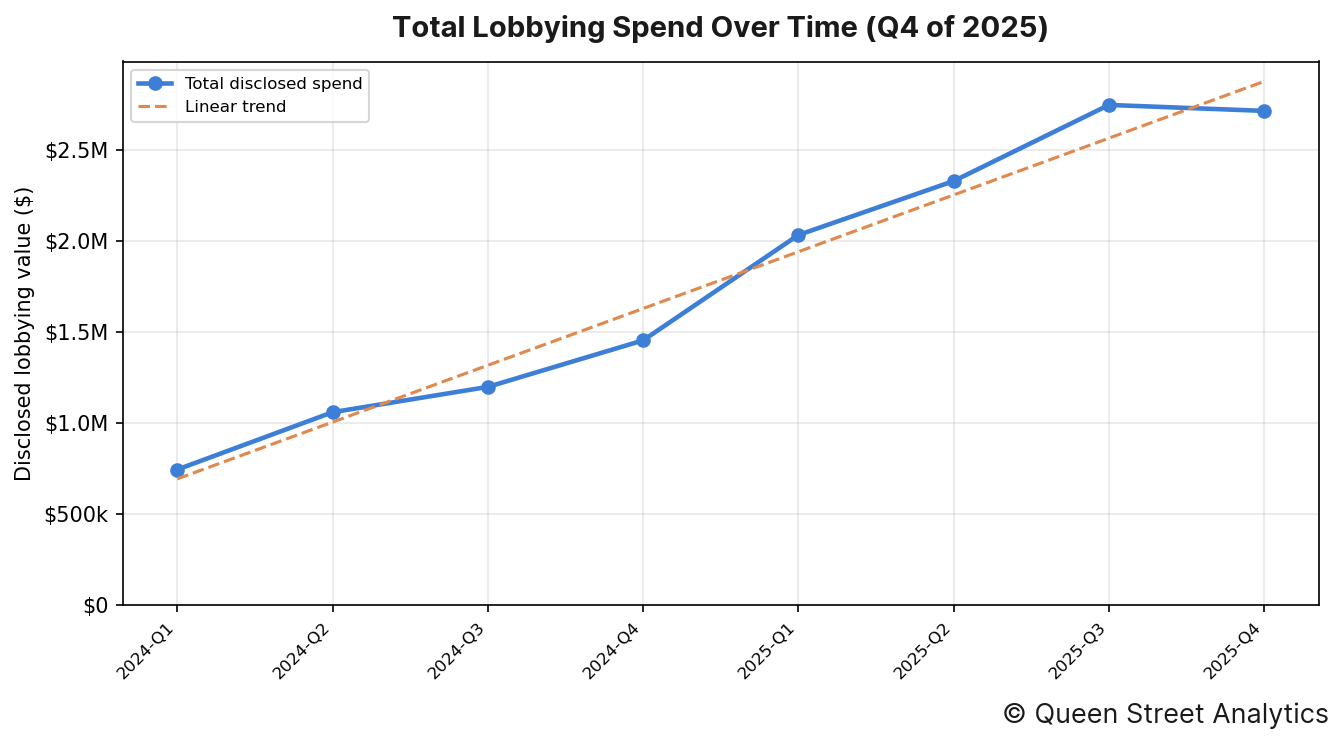
In Q4 of 2025, there was $2.7M worth of disclosed lobbying activity on Tribal Affairs. Across the 8 quarters shown, the channel's total disclosed spend has risen over this period.
Organizations' Lobby Spend
The image below shows the organizations whose lobbying spend moved most from their six-quarter average.
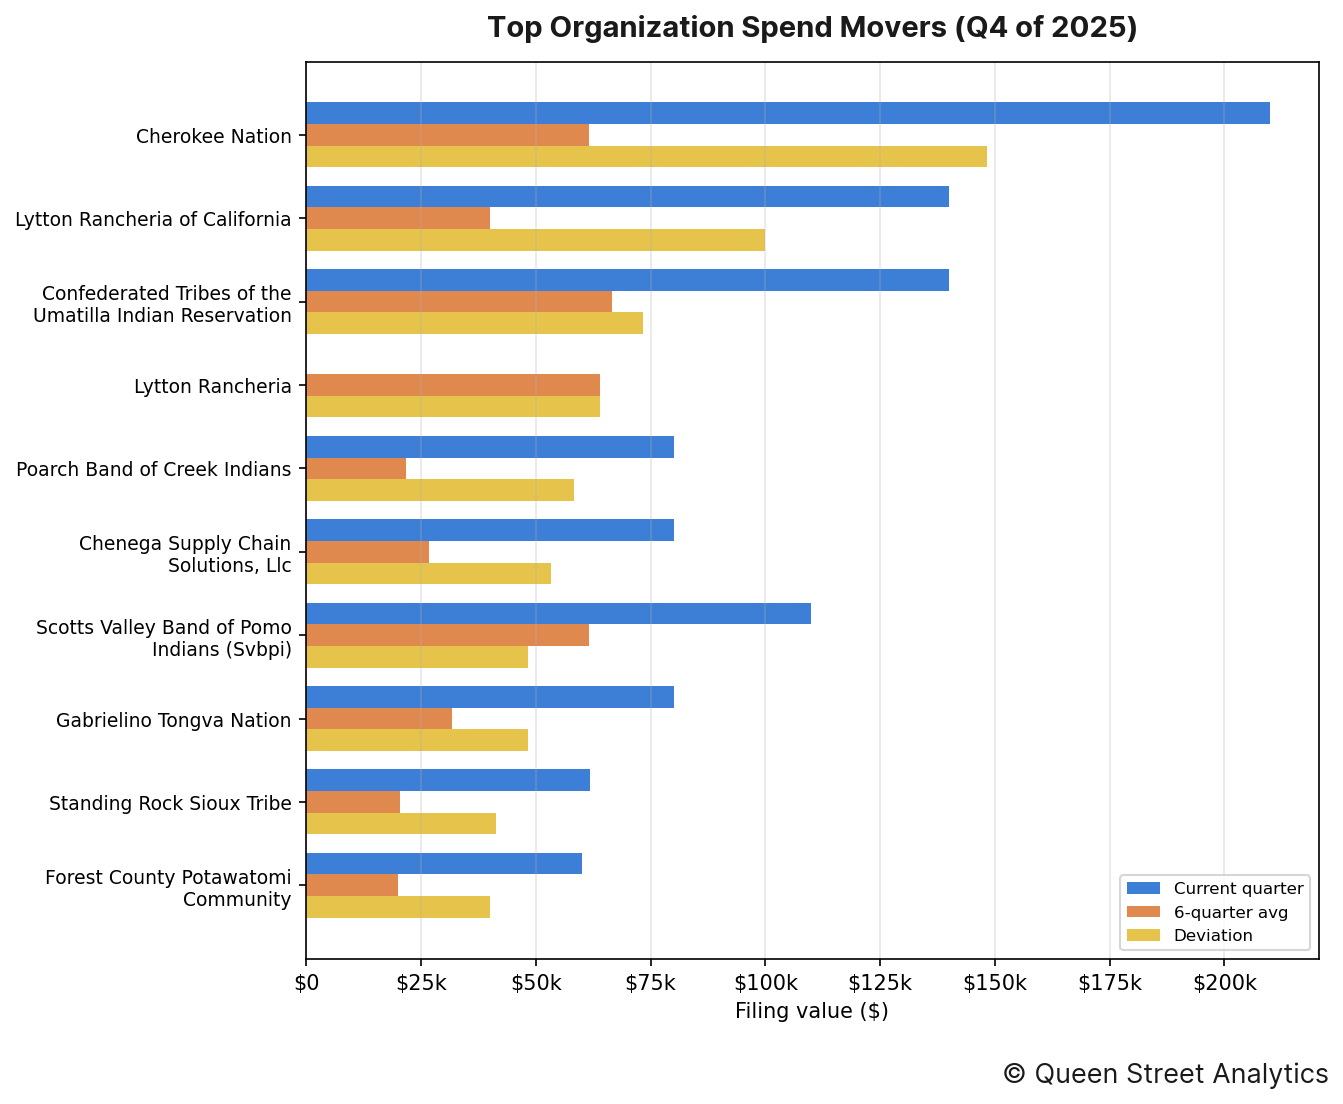
The organizations whose spending moved most from their own recent quarterly average were as follows:
↳ Cherokee Nation accounted for $210k in disclosed lobbying, 241% higher than the recent quarterly average of $62k.
↳ Lytton Rancheria of California accounted for $140k in disclosed lobbying, 250% higher than the recent quarterly average of $40k.
↳ Confederated Tribes of the Umatilla Indian Reservation accounted for $140k in disclosed lobbying, 110% higher than the recent quarterly average of $67k.
↳ Lytton Rancheria accounted for $0 in disclosed lobbying, 100% lower than the recent quarterly average of $64k.
↳ Poarch Band of Creek Indians accounted for $80k in disclosed lobbying, 269% higher than the recent quarterly average of $22k.
↳ Chenega Supply Chain Solutions, Llc accounted for $80k in disclosed lobbying, 200% higher than the recent quarterly average of $27k.
Section D: Government Entities Lobbied
This section documents this quarter's most lobbied federal government departments.
By industry
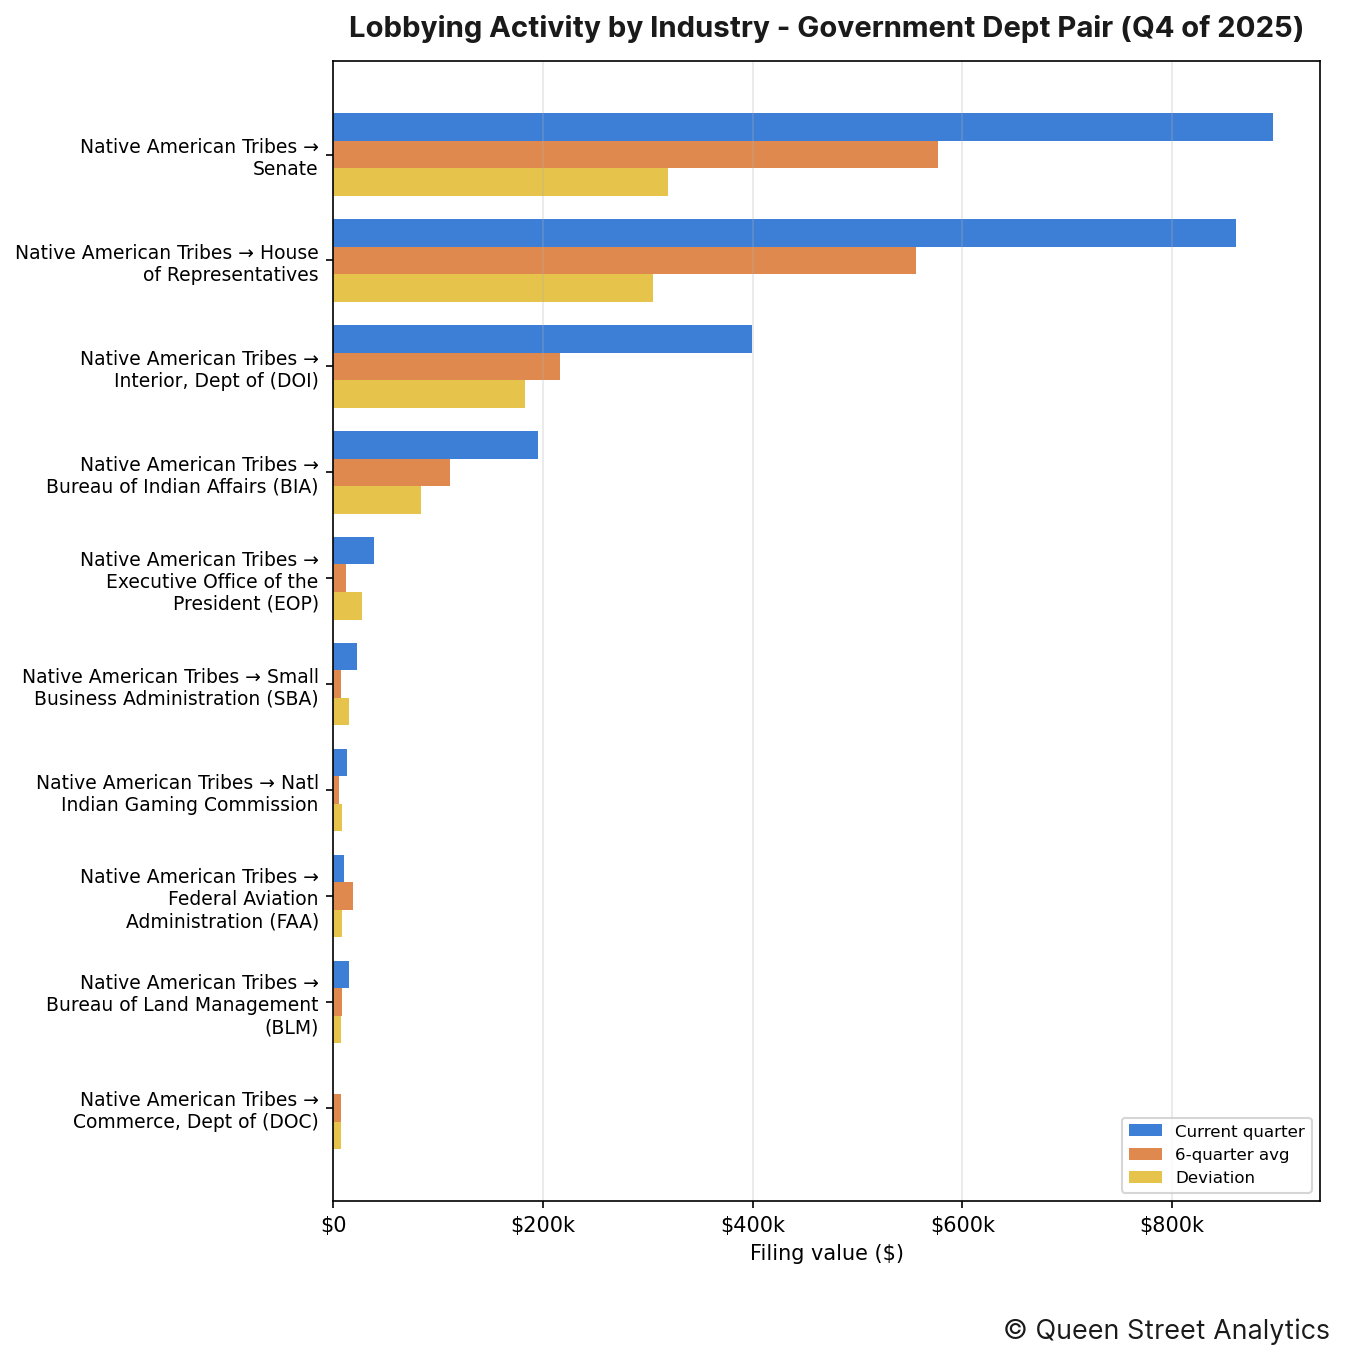
The industry–entity pairings that moved most this quarter were as follows:
↳ Native American Tribes directed $896k of lobbying toward Senate, 55% higher than the recent quarterly average of $577k.
↳ Native American Tribes directed $861k of lobbying toward House of Representatives, 55% higher than the recent quarterly average of $556k.
↳ Native American Tribes directed $399k of lobbying toward Dept of Interior (DOI), 85% higher than the recent quarterly average of $216k.
By organization
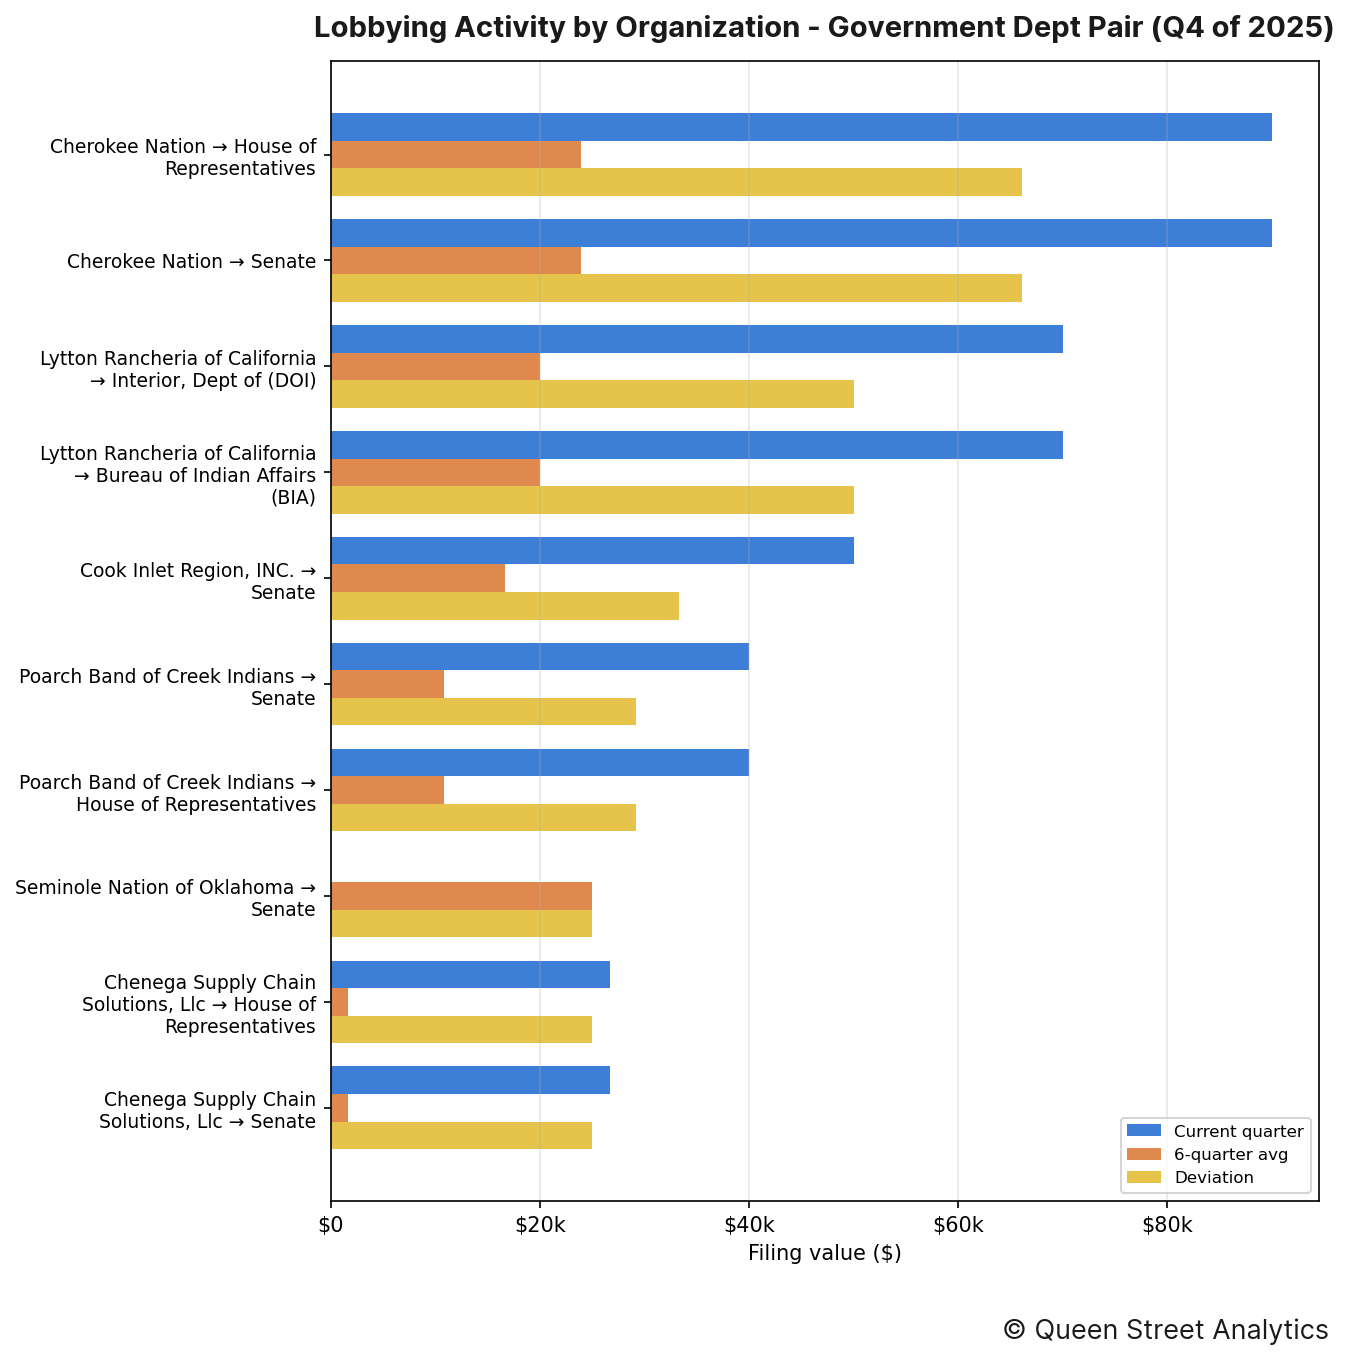
The organization–entity pairings that moved most this quarter were as follows:
↳ Cherokee Nation directed $90k of lobbying toward House of Representatives, 277% higher than the recent quarterly average of $24k.
↳ Cherokee Nation directed $90k of lobbying toward Senate, 277% higher than the recent quarterly average of $24k.
↳ Lytton Rancheria of California directed $70k of lobbying toward Dept of Interior (DOI), 250% higher than the recent quarterly average of $20k.
Section E: Lobbying Issues
This section documents this quarter's most lobbied-on issues.
By industry
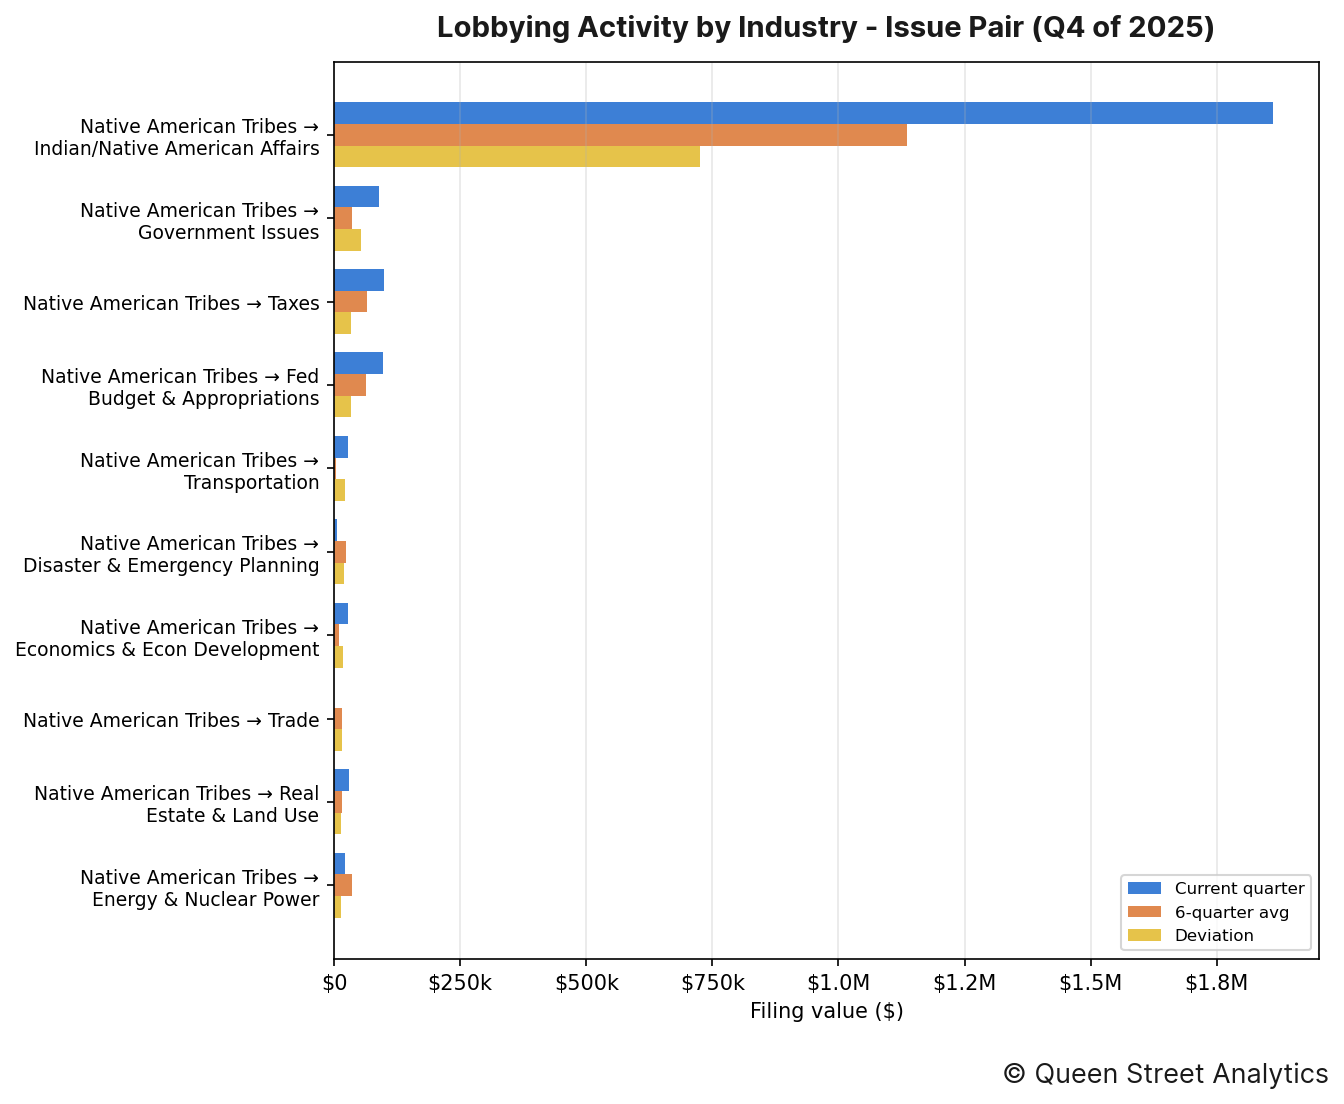
The industry–issue pairings that moved most this quarter were as follows:
↳ Native American Tribes put $1.9M toward lobbying on Indian/Native American Affairs, 64% higher than the recent quarterly average of $1.1M.
↳ Native American Tribes put $89k toward lobbying on Government Issues, 154% higher than the recent quarterly average of $35k.
↳ Native American Tribes put $99k toward lobbying on Taxes, 53% higher than the recent quarterly average of $64k.
By organization
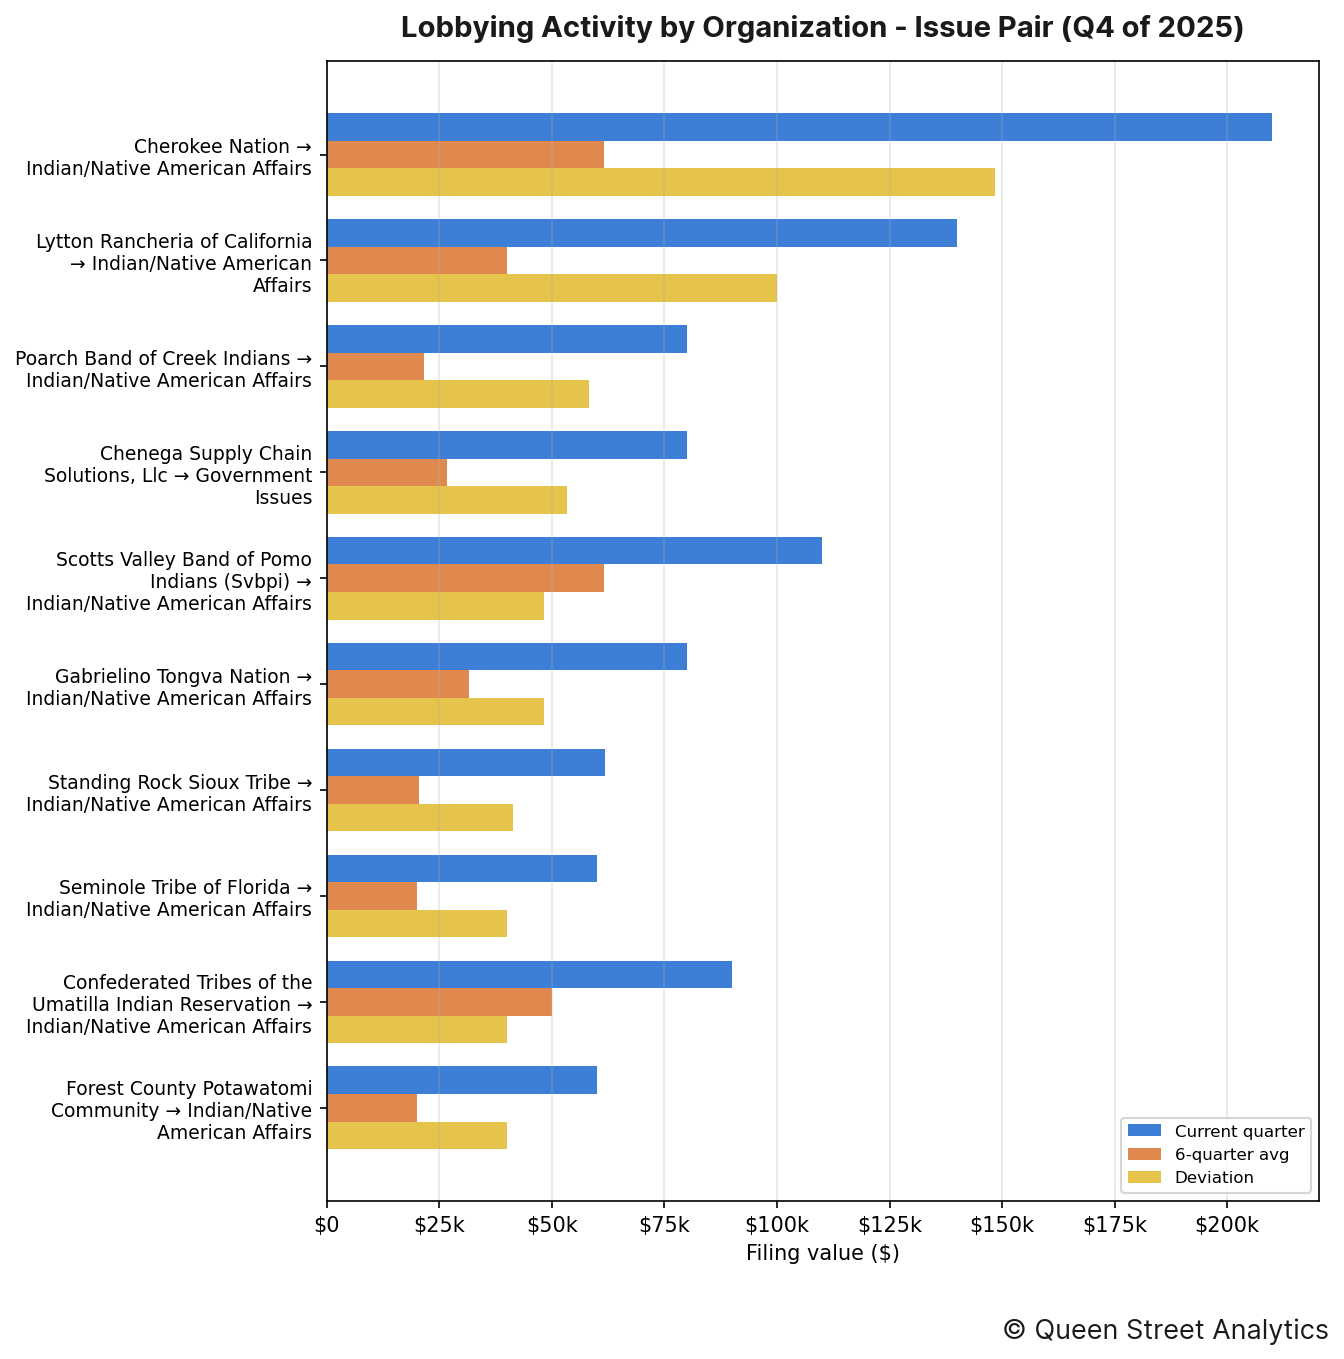
The organization–issue pairings that moved most this quarter were as follows:
↳ Cherokee Nation put $210k toward lobbying on Indian/Native American Affairs, 241% higher than the recent quarterly average of $62k.
↳ Lytton Rancheria of California put $140k toward lobbying on Indian/Native American Affairs, 250% higher than the recent quarterly average of $40k.
↳ Poarch Band of Creek Indians put $80k toward lobbying on Indian/Native American Affairs, 269% higher than the recent quarterly average of $22k.
Section F: Most-Active Lobbyists
The figure below lists the lobbyists who managed the most imputed lobbying value this quarter, alongside their firm or organization. Because a filing's value is split evenly across the lobbyists it names, these dollar figures are imputed rather than directly disclosed.
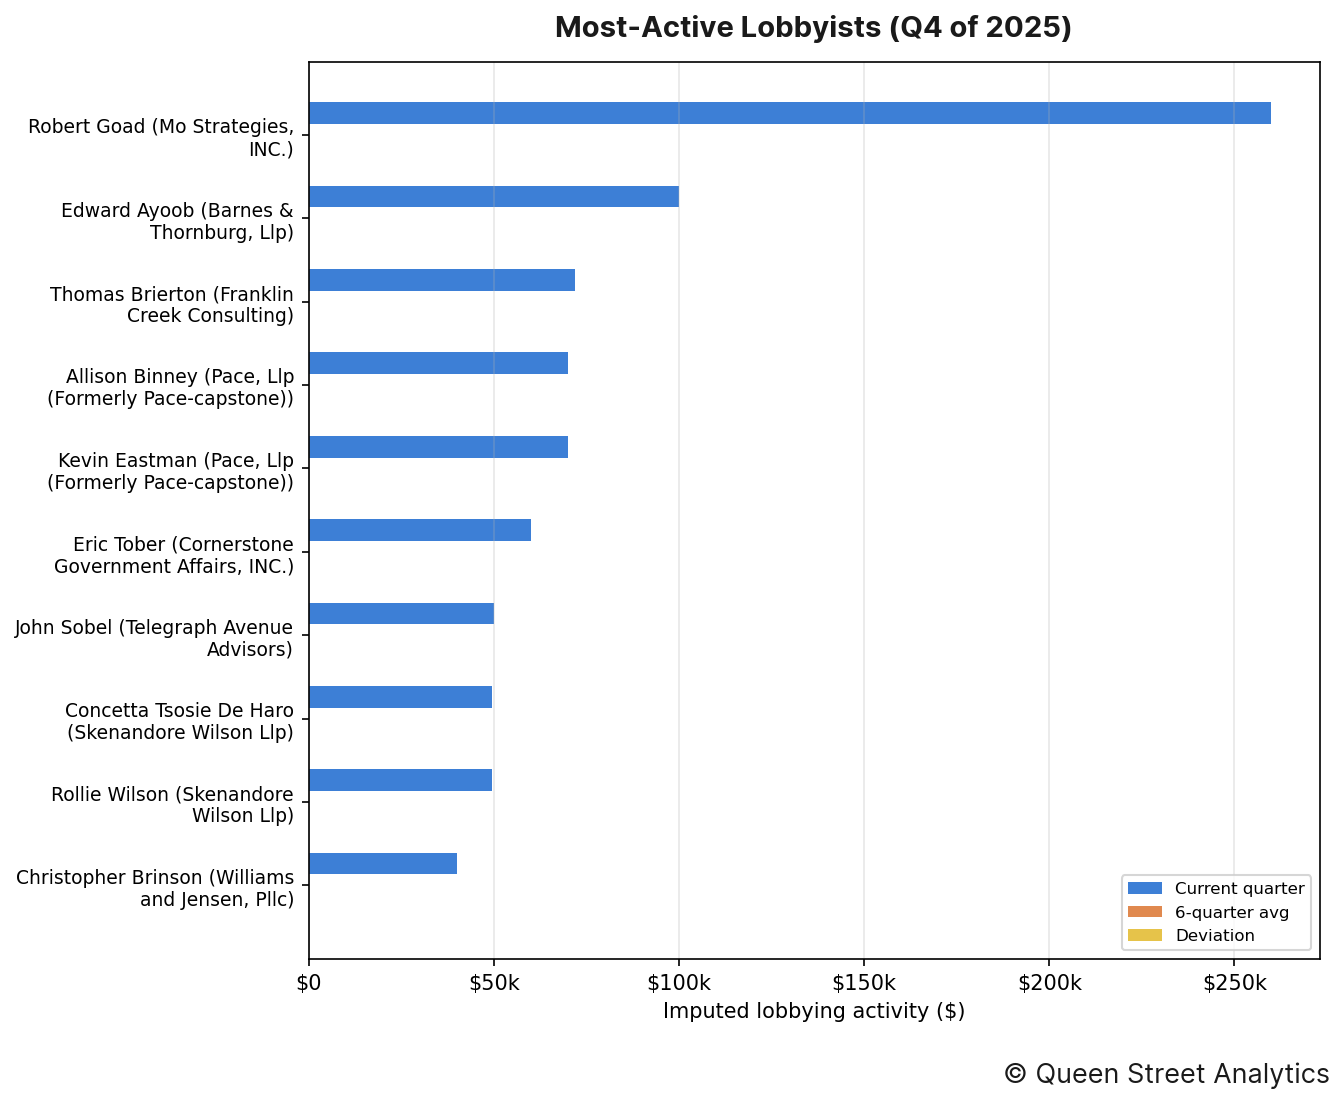
The lobbyists who managed the most imputed lobbying value this quarter were as follows:
↳ Robert Goad (Mo Strategies, INC) was credited with an imputed $260k in lobbying activity.
↳ Edward Ayoob (Barnes & Thornburg, Llp) was credited with an imputed $100k in lobbying activity.
↳ Thomas Brierton (Franklin Creek Consulting) was credited with an imputed $72k in lobbying activity.
↳ Allison Binney (Pace, Llp (Formerly Pace-capstone)) was credited with an imputed $70k in lobbying activity.
↳ Kevin Eastman (Pace, Llp (Formerly Pace-capstone)) was credited with an imputed $70k in lobbying activity.
Section G: Organization Network
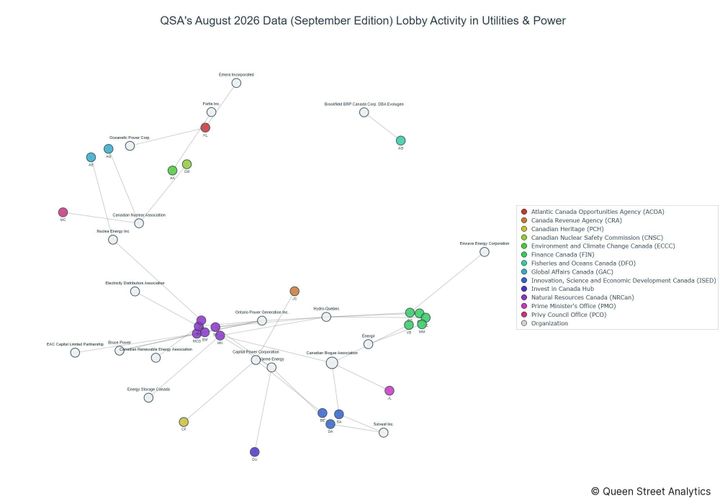
The header image for this edition maps how this channel's organizations (neutral nodes) connect to the federal entities they lobbied (colored nodes) this quarter. A link's weight is the filing value directed to that entity, and node size reflects total value; the House and Senate are excluded (nearly every organization lobbies them) so the specialized targets stand out.
The most widely lobbied entity this quarter was Dept of Interior (DOI), which was lobbied by 14 organizations.
Methodology
Every figure in this report starts from one number: the disclosed value of each lobbying filing, which we take as the income a registrant reported plus any in-house expenses (income + expenses) on its quarterly US Senate and House LDA disclosure. Before totalling anything we clean the filings — applying each amendment over the original it replaces, removing duplicates, and setting aside non-standard records such as registrations and terminations — and map every filing to a lobbying channel and industry using the organization's CRP industry code.
How the money is divided. A filing's full value counts once toward the organization that paid it and that organization's industry, so the industry and organization rankings (Sections A–C) reflect whole dollars. But a single filing usually names several government entities, several issue areas, and several lobbyists at once, and the disclosure never says how the fee was split among them. Rather than credit the full amount to each — which would count the same dollars over and over — we divide a filing's value evenly across the distinct items it names. So a $200,000 filing that lists four agencies contributes $50,000 to each in Section D, and the same even split is applied across issues in Section E and across lobbyists in Section F. That way every section's totals trace back to the same underlying money without double-counting.
Reading the movements. A “deviation” compares the quarter's value to the average of the prior six quarters, so a rise or fall is measured against an entity's own recent norm rather than against the rest of the field. Section B takes the wider view: it sums every industry into one channel total and plots it quarter by quarter, with a fitted line showing the overall direction of travel. Source: US Senate and House LDA disclosures.