USA Lobbying on Utilities & Power - Washington (Q4 2025)





Duke Energy, PG&E Corp, Constellation Energy Generation, Leeward Renewable Energy, Edison Electric Institute were unusually active lobbyists this quarter.
View the interactive network in Queen Street Analytics →
Each quarter we track movements in US federal lobbying, channel by channel. This edition covers Utilities & Power for Q4 of 2025, ranking the organizations, government entities, issues, and lobbyists whose disclosed spend moved most.
Central Themes in this Quarter’s Lobby Data
Deregulatory Orders and National Energy Emergency Trigger Utility Scrutiny
In Q4 2025, surges in advocacy by major utilities, including PG&E Corp and the American Public Power Assn, coincided with sweeping executive actions—such as the National Energy Emergency declaration and deregulation-focused orders—impacting wind energy permitting and sunsetting prior environmental rules. Many observers note these measures brought significant regulatory uncertainty for power producers, likely motivating lobbying around agency implementation at the Department of Energy and legislative fixes before the House of Representatives and Senate.
📎 Unleashing American Energy: Deregulatory Executive Orders · Federal Renewable Energy Policy Shifts in 2025: What Developers Need to ... · How Federal Energy Policy Impacts Project Development in 2025 | Dudek Blog
Congress Eyes Grid Reliability Laws Amid Utility Lobby Push
Legislative efforts to centralize federal oversight through bills like the Reliable Power Act and GRID Power Act drew heightened attention from utilities, with advocacy peaking as Congress debated FERC’s enhanced role and possible limits on plant retirements. These initiatives, if passed, could fundamentally change the relationship between utilities and federal agencies.
📎 Legislative Developments Could Impact Environmental and Energy Sectors · Legislative Conference: Co-ops Get Policy, Funding Insights From ...
Shifts and Delays in Federal Infrastructure Funding Fuel Stakeholder Uncertainty
A wave of reviews and pauses affecting multibillion-dollar Department of Energy and USDA programs introduced uncertainty for rural and investor-owned utilities, including PG&E Corp, seeking grid and infrastructure grants. Such administrative delays were a likely driver for increased outreach by top utility clients like PG&E Corp to the Department of Energy and the Department of Agriculture, as they worked to secure critical funding under revised energy policy guidelines.
📎 Legislative Conference: Co-ops Get Policy, Funding Insights From ... · Energy regulation & Policy News | Utility Dive · How Federal Energy Policy Impacts Project Development in 2025 | Dudek Blog
Federal Rulemakings Create Operational Hurdles for Utilities
Major utilities and their trade groups, including Dominion Energy and the Clean Energy Buyers Assn, ramped up agency-directed lobbying—such as efforts before the Environmental Protection Agency (EPA) and the White House Office—in response to a complex Spring 2025 regulatory agenda, which previewed wide-ranging changes on oil and gas leasing, carbon accounting, and even conservation rule rollbacks. The staggered timelines and breadth of possible reversals injected further volatility into utility planning and project development.
📎 2025 Updates on Federal Energy and Natural Resource Rulemakings · Home Page | Federal Energy Regulatory Commission · October 29, 2025 Regulatory Update | FERC, CPUC, CAISO, CEC, CARB, PJM ...
Policy Shifts Recast Environmental Justice and Renewables Priorities
Rollbacks on environmental justice initiatives, withdrawal from the Paris Agreement, and new challenges for renewable energy permits recast the landscape for both legacy and clean energy developers. This broad recalibration appeared to prompt lobbying activity from the Business Council for Sustainable Energy, which engaged with the Environmental Protection Agency and the Federal Energy Regulatory Commission, among others, as utilities sought policy clarity and competitive positioning across generation types.
📎 Federal Renewable Energy Policy Shifts in 2025: What Developers Need to ... · How Federal Energy Policy Impacts Project Development in 2025 | Dudek Blog · 2025 Energy Policy Outlook: Industry Uncertainty and Executive Orders

Section A: Lobbying Spend by Industry
How much each industry in this channel spent on federal lobbying in Q4 of 2025, compared with its average over the prior six quarters.
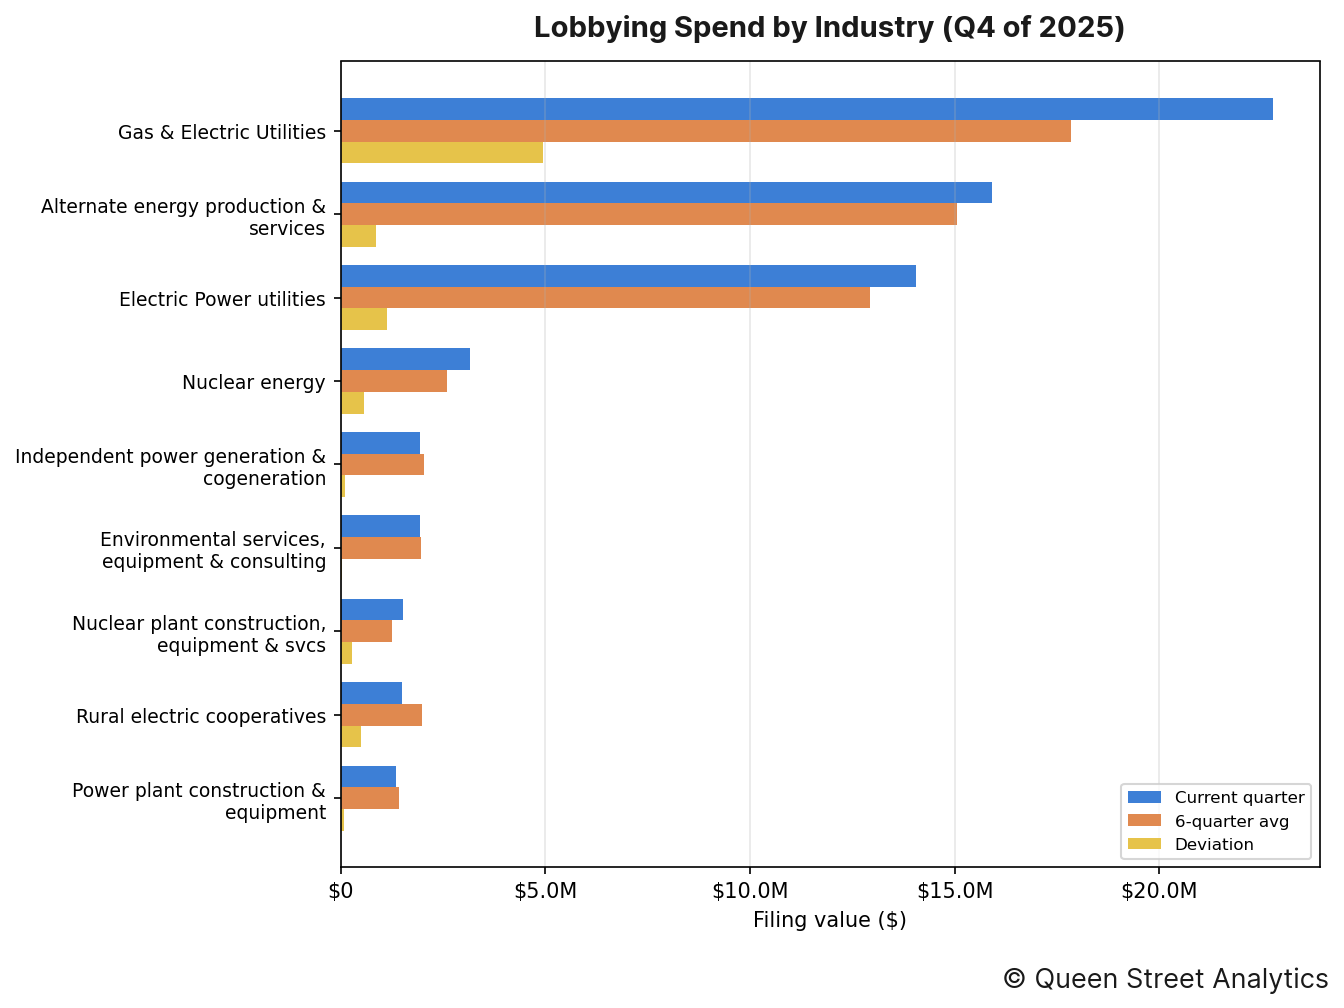
In Q4 of 2025, there was $63.8M worth of disclosed lobbying activity on Utilities & Power, 12% higher than the recent quarterly average of $57.1M. This activity can be broken down by industry as follows:
↳ There was $22.8M worth of Gas & Electric Utilities lobbying, 28% higher than the recent quarterly average of $17.8M.
↳ There was $15.6M worth of Alternate energy production & services lobbying, roughly in line with the recent quarterly average of $15.0M.
↳ There was $14.1M worth of Electric Power utilities lobbying, roughly in line with the recent quarterly average of $12.9M.
↳ There was $3.2M worth of Nuclear energy lobbying, 22% higher than the recent quarterly average of $2.6M.
↳ There was $1.9M worth of Independent power generation & cogeneration lobbying, roughly in line with the recent quarterly average of $2.0M.
↳ There was $1.9M worth of Environmental services, equipment & consulting lobbying, roughly in line with the recent quarterly average of $2.0M.
Section B: Lobbying Spend Trend
This channel's total disclosed lobbying spend across recent quarters, aggregated over all of its industries.
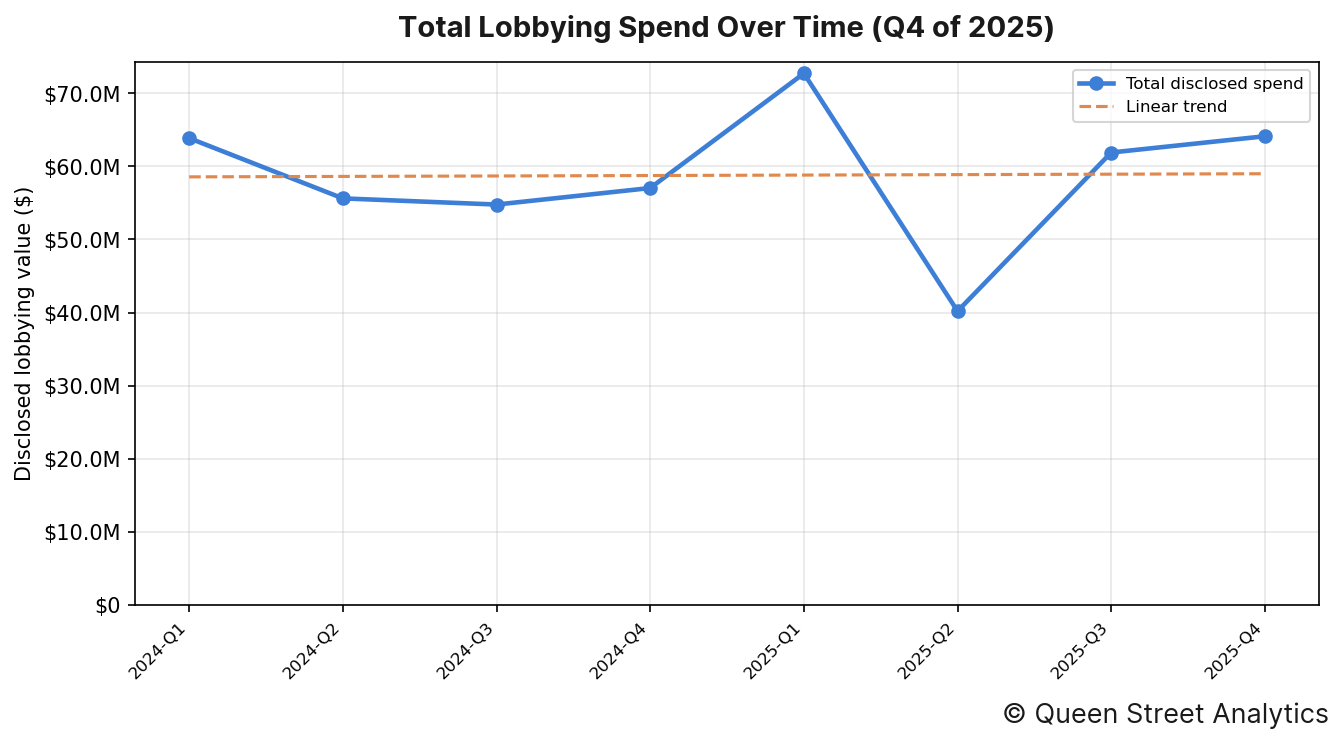
In Q4 of 2025, there was $63.8M worth of disclosed lobbying activity on Utilities & Power. Across the 8 quarters shown, the channel's total disclosed spend has held roughly steady over this period.
Organizations' Lobby Spend
The image below shows the organizations whose lobbying spend moved most from their six-quarter average.
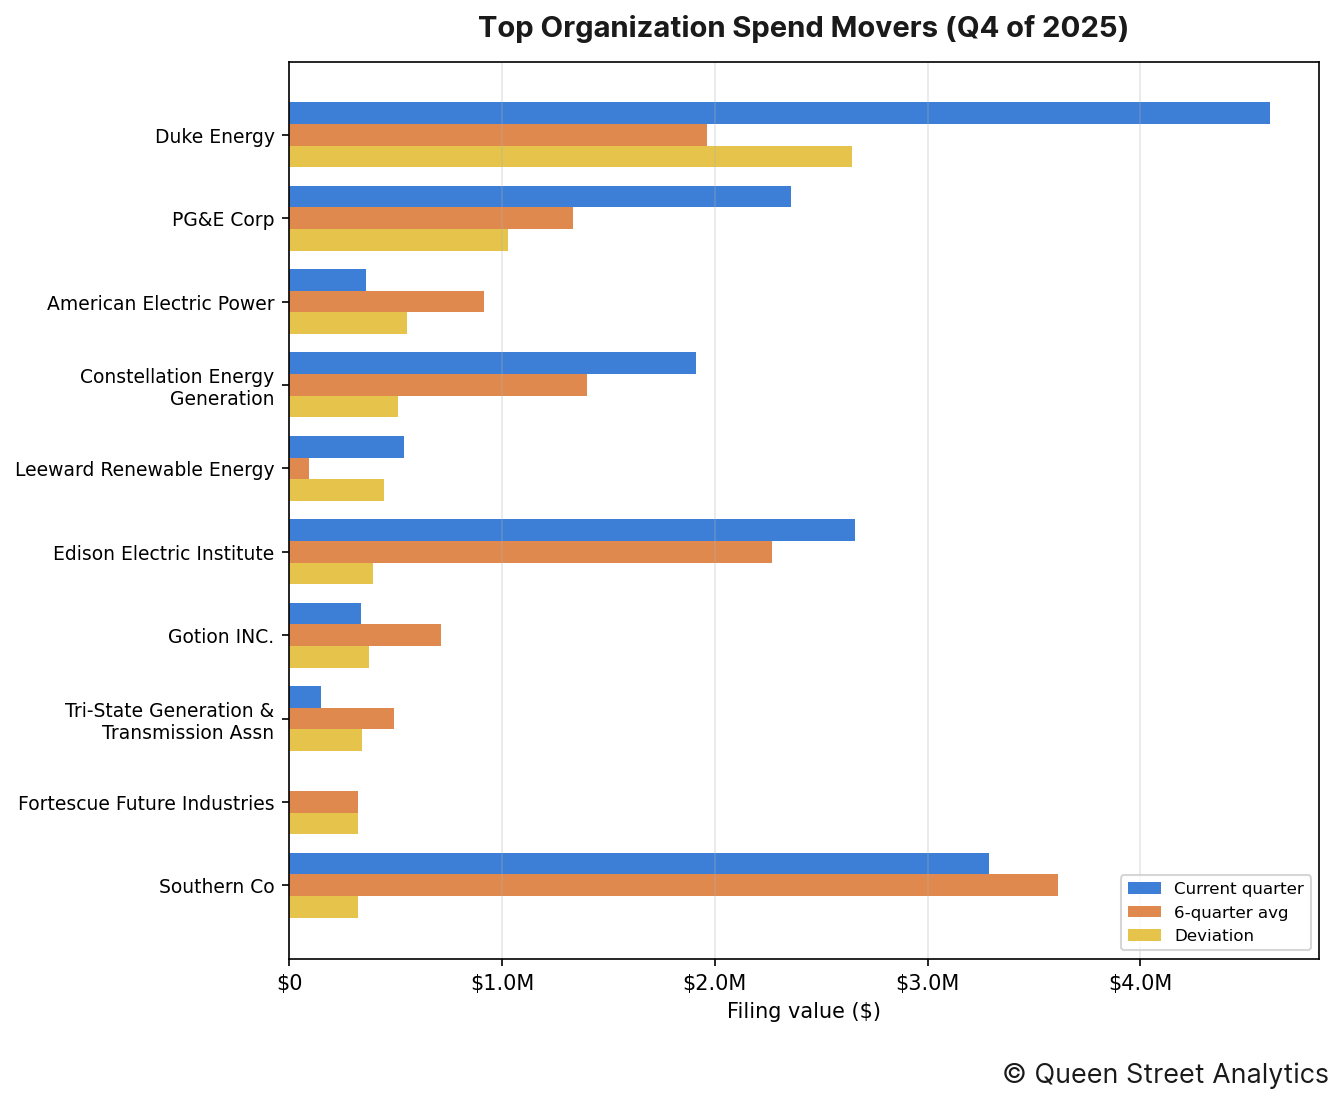
The organizations whose spending moved most from their own recent quarterly average were as follows:
↳ Duke Energy accounted for $4.6M in disclosed lobbying, 135% higher than the recent quarterly average of $2.0M.
↳ PG&E Corp accounted for $2.4M in disclosed lobbying, 77% higher than the recent quarterly average of $1.3M.
↳ American Electric Power accounted for $360k in disclosed lobbying, 61% lower than the recent quarterly average of $915k.
↳ Constellation Energy Generation accounted for $1.9M in disclosed lobbying, 36% higher than the recent quarterly average of $1.4M.
↳ Leeward Renewable Energy accounted for $540k in disclosed lobbying, 468% higher than the recent quarterly average of $95k.
↳ Edison Electric Institute accounted for $2.7M in disclosed lobbying, 17% higher than the recent quarterly average of $2.3M.
Section D: Government Entities Lobbied
This section documents this quarter's most lobbied federal government departments.
By industry
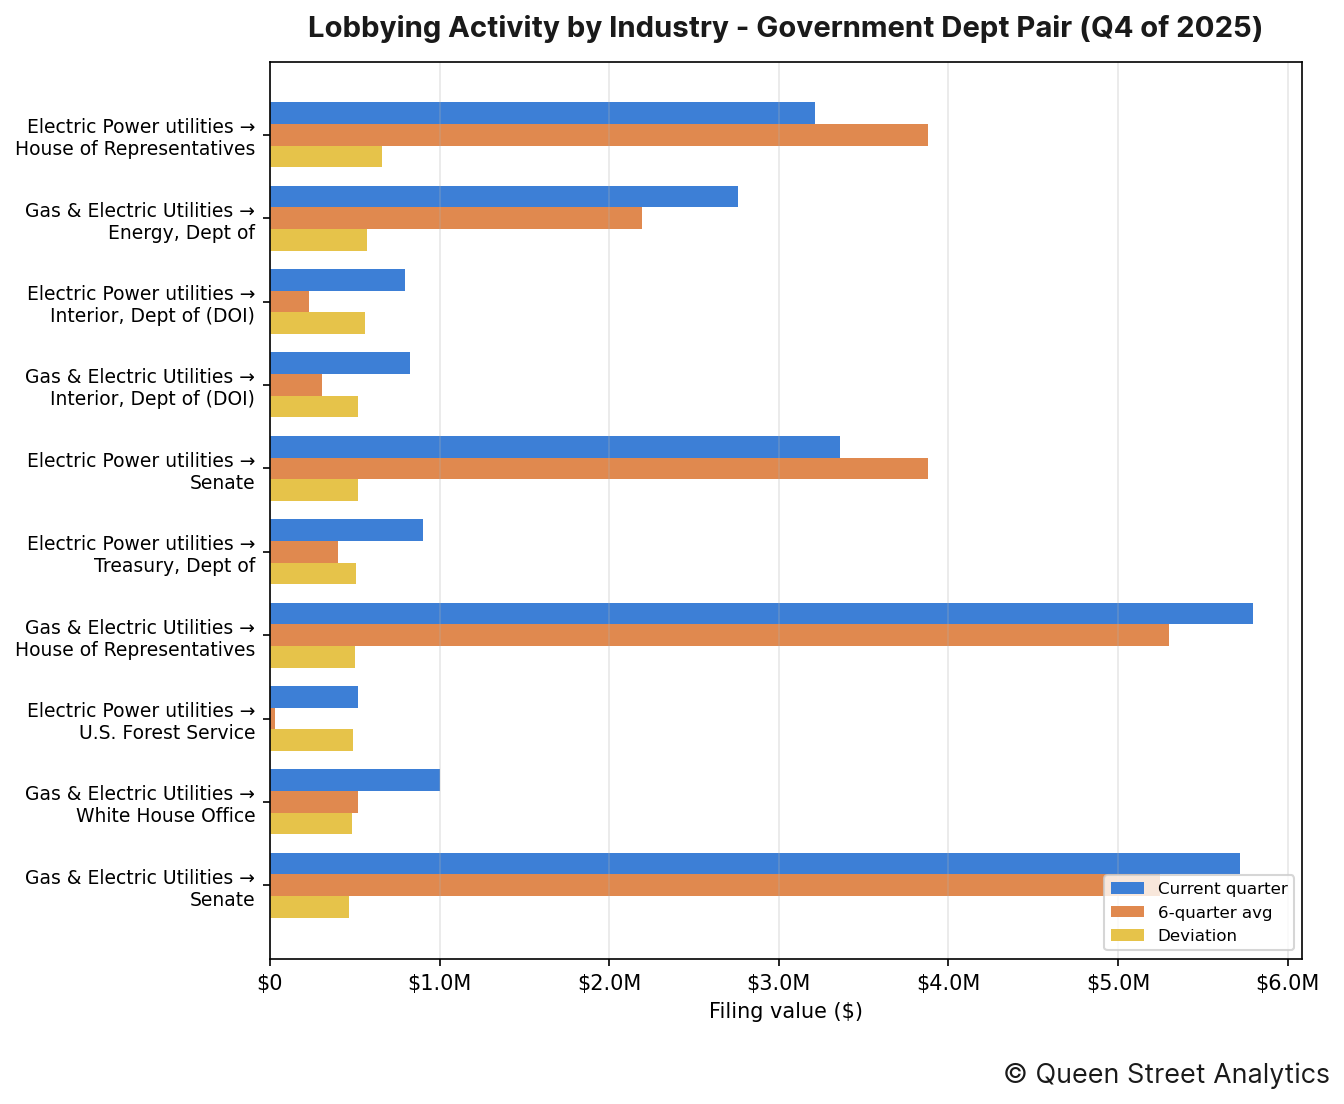
The industry–entity pairings that moved most this quarter were as follows:
↳ Electric Power utilities directed $3.2M of lobbying toward House of Representatives, 17% lower than the recent quarterly average of $3.9M.
↳ Gas & Electric Utilities directed $2.8M of lobbying toward Dept of Energy, 26% higher than the recent quarterly average of $2.2M.
↳ Electric Power utilities directed $794k of lobbying toward Dept of Interior (DOI), 242% higher than the recent quarterly average of $232k.
By organization
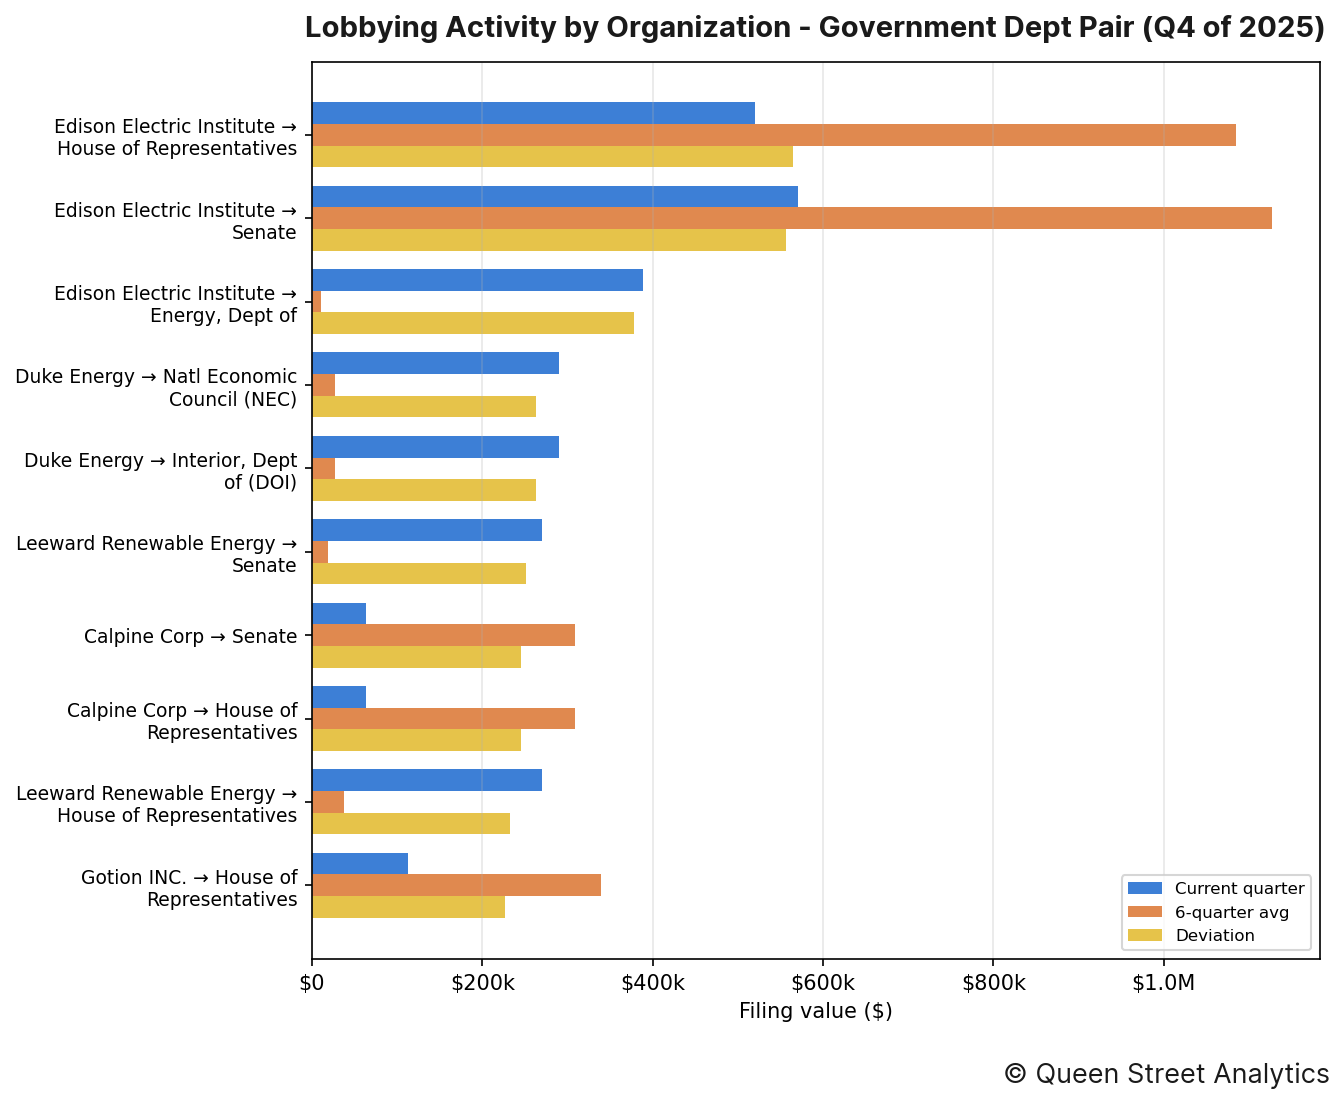
The organization–entity pairings that moved most this quarter were as follows:
↳ Edison Electric Institute directed $520k of lobbying toward House of Representatives, 52% lower than the recent quarterly average of $1.1M.
↳ Edison Electric Institute directed $570k of lobbying toward Senate, 49% lower than the recent quarterly average of $1.1M.
↳ Edison Electric Institute directed $388k of lobbying toward Dept of Energy, 3542% higher than the recent quarterly average of $11k.
Section E: Lobbying Issues
This section documents this quarter's most lobbied-on issues.
By industry
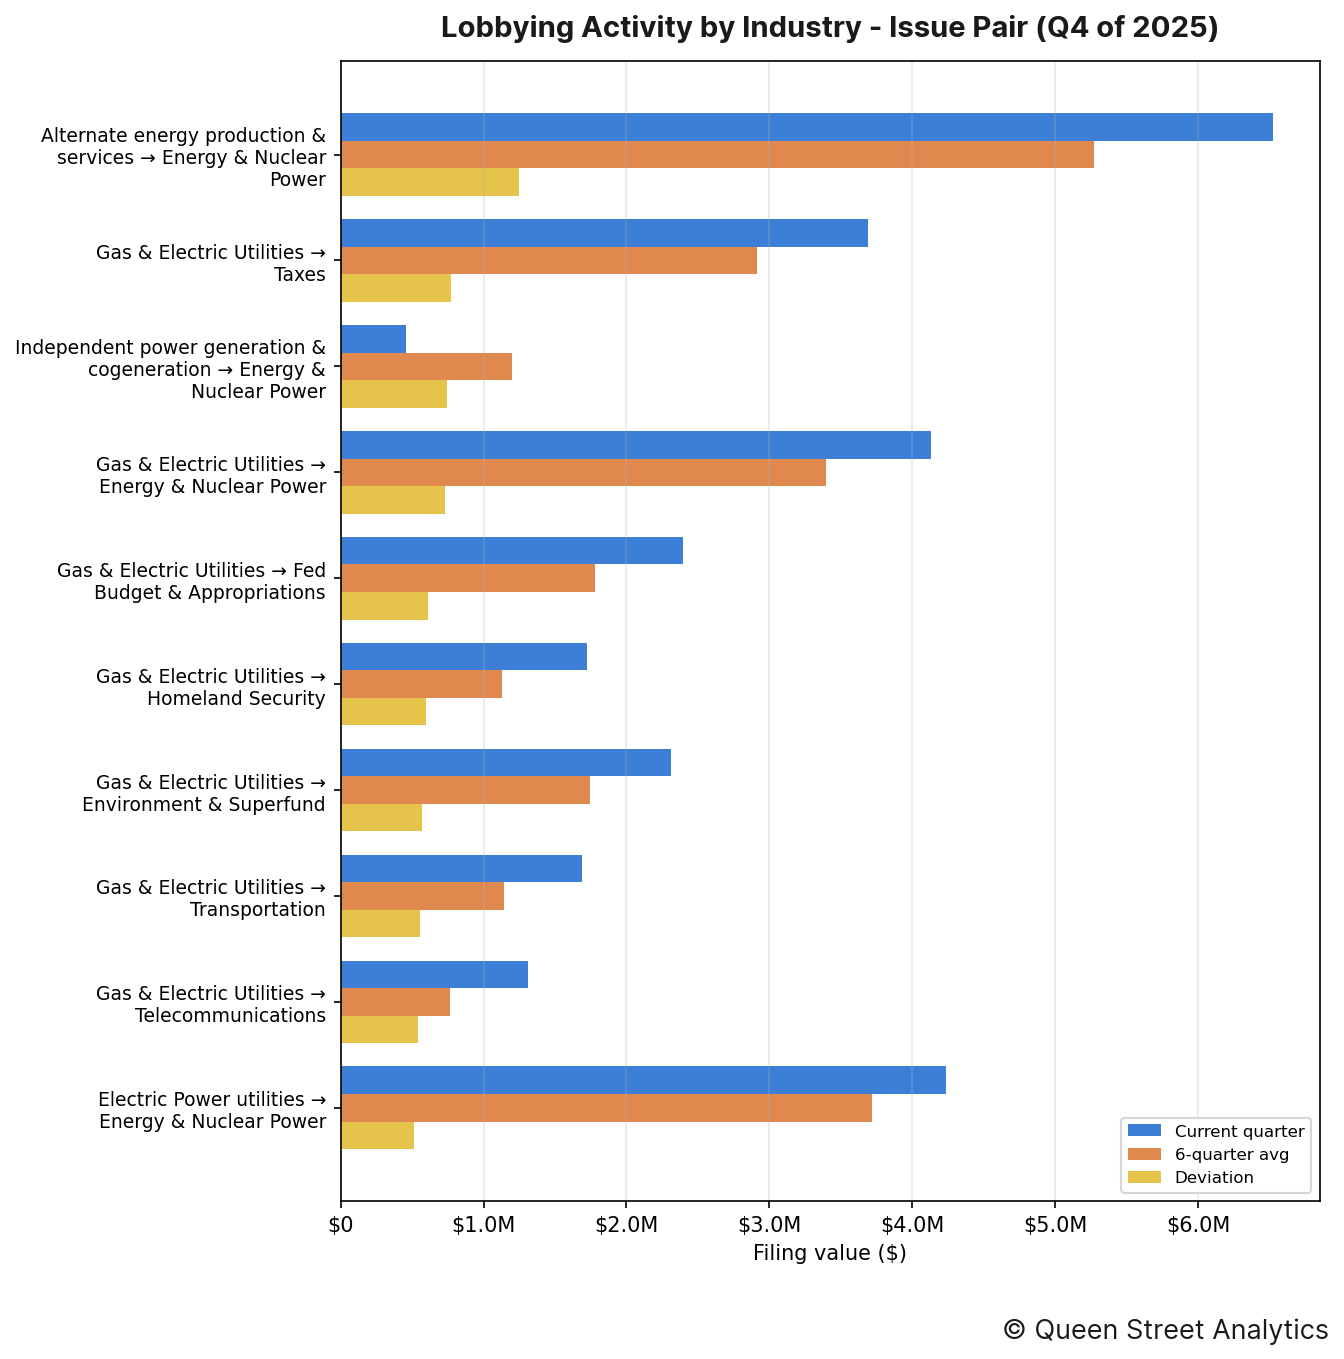
The industry–issue pairings that moved most this quarter were as follows:
↳ Alternate energy production & services put $6.5M toward lobbying on Energy & Nuclear Power, 24% higher than the recent quarterly average of $5.3M.
↳ Gas & Electric Utilities put $3.7M toward lobbying on Taxes, 27% higher than the recent quarterly average of $2.9M.
↳ Independent power generation & cogeneration put $458k toward lobbying on Energy & Nuclear Power, 62% lower than the recent quarterly average of $1.2M.
By organization
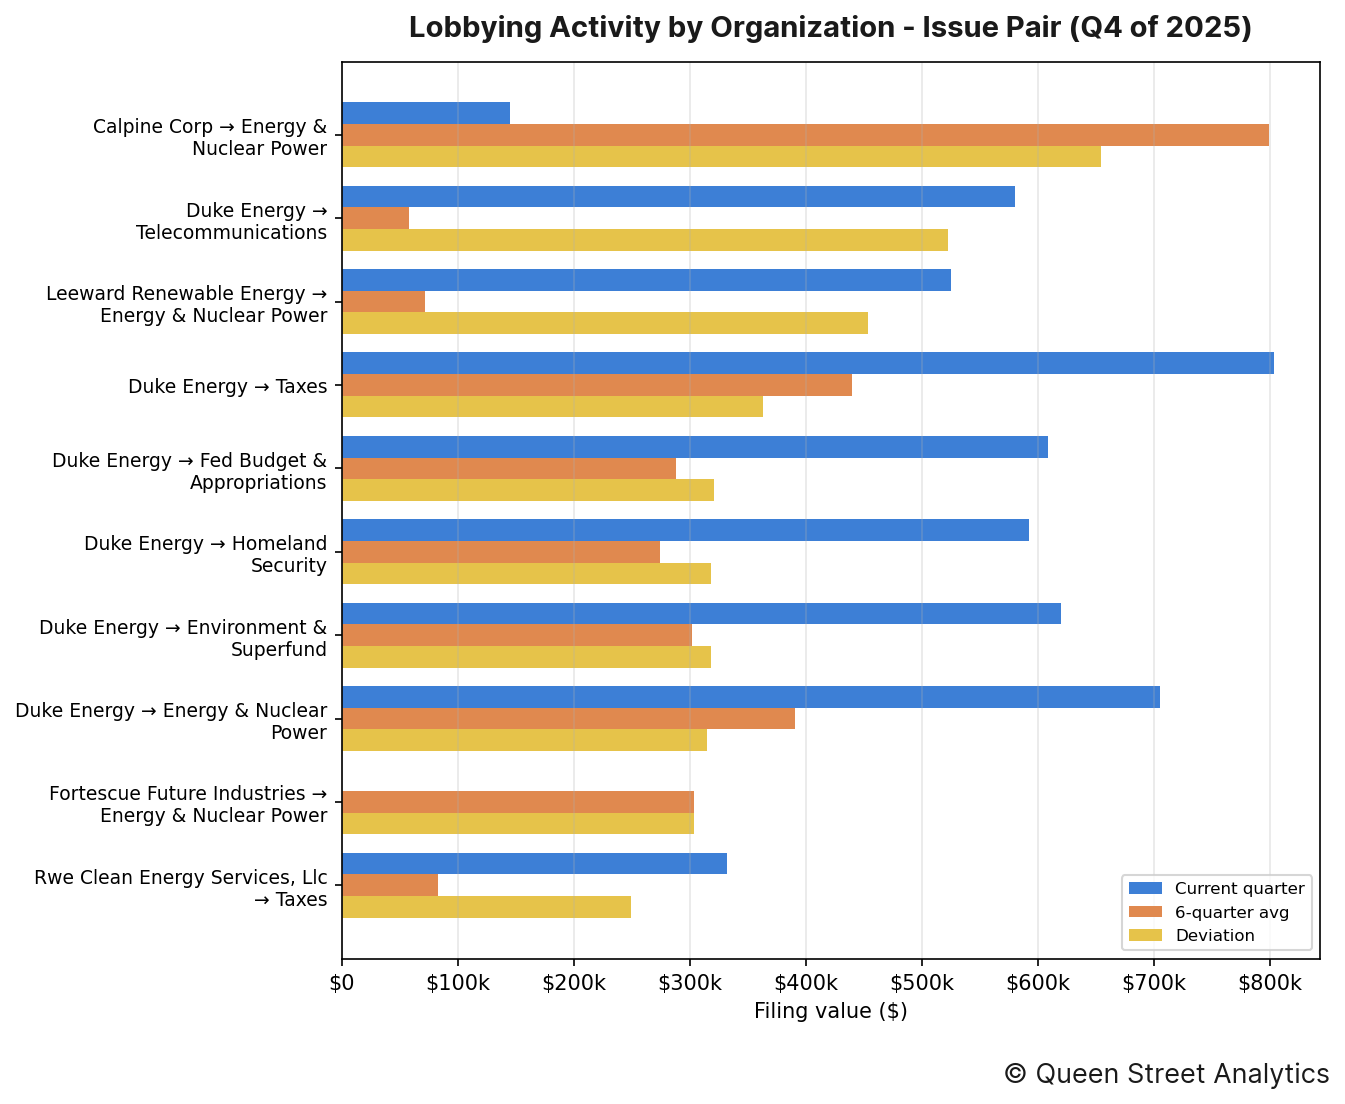
The organization–issue pairings that moved most this quarter were as follows:
↳ Calpine Corp put $145k toward lobbying on Energy & Nuclear Power, 82% lower than the recent quarterly average of $799k.
↳ Duke Energy put $580k toward lobbying on Telecommunications, 907% higher than the recent quarterly average of $58k.
↳ Leeward Renewable Energy put $525k toward lobbying on Energy & Nuclear Power, 633% higher than the recent quarterly average of $72k.
Section F: Most-Active Lobbyists
The figure below lists the lobbyists who managed the most imputed lobbying value this quarter, alongside their firm or organization. Because a filing's value is split evenly across the lobbyists it names, these dollar figures are imputed rather than directly disclosed.
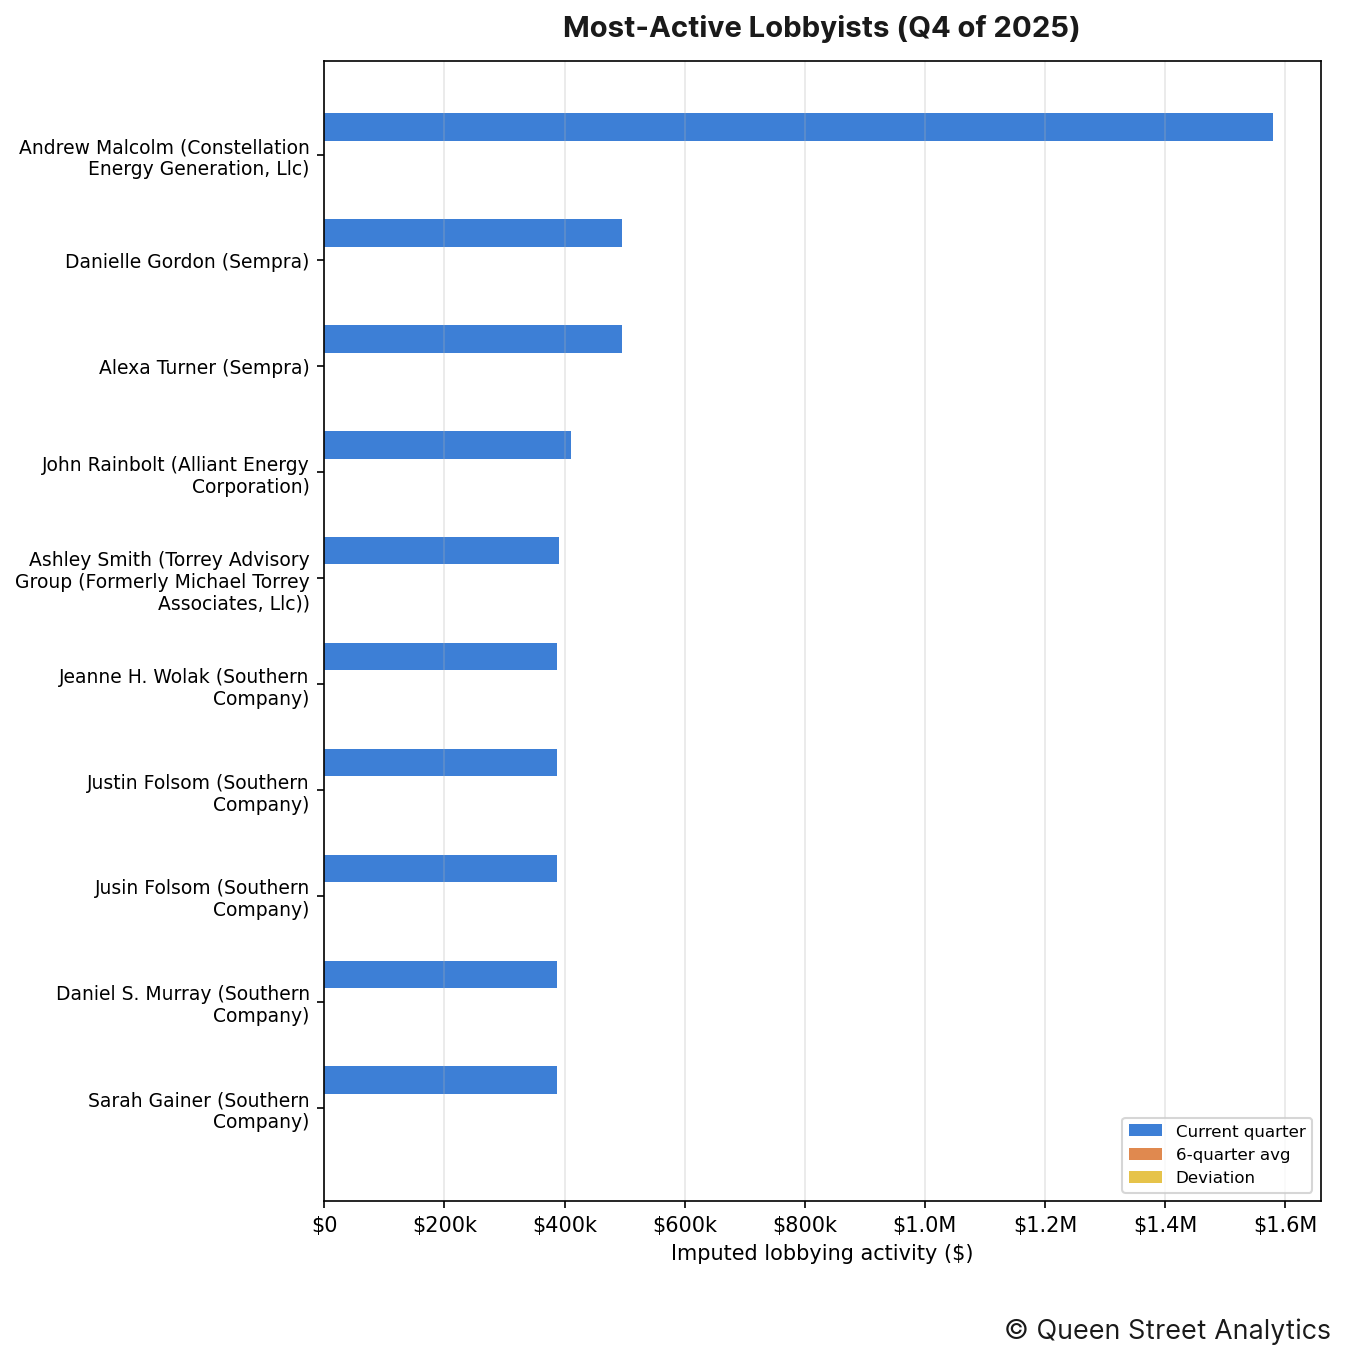
The lobbyists who managed the most imputed lobbying value this quarter were as follows:
↳ Andrew Malcolm (Constellation Energy Generation, Llc) was credited with an imputed $1.6M in lobbying activity.
↳ Danielle Gordon (Sempra) was credited with an imputed $495k in lobbying activity.
↳ Alexa Turner (Sempra) was credited with an imputed $495k in lobbying activity.
↳ John Rainbolt (Alliant Energy Corporation) was credited with an imputed $410k in lobbying activity.
↳ Ashley Smith (Torrey Advisory Group (Formerly Michael Torrey Associates, Llc)) was credited with an imputed $390k in lobbying activity.
Section G: Organization Network
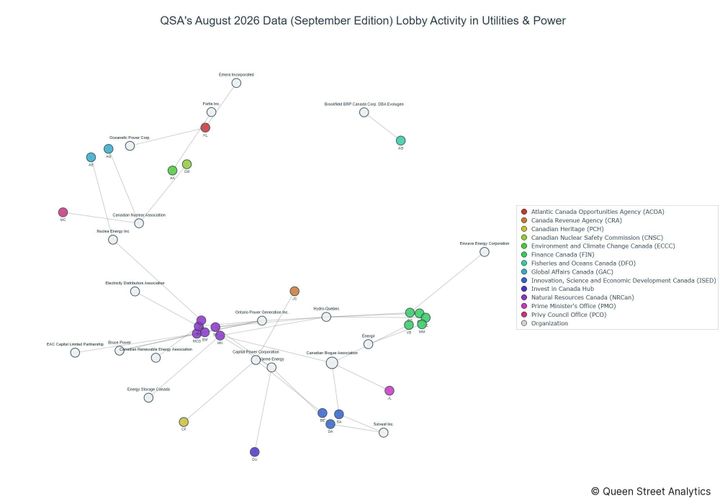
The header image for this edition maps how this channel's organizations (neutral nodes) connect to the federal entities they lobbied (colored nodes) this quarter. A link's weight is the filing value directed to that entity, and node size reflects total value; the House and Senate are excluded (nearly every organization lobbies them) so the specialized targets stand out.
The most widely lobbied entity this quarter was Dept of Energy, which was lobbied by 19 organizations.
Methodology
Every figure in this report starts from one number: the disclosed value of each lobbying filing, which we take as the income a registrant reported plus any in-house expenses (income + expenses) on its quarterly US Senate and House LDA disclosure. Before totalling anything we clean the filings — applying each amendment over the original it replaces, removing duplicates, and setting aside non-standard records such as registrations and terminations — and map every filing to a lobbying channel and industry using the organization's CRP industry code.
How the money is divided. A filing's full value counts once toward the organization that paid it and that organization's industry, so the industry and organization rankings (Sections A–C) reflect whole dollars. But a single filing usually names several government entities, several issue areas, and several lobbyists at once, and the disclosure never says how the fee was split among them. Rather than credit the full amount to each — which would count the same dollars over and over — we divide a filing's value evenly across the distinct items it names. So a $200,000 filing that lists four agencies contributes $50,000 to each in Section D, and the same even split is applied across issues in Section E and across lobbyists in Section F. That way every section's totals trace back to the same underlying money without double-counting.
Reading the movements. A “deviation” compares the quarter's value to the average of the prior six quarters, so a rise or fall is measured against an entity's own recent norm rather than against the rest of the field. Section B takes the wider view: it sums every industry into one channel total and plots it quarter by quarter, with a fitted line showing the overall direction of travel. Source: US Senate and House LDA disclosures.