USA Lobbying on Tribal Affairs - Washington (Q2 2026)





Tunica-Biloxi Tribe of Louisiana, Jicarilla Apache Nation, Southern Ute Indian Tribe, The Yavapai-apache Nation, Cook Inlet Region Incorporated, Twenty-nine Palms Band of Mission Indians were unusually active lobbyists this quarter.
View the interactive network in Queen Street Analytics →
Each quarter we track movements in US federal lobbying, channel by channel. This edition covers Tribal Affairs for Q2 of 2026, ranking the organizations, government entities, issues, and lobbyists whose disclosed spend moved most.
Central Themes in this Quarter’s Lobby Data
Legislation Aims to Clarify Tribal Trust Land Status
There has been a notable uptick in efforts to pass a 'Carcieri fix,' with multiple bills such as the Tribal Trust Land Reaffirmation Act seeking to resolve longstanding ambiguities around tribal trust lands. This legislative activity aligns with substantial lobbying by the Seminole Tribe of Florida and the Poarch Band of Creek Indians, who have engaged both the House of Representatives and the Senate on land-into-trust and land status issues, as well as by the Cow Creek Band of Umpqua Tribe of Indians, which has focused advocacy on these topics in both the Senate and House.
📎 The Tribal Trust Land Reaffirmation Act Introduced in the House, Aims ... · Unpacking the "Carcieri Fix" and What H.R. 5257 Means for Tribal ... · Huffman, Colleagues Introduce Legislation to Reaffirm Tribal Trust Land ...
Department of the Interior Prioritizes Tribal Land Restoration
Recent congressional testimony and agency statements suggest the Department of the Interior, which has recently engaged with the Seminole Tribe of Florida, the Cow Creek Band of Umpqua Tribe of Indians, and the Poarch Band of Creek Indians, is pushing for legislative changes to ensure equal treatment for all tribes in land-into-trust matters. This focus mirrors recent lobbying activity by groups such as the Confederated Tribes of the Umatilla Indian Reservation and the Coquille Indian Tribe, concerned with land status restoration and government contracting.
📎 Pending Legislation - U.S. Department of the Interior · Bill introduced to restore stability to tribal trust lands impacted by ...
Scrutiny Increases on Federal Management of Tribal Trust Funds
New federal reports and congressional issue briefs are re-examining agency oversight of tribal trust funds and natural resource contracts. This activity connects with heightened advocacy by tribes emphasizing fiduciary responsibilities and resource agreements.
📎 Federal Management of Tribal Trust Funds: Overview and Selected Issues ... · GAO-26-106626, FEDERAL LAND
AND WATER MANAGEMENT: Additional ...
federal-Tribal Shared Decision-Making, Water Settlements Expand Lobbying Focus
Recent GAO findings point to an increase in shared federal-tribal agreements and water settlements, exemplified by measures like the Northeastern Arizona Indian Water Rights Settlement Act. Related lobbying has targeted land, water, and new digital asset regulations impacting tribes.
📎 GAO-26-106626, FEDERAL LAND
AND WATER MANAGEMENT: Additional ... · 2026 Native Lands Sacred Places News Stories, Indian Law Bulletins ...
Rulemaking on Federal Aid Could Affect Tribal Contracting
A new OMB proposal aims to standardize requirements for federal grants and contracting, with tribal governments such as Santo Domingo Pueblo and the Confederated Tribes of the Umatilla Indian Reservation—both actively engaging with the House of Representatives and Senate—closely monitoring for implications in economic development and parity in contracting programs. Early reports indicate active tribal engagement as these rules are set for future fiscal years.
📎 The current federal landscape - Land Trust Alliance

Section A: Lobbying Spend by Industry
How much each industry in this channel spent on federal lobbying in Q2 of 2026, compared with its average over the prior six quarters.
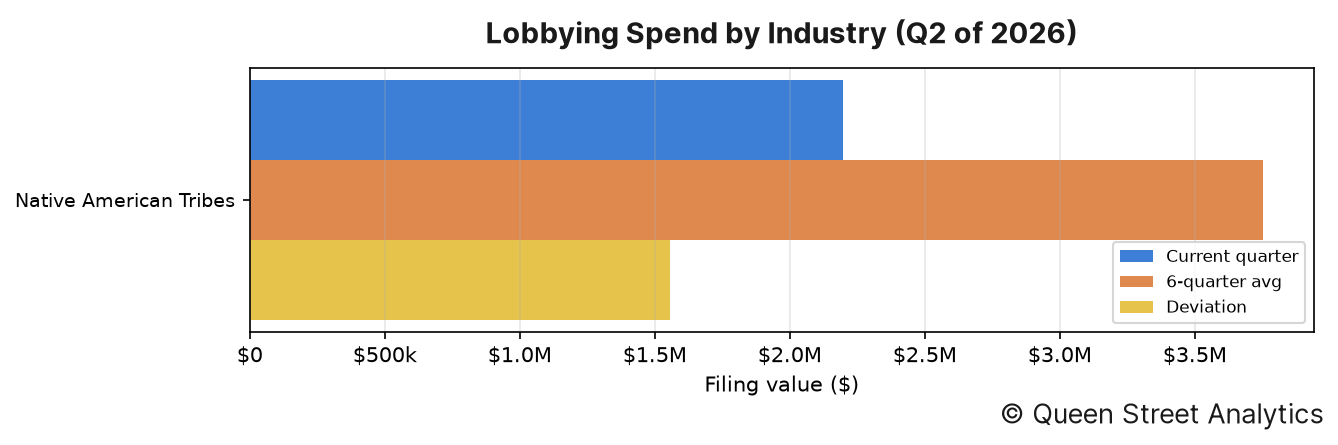
In Q2 of 2026, there was $2.2M worth of disclosed lobbying activity on Tribal Affairs, 41% lower than the recent quarterly average of $3.8M. This activity can be broken down by industry as follows:
↳ There was $2.2M worth of Native American Tribes lobbying, 41% lower than the recent quarterly average of $3.8M.
Section B: Lobbying Spend Trend
This channel's total disclosed lobbying spend across recent quarters, aggregated over all of its industries.
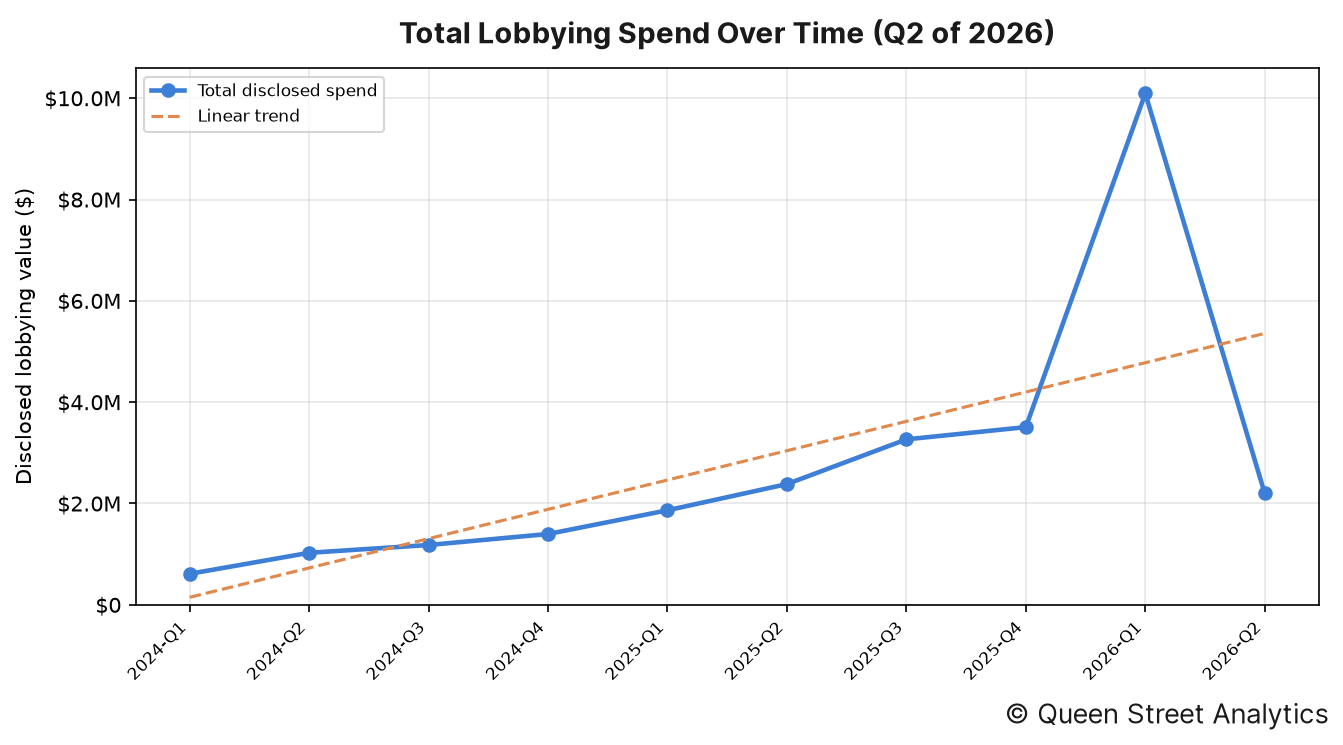
In Q2 of 2026, there was $2.2M worth of disclosed lobbying activity on Tribal Affairs. Across the 10 quarters shown, the channel's total disclosed spend has risen over this period.
Organizations' Lobby Spend
The image below shows the organizations whose lobbying spend moved most from their six-quarter average.
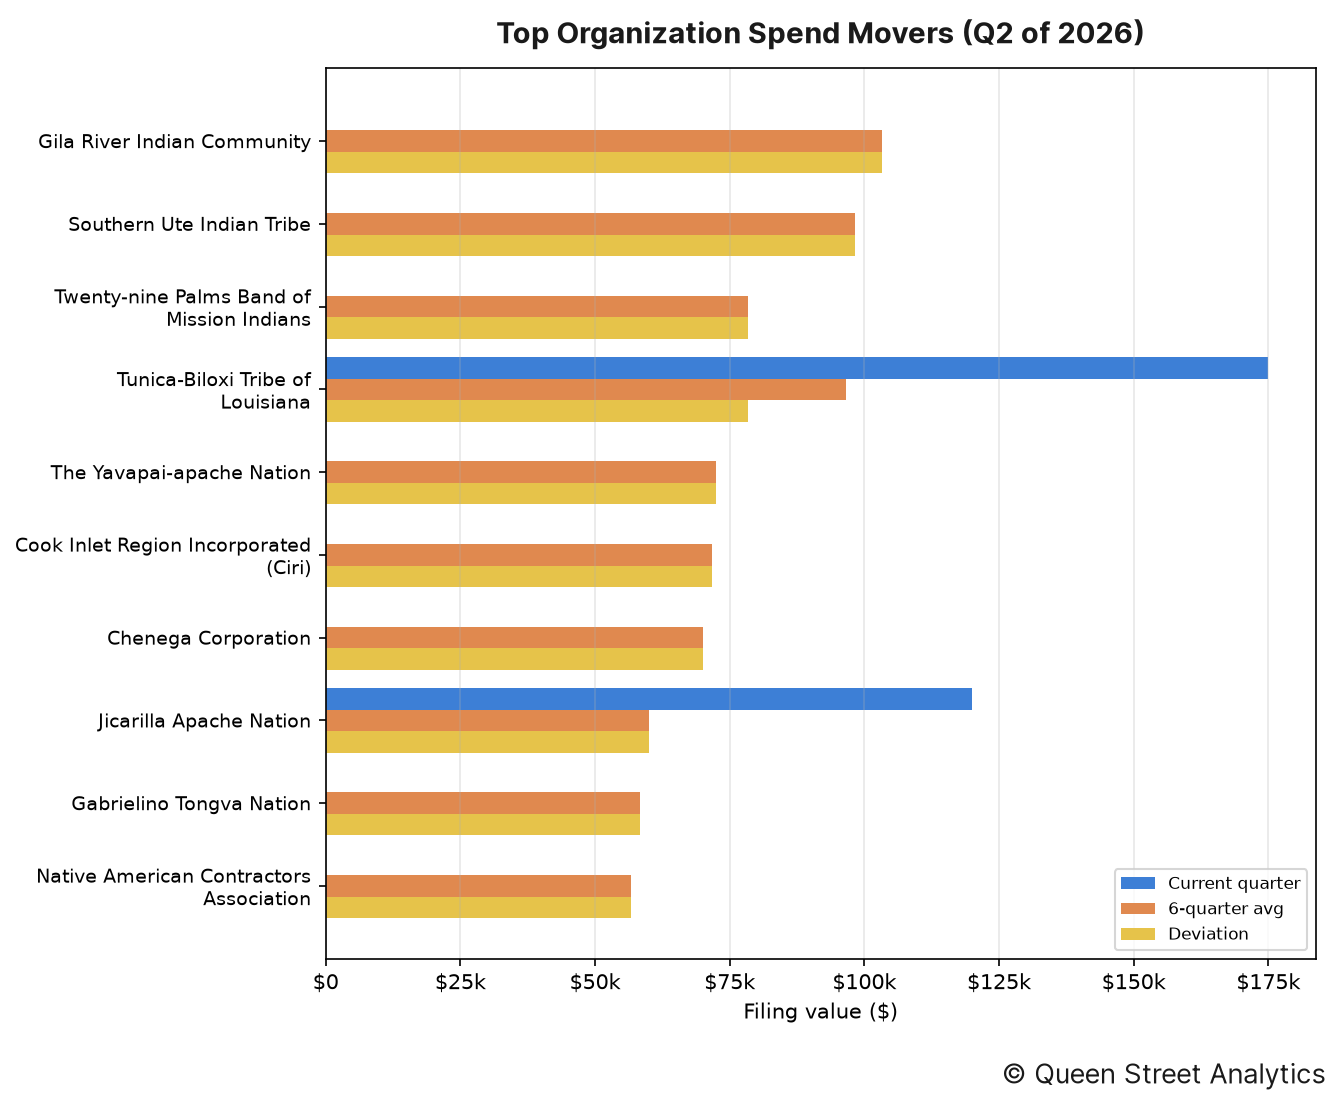
The organizations whose spending moved most from their own recent quarterly average were as follows:
↳ Gila River Indian Community accounted for $0 in disclosed lobbying, 100% lower than the recent quarterly average of $103k.
↳ Southern Ute Indian Tribe accounted for $0 in disclosed lobbying, 100% lower than the recent quarterly average of $98k.
↳ Twenty-nine Palms Band of Mission Indians accounted for $0 in disclosed lobbying, 100% lower than the recent quarterly average of $78k.
↳ Tunica-Biloxi Tribe of Louisiana accounted for $175k in disclosed lobbying, 81% higher than the recent quarterly average of $97k.
↳ The Yavapai-apache Nation accounted for $0 in disclosed lobbying, 100% lower than the recent quarterly average of $72k.
↳ Cook Inlet Region Incorporated (Ciri) accounted for $0 in disclosed lobbying, 100% lower than the recent quarterly average of $72k.
Section D: Government Entities Lobbied
This section documents this quarter's most lobbied federal government departments.
By industry
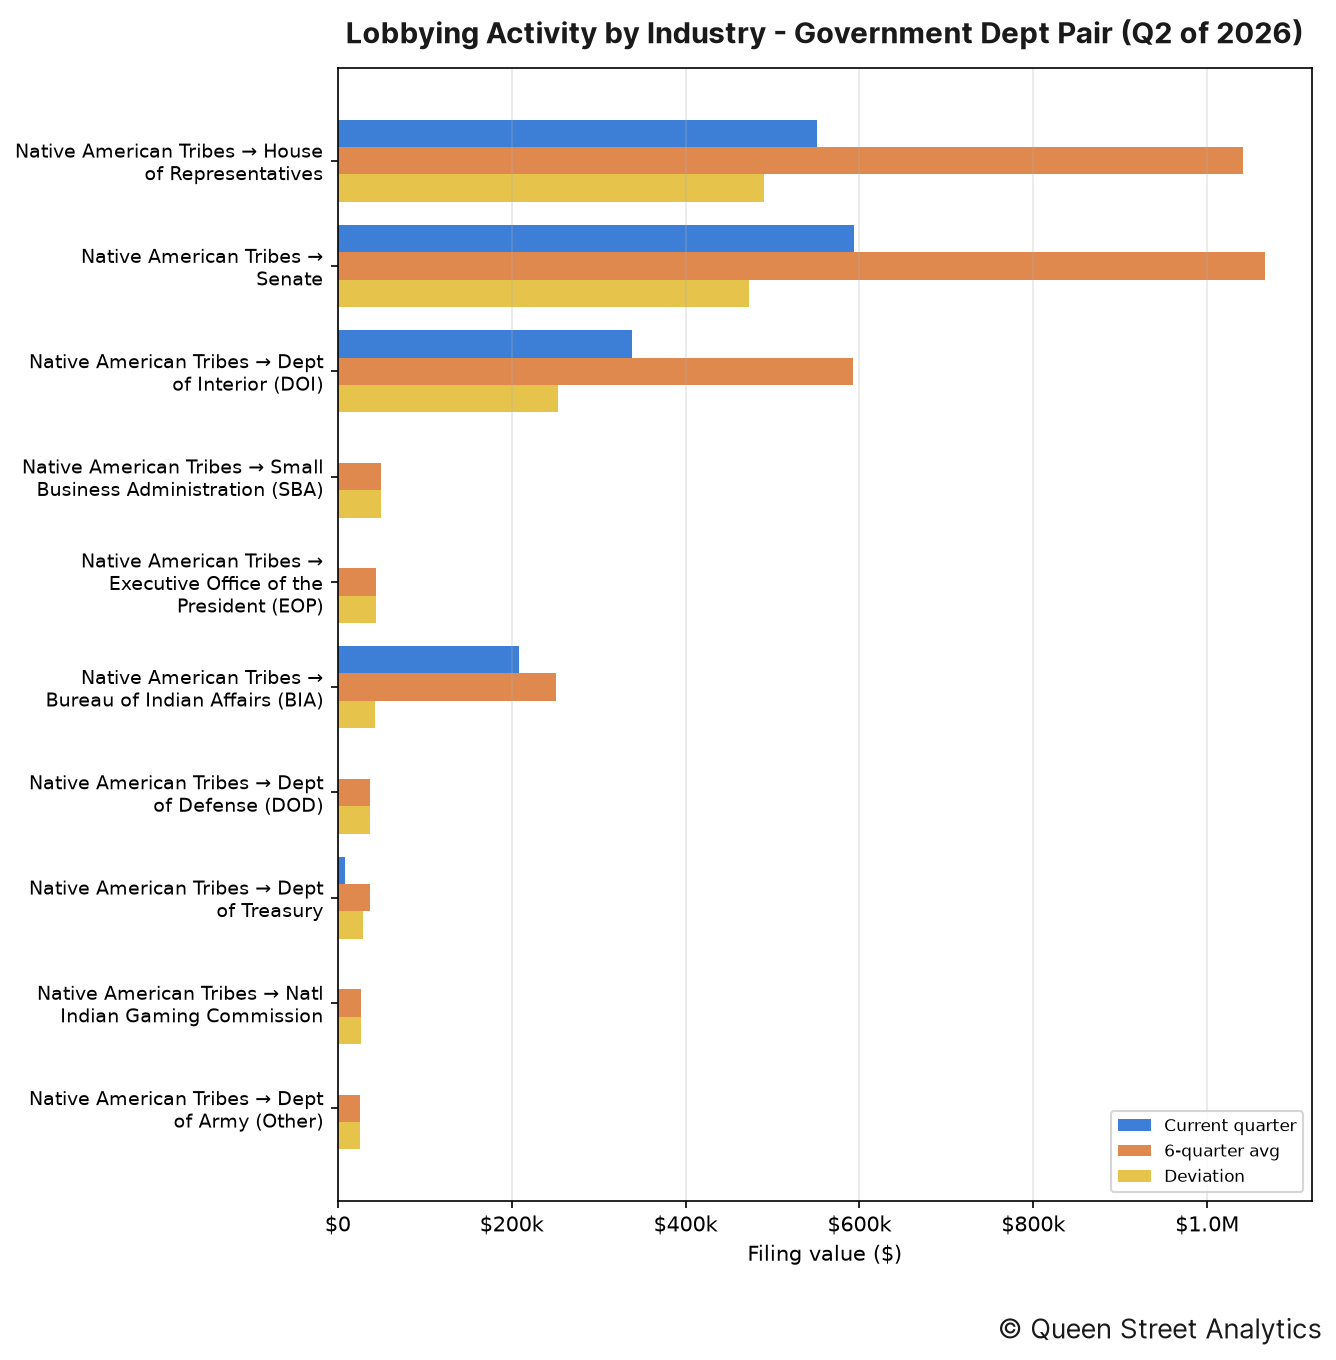
The industry–entity pairings that moved most this quarter were as follows:
↳ Native American Tribes directed $551k of lobbying toward House of Representatives, 47% lower than the recent quarterly average of $1.0M.
↳ Native American Tribes directed $594k of lobbying toward Senate, 44% lower than the recent quarterly average of $1.1M.
↳ Native American Tribes directed $339k of lobbying toward Dept of Interior (DOI), 43% lower than the recent quarterly average of $592k.
By organization
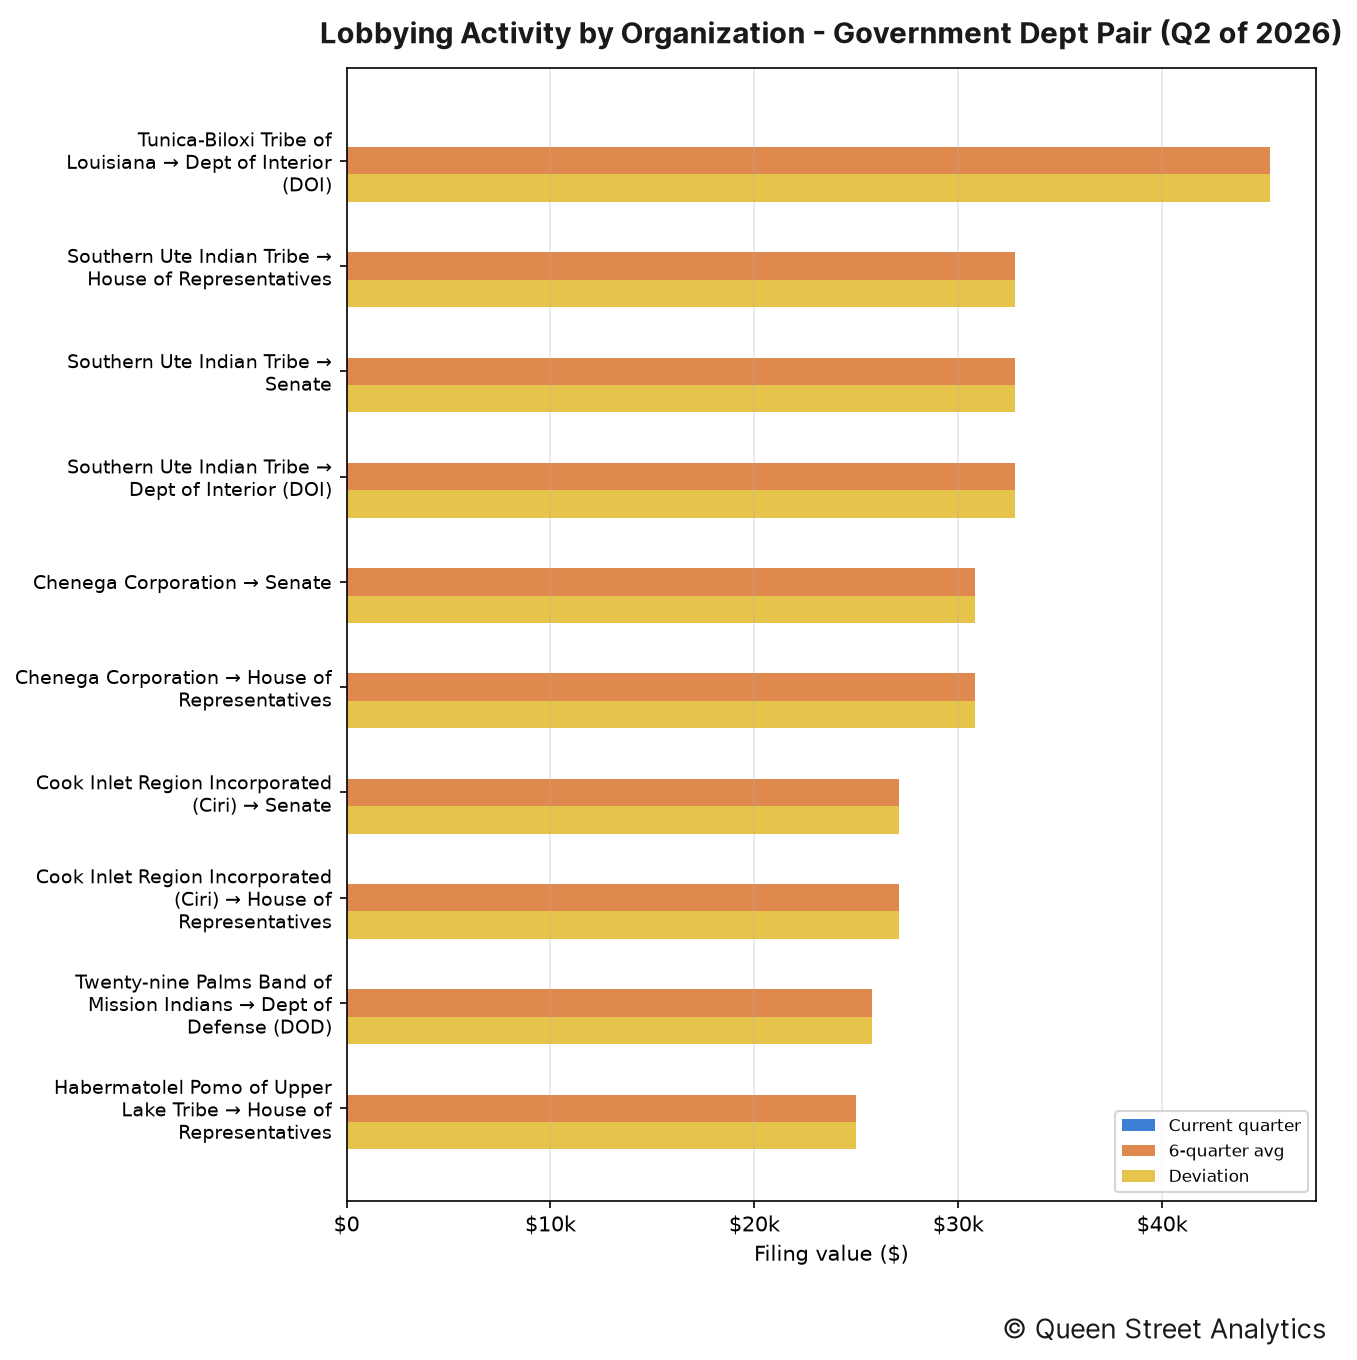
The organization–entity pairings that moved most this quarter were as follows:
↳ Tunica-Biloxi Tribe of Louisiana directed $0 of lobbying toward Dept of Interior (DOI), 100% lower than the recent quarterly average of $45k.
↳ Southern Ute Indian Tribe directed $0 of lobbying toward House of Representatives, 100% lower than the recent quarterly average of $33k.
↳ Southern Ute Indian Tribe directed $0 of lobbying toward Senate, 100% lower than the recent quarterly average of $33k.
Section E: Lobbying Issues
This section documents this quarter's most lobbied-on issues.
By industry
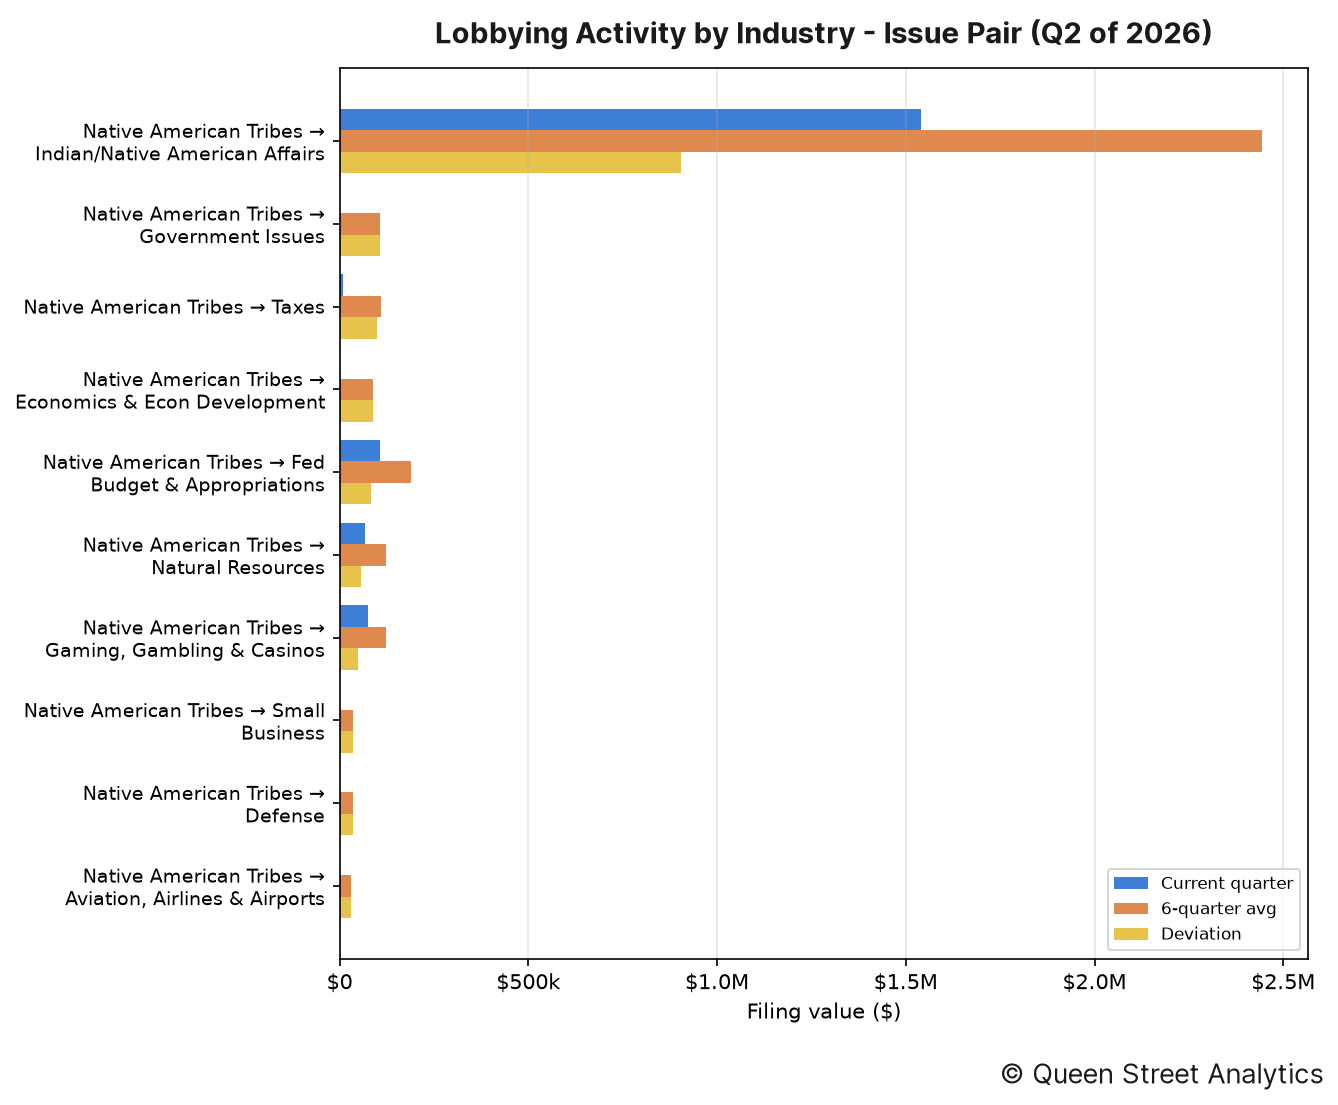
The industry–issue pairings that moved most this quarter were as follows:
↳ Native American Tribes put $1.5M toward lobbying on Indian/Native American Affairs, 37% lower than the recent quarterly average of $2.4M.
↳ Native American Tribes put $0 toward lobbying on Government Issues, 100% lower than the recent quarterly average of $107k.
↳ Native American Tribes put $10k toward lobbying on Taxes, 91% lower than the recent quarterly average of $109k.
By organization
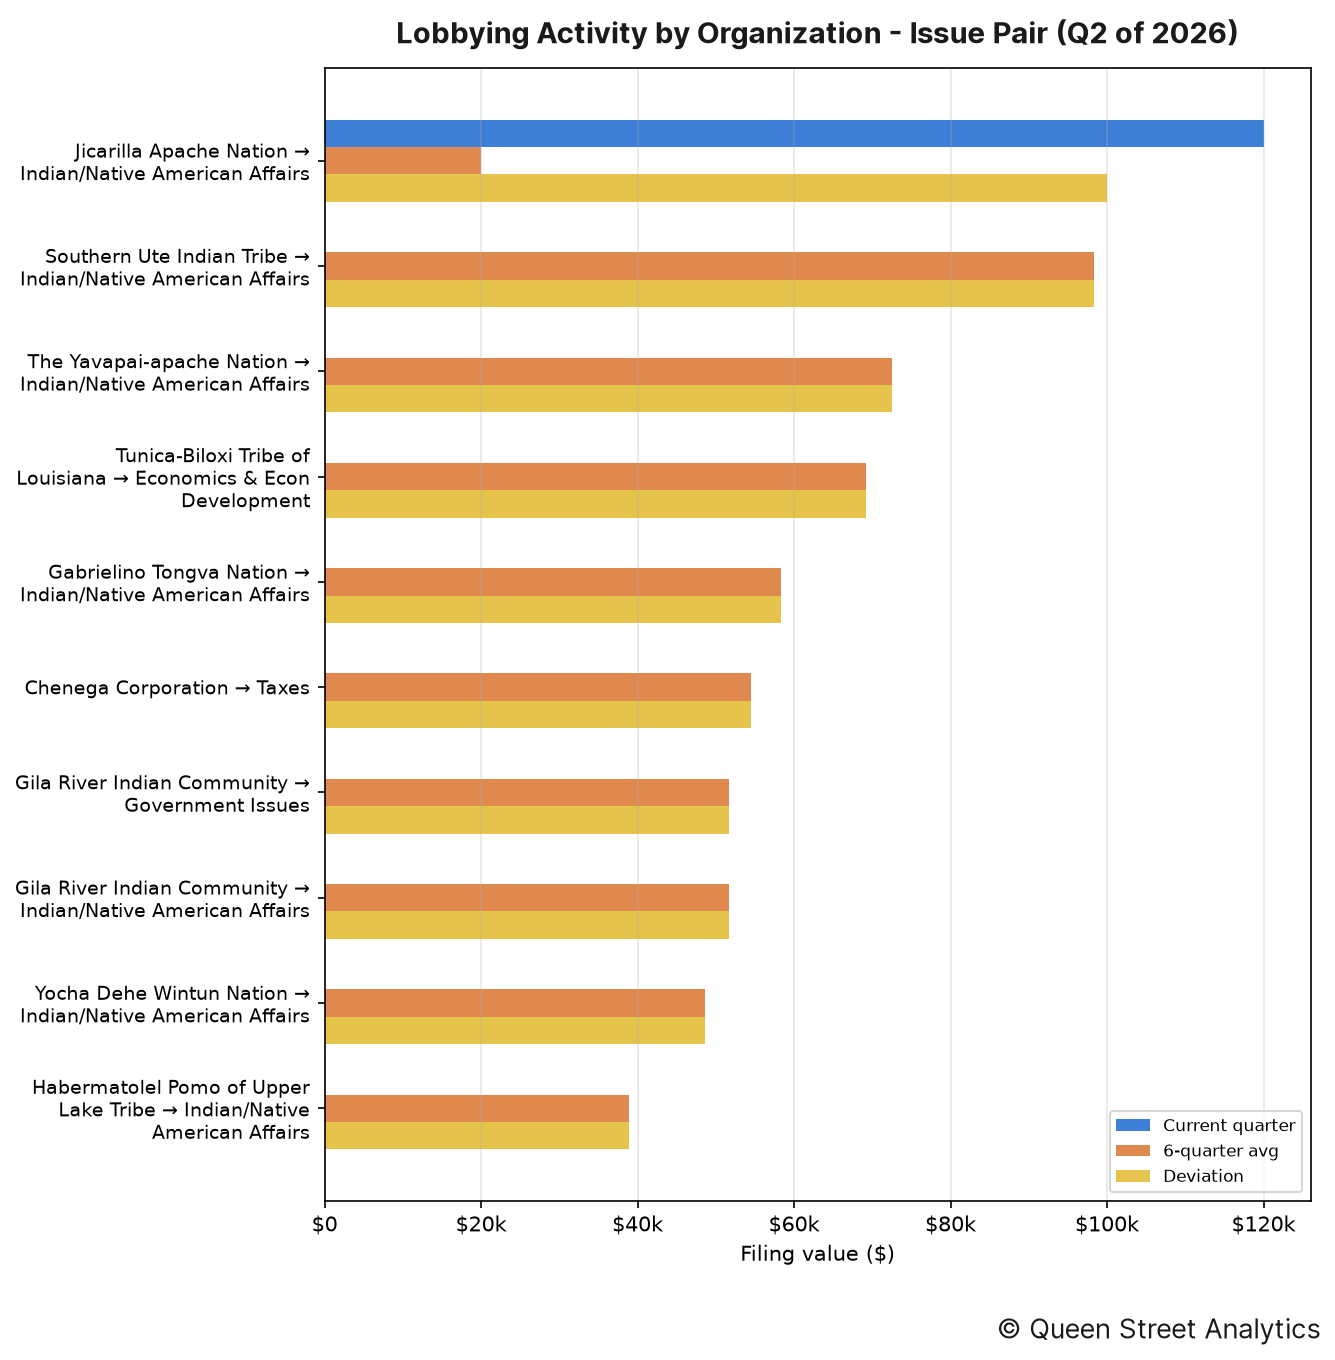
The organization–issue pairings that moved most this quarter were as follows:
↳ Jicarilla Apache Nation put $120k toward lobbying on Indian/Native American Affairs, 500% higher than the recent quarterly average of $20k.
↳ Southern Ute Indian Tribe put $0 toward lobbying on Indian/Native American Affairs, 100% lower than the recent quarterly average of $98k.
↳ The Yavapai-apache Nation put $0 toward lobbying on Indian/Native American Affairs, 100% lower than the recent quarterly average of $72k.
Section F: Most-Active Lobbyists
The figure below lists the lobbyists who managed the most imputed lobbying value this quarter, alongside their firm or organization. Because a filing's value is split evenly across the lobbyists it names, these dollar figures are imputed rather than directly disclosed.
No lobbyist activity to report this quarter.
Section G: Organization Network
The header image for this edition maps how this channel's organizations (neutral nodes) connect to the federal entities they lobbied (colored nodes) this quarter. A link's weight is the filing value directed to that entity, and node size reflects total value; the House and Senate are excluded (nearly every organization lobbies them) so the specialized targets stand out.
The most widely lobbied entity this quarter was Dept of Interior (DOI), which was lobbied by 16 organizations.
Methodology
Every figure in this report starts from one number: the disclosed value of each lobbying filing, which we take as the income a registrant reported plus any in-house expenses (income + expenses) on its quarterly US Senate and House LDA disclosure. Before totalling anything we clean the filings — applying each amendment over the original it replaces, removing duplicates, and setting aside non-standard records such as registrations and terminations — and map every filing to a lobbying channel and industry using the organization's CRP industry code.
How the money is divided. A filing's full value counts once toward the organization that paid it and that organization's industry, so the industry and organization rankings (Sections A–C) reflect whole dollars. But a single filing usually names several government entities, several issue areas, and several lobbyists at once, and the disclosure never says how the fee was split among them. Rather than credit the full amount to each — which would count the same dollars over and over — we divide a filing's value evenly across the distinct items it names. So a $200,000 filing that lists four agencies contributes $50,000 to each in Section D, and the same even split is applied across issues in Section E and across lobbyists in Section F. That way every section's totals trace back to the same underlying money without double-counting.
Reading the movements. A “deviation” compares the quarter's value to the average of the prior six quarters, so a rise or fall is measured against an entity's own recent norm rather than against the rest of the field. Section B takes the wider view: it sums every industry into one channel total and plots it quarter by quarter, with a fitted line showing the overall direction of travel. Source: US Senate and House LDA disclosures.


