USA Lobbying on Oil & Gas - Washington (Q2 2026)





Koch Industries Public Sector, American Petroleum Institute, ConocoPhillips, Occidental Petroleum, Williams Companies, and Cheniere Energy were unusually active lobbyists this quarter.
View the interactive network in Queen Street Analytics →
Each quarter we track movements in US federal lobbying, channel by channel. This edition covers Oil & Gas for Q2 of 2026, ranking the organizations, government entities, issues, and lobbyists whose disclosed spend moved most.
Central Themes in this Quarter’s Lobby Data
EPA Regulatory Relief Spurs Industry Advocacy
The EPA's finalized rule easing compliance for oil and natural gas operations in April 2026, following industry petitions, has prompted new regulatory focus and increased lobbying around appropriations and environmental exemptions, with organizations such as the Independent Petroleum Assn of America and the American Petroleum Institute directing advocacy toward the Environmental Protection Agency (EPA), the House of Representatives, and the Department of Energy. The rule is expected to save the sector billions and coincided with notable Q2 advocacy efforts targeting federal policy. Independent coverage underscores the link between policy relaxation and intensified lobbying activity.
📎 2026 Final Rule to Reduce Burden on the Oil and Natural Gas Industry · 2026 Oil and Gas Industry Outlook | Deloitte Insights
Middle East Crisis Elevates Oil Prices and Legislative Focus
Tensions and disruptions in the Strait of Hormuz saw oil prices reach four-year highs during Q2, instigating market volatility that coincided with an uptick in Washington lobbying by the American Petroleum Institute with the Department of Energy, the House of Representatives, and the Environmental Protection Agency on international trade, permits, and supply chain issues. Stakeholders, including Baker Hughes Company in its outreach to the International Trade Administration, responded to geopolitical risks and spikes in energy prices by ramping up engagement with lawmakers and regulatory agencies. Multiple industry reports detail the sector’s reactions to these developments.
📎 Oil and Gas Price Trends: Q2 2026 Review and Forecast · Oil & Gas News Home | RIGZONE
Earnings Boom Fuels Fiscal Advocacy Push
The energy sector’s dramatic earnings surge—reporting over 120% growth and strong margins in Q2—supported intensified lobbying by Exxon Mobil Corporation and the Independent Petroleum Assn of America, both of which engaged entities such as the House of Representatives and the Senate, aimed at shaping tax, budget, and regulatory policies. Sub-industries such as refining posted particularly strong results, which may have motivated focused calls for fiscal reforms and environmental exemptions by groups interfacing with the Environmental Protection Agency and the Office of Management & Budget. Independent analyses corroborate the sector’s favorable financial environment and concurrent advocacy efforts.
📎 S&P 500 Energy Sector Earnings Preview: Q2 2026 · Energy Sector Earnings Surge 102% In Q2 2026 As Oil Holds Above $90 · Oil and gas expansion gains momentum; outlooks improve but cost ...
Lobbying Targets Permitting and Grid Reforms
Q2 advocacy efforts intensified as Congress weighed major bills on permitting and energy infrastructure, drawing significant activity from key industry groups such as the American Petroleum Institute and Washington Gas Light Co, intent on influencing regulatory frameworks through targeted engagement with the Department of Energy, the House of Representatives, and the Environmental Protection Agency. While legislative trackers confirm active debate on grid and environmental reforms, the exact lobbying priorities reflect strategic responses to pending policy changes. The connection between sector policy developments and legislative engagement is suggested by industry trend reports.
📎 Oil and gas expansion gains momentum; outlooks improve but cost ...
Trade and Appropriations Dominate Top Movers’ Agenda
Major clients like Koch Industries and the American Petroleum Institute dramatically increased lobbying spend during Q2, targeting Congress, the White House, and trade agencies such as the House of Representatives, the Senate, and the Executive Office of the President on issues ranging from budget appropriations to international energy trade. Their filings reveal a focus on appropriations and trade policy, but no verified sources directly corroborate the specifics of these lobbying efforts.
📎 KOCH GOVERNMENT AFFAIRS, LLC (FKA KOCH COMPANIES PUBLIC SECTOR, LLC)

Section A: Lobbying Spend by Industry
How much each industry in this channel spent on federal lobbying in Q2 of 2026, compared with its average over the prior six quarters.
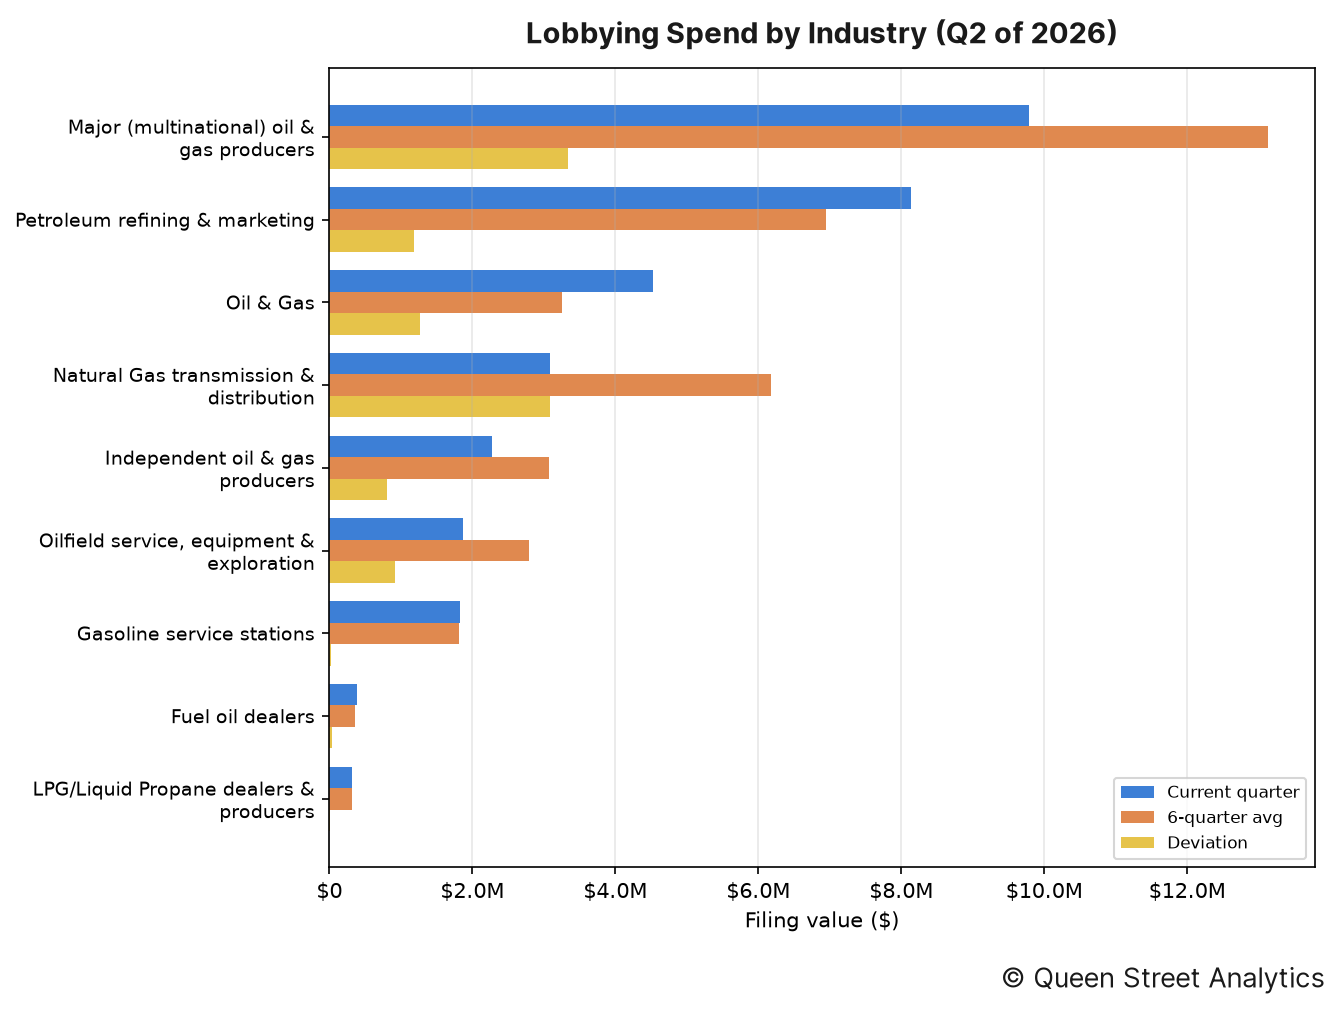
In Q2 of 2026, there was $32.2M worth of disclosed lobbying activity on Oil & Gas, 15% lower than the recent quarterly average of $37.8M. This activity can be broken down by industry as follows:
↳ There was $9.8M worth of Major (multinational) oil & gas producers lobbying, 25% lower than the recent quarterly average of $13.1M.
↳ There was $8.1M worth of Petroleum refining & marketing lobbying, 17% higher than the recent quarterly average of $6.9M.
↳ There was $4.5M worth of Oil & Gas lobbying, 39% higher than the recent quarterly average of $3.3M.
↳ There was $3.1M worth of Natural Gas transmission & distribution lobbying, 50% lower than the recent quarterly average of $6.2M.
↳ There was $2.3M worth of Independent oil & gas producers lobbying, 26% lower than the recent quarterly average of $3.1M.
↳ There was $1.9M worth of Oilfield service, equipment & exploration lobbying, 33% lower than the recent quarterly average of $2.8M.
Section B: Lobbying Spend Trend
This channel's total disclosed lobbying spend across recent quarters, aggregated over all of its industries.
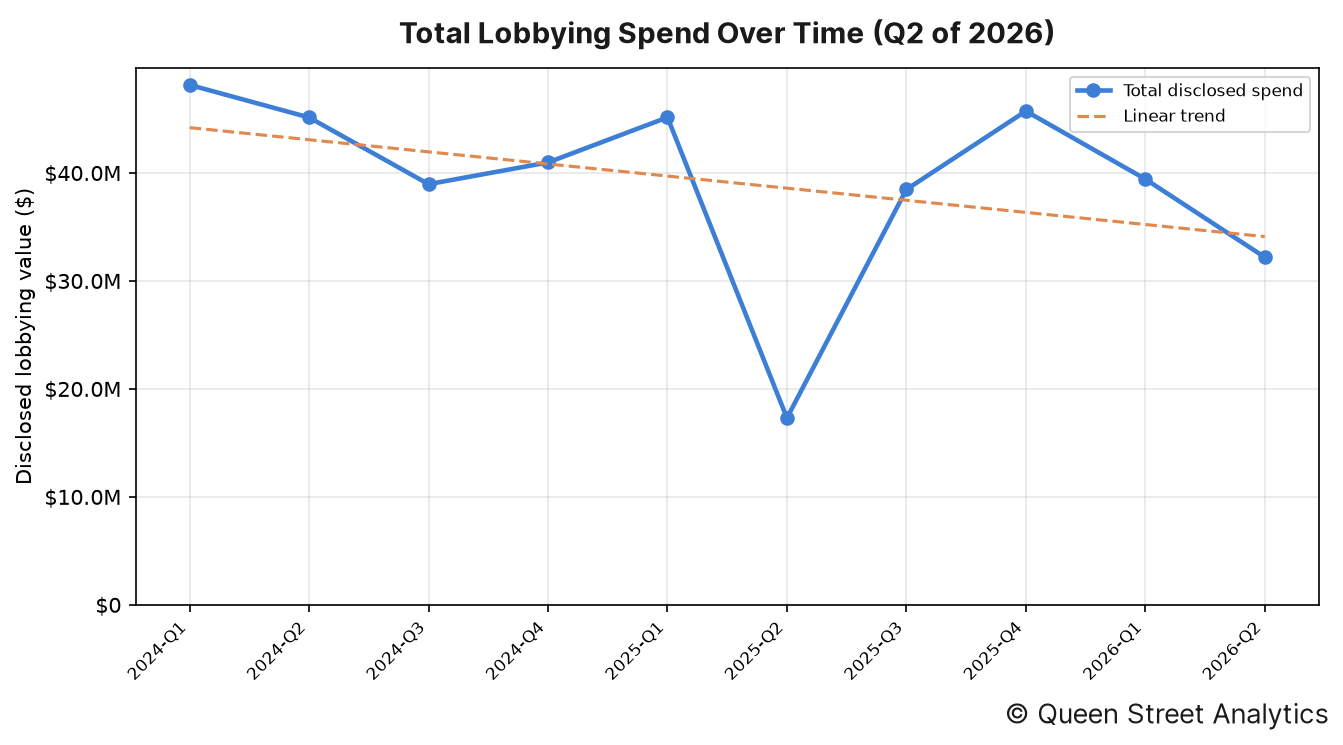
In Q2 of 2026, there was $32.2M worth of disclosed lobbying activity on Oil & Gas. Across the 10 quarters shown, the channel's total disclosed spend has fallen over this period.
Organizations' Lobby Spend
The image below shows the organizations whose lobbying spend moved most from their six-quarter average.
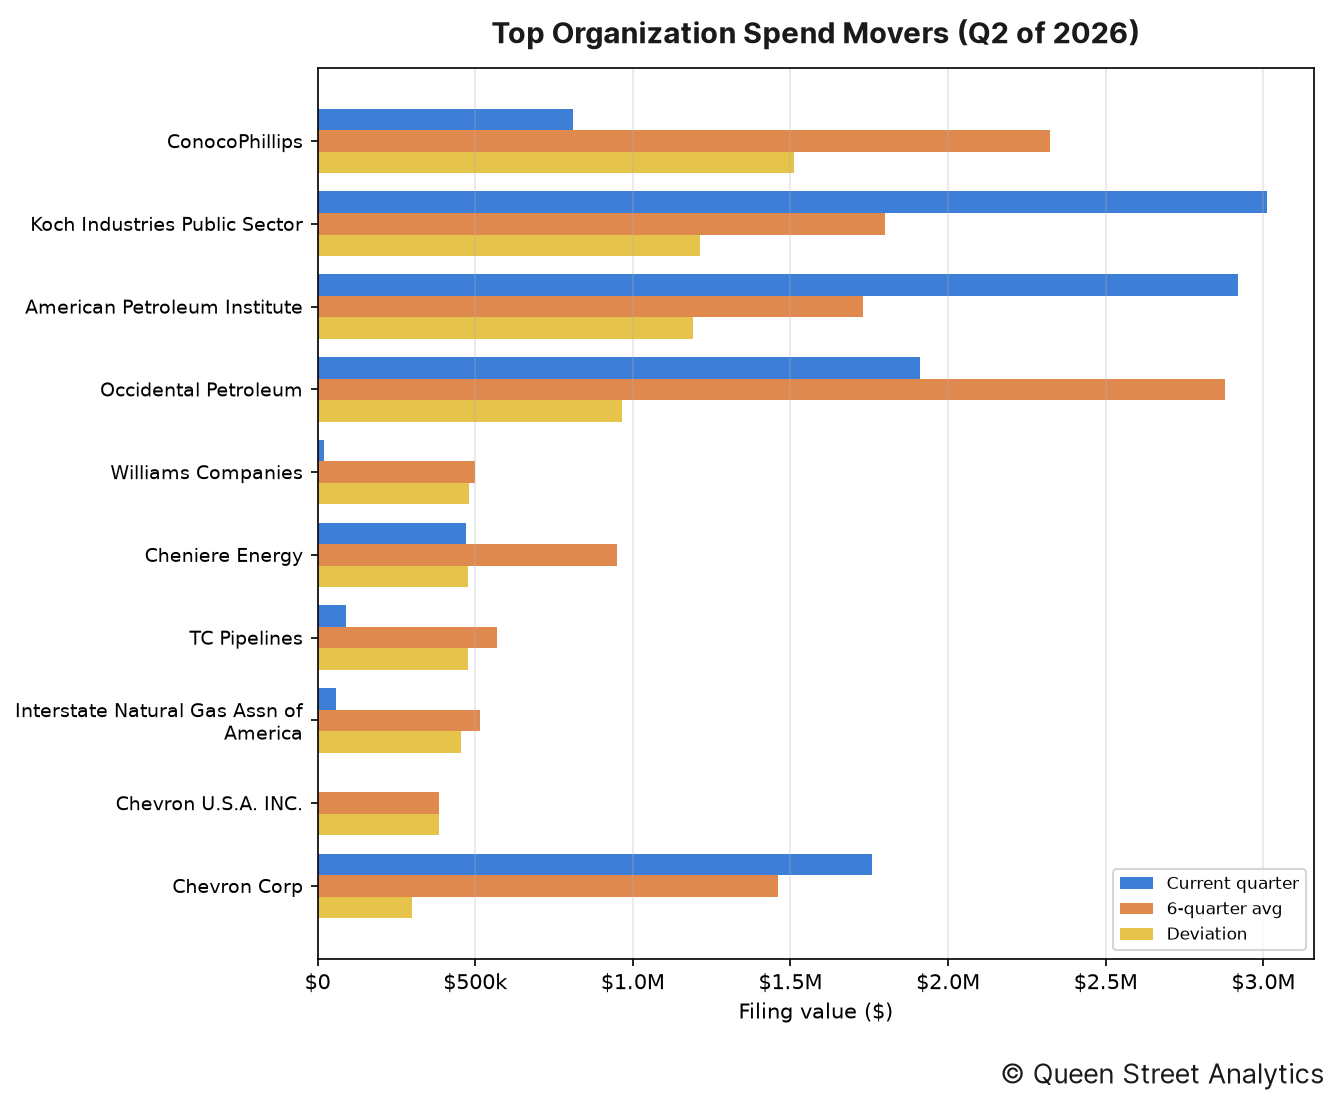
The organizations whose spending moved most from their own recent quarterly average were as follows:
↳ ConocoPhillips accounted for $810k in disclosed lobbying, 65% lower than the recent quarterly average of $2.3M.
↳ Koch Industries Public Sector accounted for $3.0M in disclosed lobbying, 67% higher than the recent quarterly average of $1.8M.
↳ American Petroleum Institute accounted for $2.9M in disclosed lobbying, 69% higher than the recent quarterly average of $1.7M.
↳ Occidental Petroleum accounted for $1.9M in disclosed lobbying, 34% lower than the recent quarterly average of $2.9M.
↳ Williams Companies accounted for $20k in disclosed lobbying, 96% lower than the recent quarterly average of $500k.
↳ Cheniere Energy accounted for $470k in disclosed lobbying, 50% lower than the recent quarterly average of $948k.
Section D: Government Entities Lobbied
This section documents this quarter's most lobbied federal government departments.
By industry
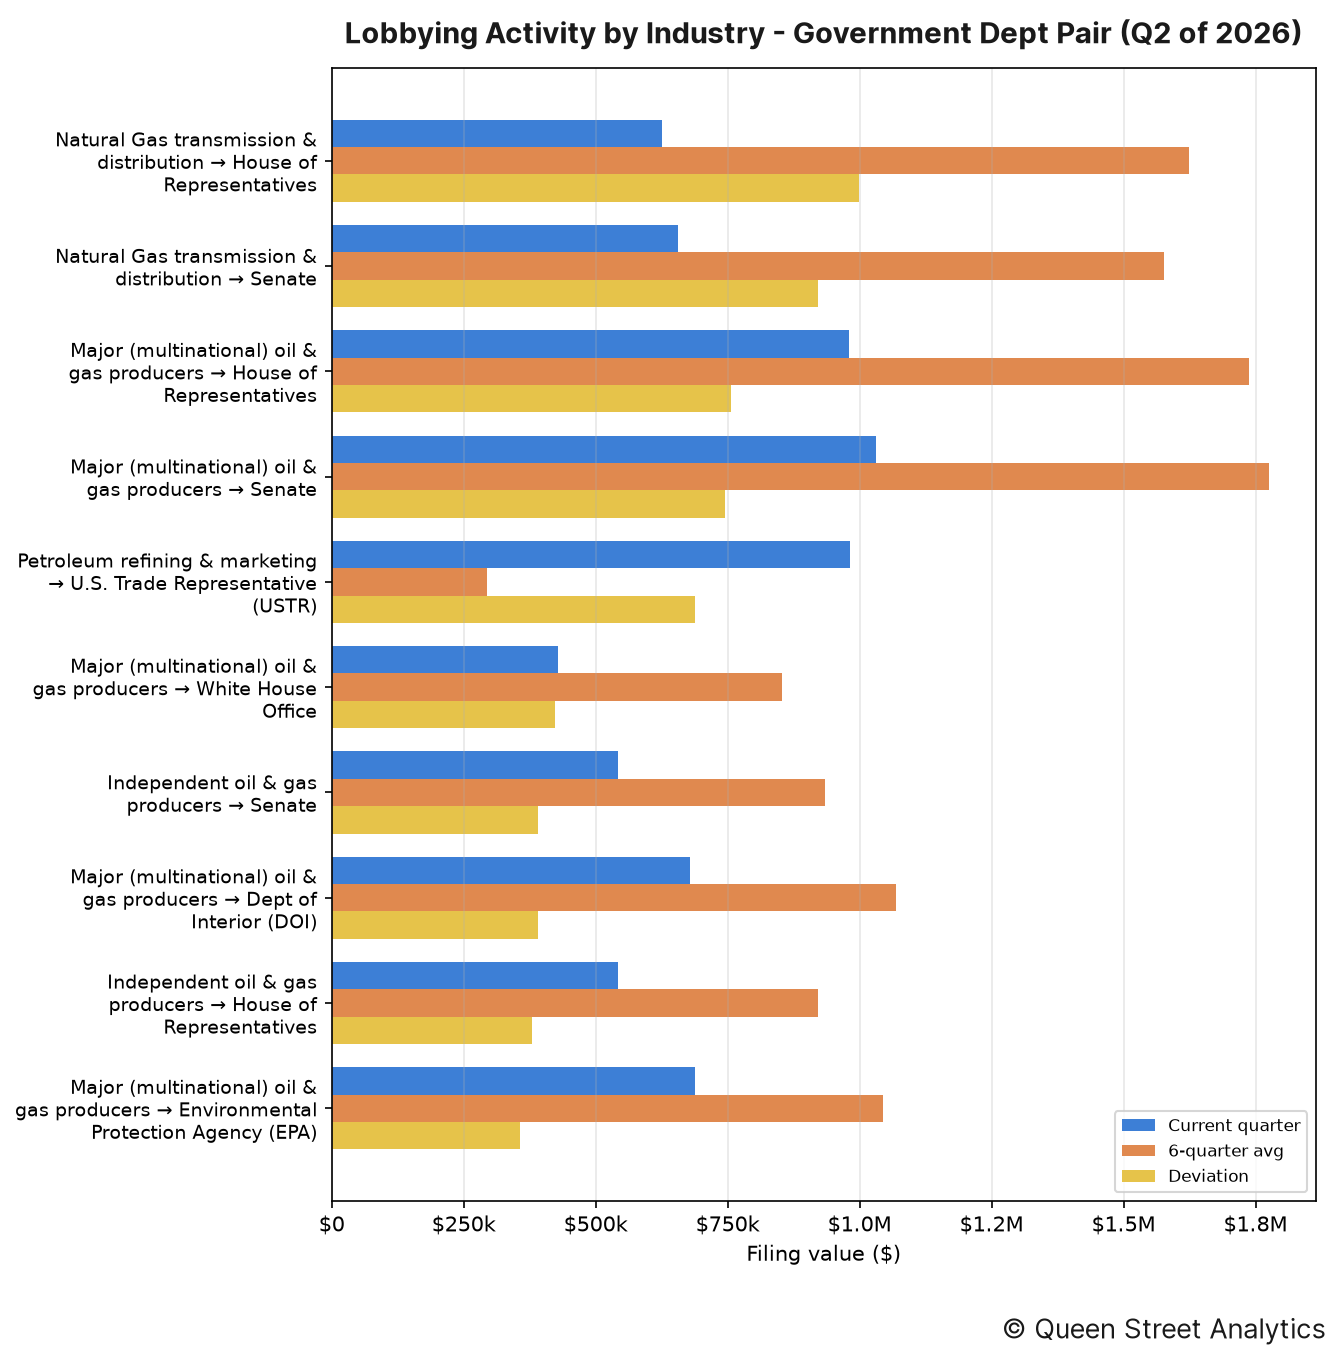
The industry–entity pairings that moved most this quarter were as follows:
↳ Natural Gas transmission & distribution directed $625k of lobbying toward House of Representatives, 61% lower than the recent quarterly average of $1.6M.
↳ Natural Gas transmission & distribution directed $655k of lobbying toward Senate, 58% lower than the recent quarterly average of $1.6M.
↳ Major (multinational) oil & gas producers directed $980k of lobbying toward House of Representatives, 44% lower than the recent quarterly average of $1.7M.
By organization
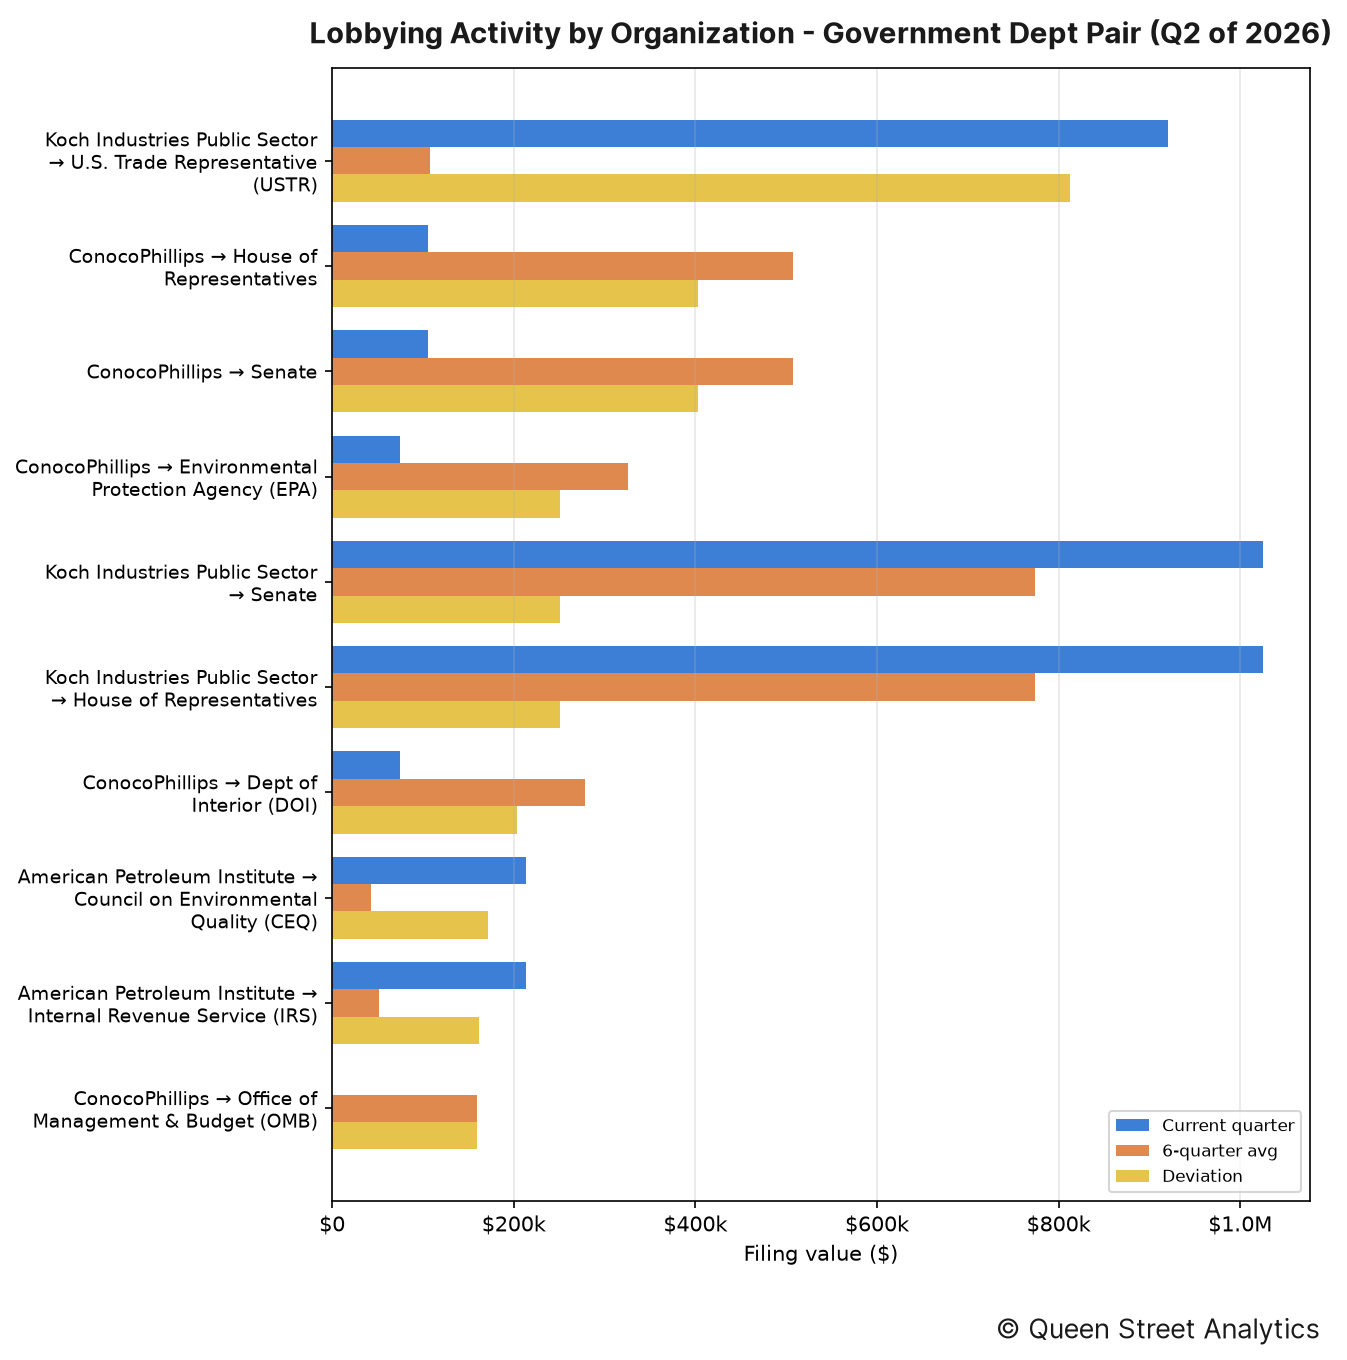
The organization–entity pairings that moved most this quarter were as follows:
↳ Koch Industries Public Sector directed $920k of lobbying toward U.S. Trade Representative (USTR), 754% higher than the recent quarterly average of $108k.
↳ ConocoPhillips directed $105k of lobbying toward House of Representatives, 79% lower than the recent quarterly average of $507k.
↳ ConocoPhillips directed $105k of lobbying toward Senate, 79% lower than the recent quarterly average of $507k.
Section E: Lobbying Issues
This section documents this quarter's most lobbied-on issues.
By industry
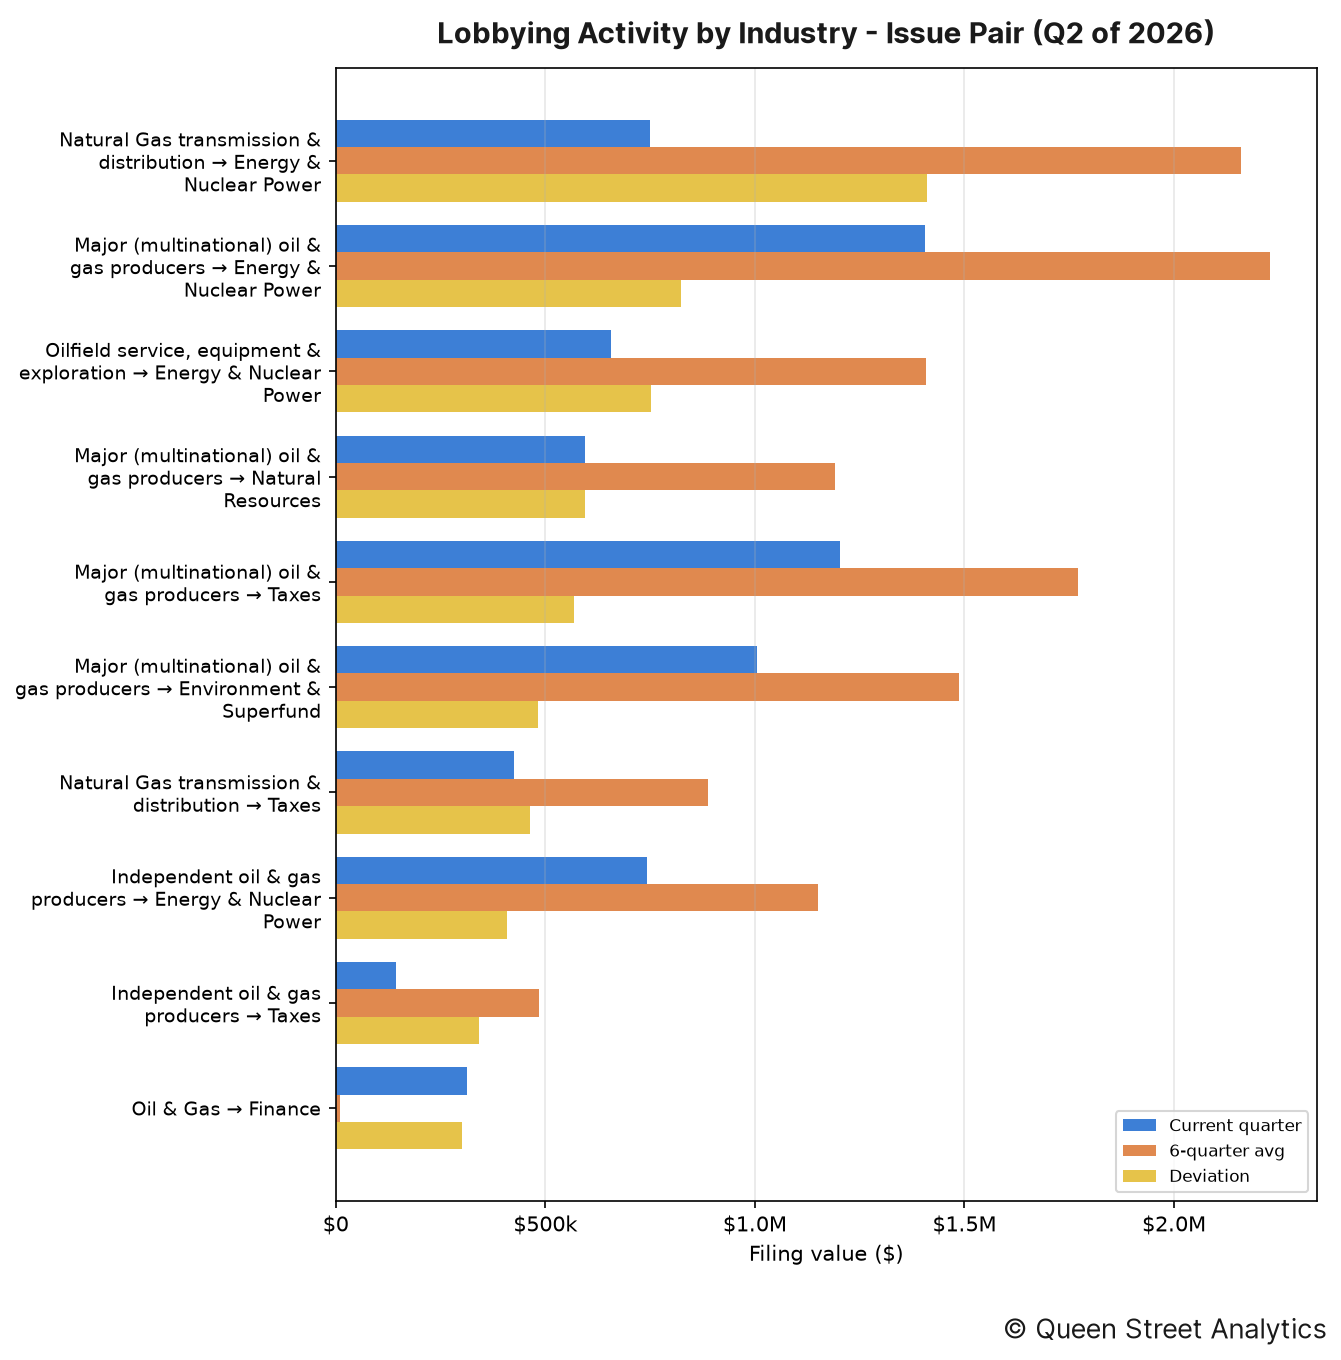
The industry–issue pairings that moved most this quarter were as follows:
↳ Natural Gas transmission & distribution put $750k toward lobbying on Energy & Nuclear Power, 65% lower than the recent quarterly average of $2.2M.
↳ Major (multinational) oil & gas producers put $1.4M toward lobbying on Energy & Nuclear Power, 37% lower than the recent quarterly average of $2.2M.
↳ Oilfield service, equipment & exploration put $657k toward lobbying on Energy & Nuclear Power, 53% lower than the recent quarterly average of $1.4M.
By organization
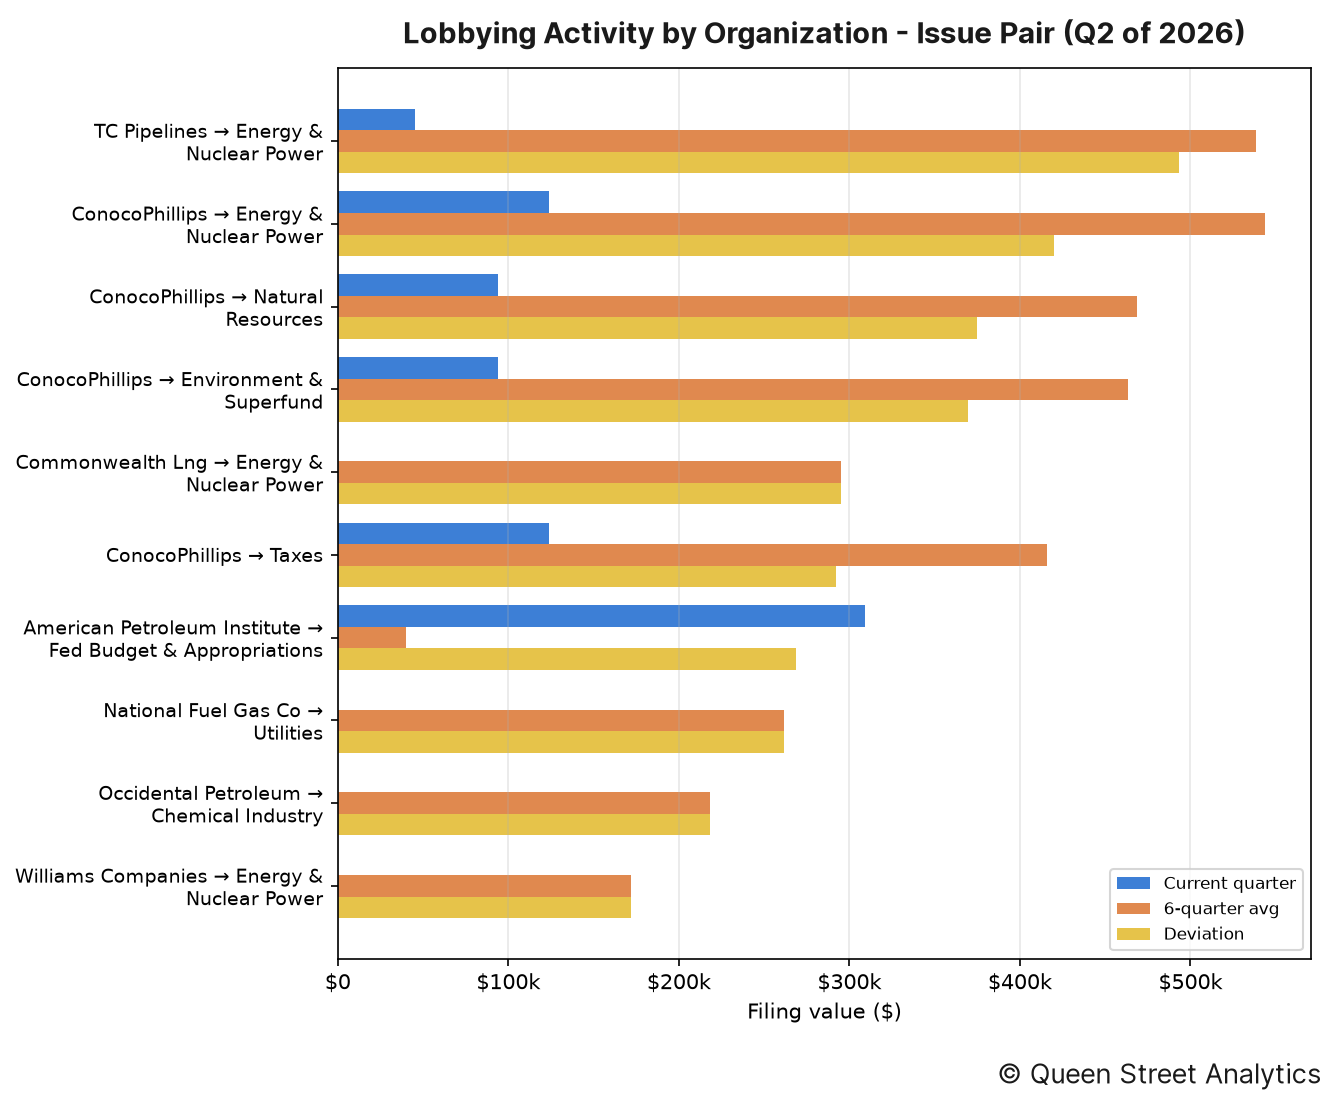
The organization–issue pairings that moved most this quarter were as follows:
↳ TC Pipelines put $45k toward lobbying on Energy & Nuclear Power, 92% lower than the recent quarterly average of $538k.
↳ ConocoPhillips put $124k toward lobbying on Energy & Nuclear Power, 77% lower than the recent quarterly average of $544k.
↳ ConocoPhillips put $94k toward lobbying on Natural Resources, 80% lower than the recent quarterly average of $468k.
Section F: Most-Active Lobbyists
The figure below lists the lobbyists who managed the most imputed lobbying value this quarter, alongside their firm or organization. Because a filing's value is split evenly across the lobbyists it names, these dollar figures are imputed rather than directly disclosed.
No lobbyist activity to report this quarter.
Section G: Organization Network
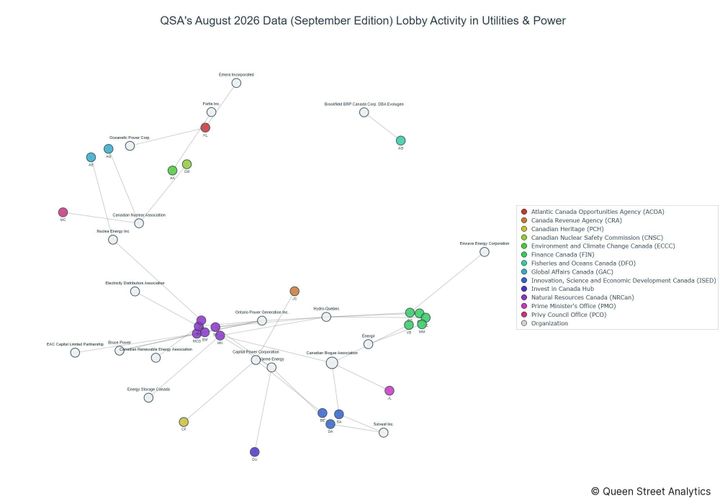
The header image for this edition maps how this channel's organizations (neutral nodes) connect to the federal entities they lobbied (colored nodes) this quarter. A link's weight is the filing value directed to that entity, and node size reflects total value; the House and Senate are excluded (nearly every organization lobbies them) so the specialized targets stand out.
The most widely lobbied entity this quarter was Environmental Protection Agency (EPA), which was lobbied by 16 organizations.
Methodology
Every figure in this report starts from one number: the disclosed value of each lobbying filing, which we take as the income a registrant reported plus any in-house expenses (income + expenses) on its quarterly US Senate and House LDA disclosure. Before totalling anything we clean the filings — applying each amendment over the original it replaces, removing duplicates, and setting aside non-standard records such as registrations and terminations — and map every filing to a lobbying channel and industry using the organization's CRP industry code.
How the money is divided. A filing's full value counts once toward the organization that paid it and that organization's industry, so the industry and organization rankings (Sections A–C) reflect whole dollars. But a single filing usually names several government entities, several issue areas, and several lobbyists at once, and the disclosure never says how the fee was split among them. Rather than credit the full amount to each — which would count the same dollars over and over — we divide a filing's value evenly across the distinct items it names. So a $200,000 filing that lists four agencies contributes $50,000 to each in Section D, and the same even split is applied across issues in Section E and across lobbyists in Section F. That way every section's totals trace back to the same underlying money without double-counting.
Reading the movements. A “deviation” compares the quarter's value to the average of the prior six quarters, so a rise or fall is measured against an entity's own recent norm rather than against the rest of the field. Section B takes the wider view: it sums every industry into one channel total and plots it quarter by quarter, with a fitted line showing the overall direction of travel. Source: US Senate and House LDA disclosures.