USA Lobbying on Hospitality & Retail - Washington (Q3 2026)


U.S. Chamber of Commerce, American Gaming Assn, Coupang INC, and National Federation of Independent Business were unusually active lobbyists this quarter.
View the interactive network in Queen Street Analytics →
Each quarter we track movements in US federal lobbying, channel by channel. This edition covers Hospitality & Retail for Q3 of 2026, ranking the organizations, government entities, issues, and lobbyists whose disclosed spend moved most.
Central Themes in this Quarter’s Lobby Data
OMB Rule Sparks Sector-Wide Pushback on Assistance Reform
Advocacy surged in response to the OMB’s sweeping proposed rule on federal financial assistance, with the U.S. Chamber of Commerce and other business groups organizing comment letters and meetings across food industry, housing, and permitting sectors, including direct engagement with the House of Representatives and the Environmental Protection Agency (EPA). The delays caused by a congressional moratorium have left stakeholders uncertain, prompting heightened lobbying efforts as the scope and compliance burdens remain unclear.
📎 Federal Register — Regulation for Federal Financial Assistance · Council on Foundations — Proposed Rule: Regulation Federal Financial Assistance · National Council of Nonprofits — NCN Comment to OMB on Uniform Guidance
SEC E-Delivery Proposal: Retail and Business Groups Lobby on Digital Mandates
The SEC’s Regulation E-Delivery proposal launched a wave of industry engagement, with the U.S. Chamber of Commerce, representing retail chains and membership organizations, evaluating cost-cutting benefits versus compliance risks under the new digital default. Lobbyists, including the U.S. Chamber of Commerce in its outreach to the Department of Labor and Small Business Administration, are reportedly concerned about communication standards and whether federal preemption may complicate state-level requirements.
📎 SEC — Regulation E-Delivery Proposal · Harvard Law — SEC Proposes New E-Delivery Framework · Federal Register — Electronic Delivery of Information under the Federal Securities Laws
Main Street Parity Act Modernizes SBA 504 Loans; Small Business Advocacy Intensifies
The passage of H.R. 5763 has been widely cited by small business and hospitality groups, including the Small Business/Entrepreneurship Council and the National Small Business Assn, as a legislative win, easing access to capital for industry mainstays like hotels and single-purpose properties. Industry associations such as the National Small Business Assn rallied for parity, driving record lobbying expenditures in the wake of these reforms through direct engagement with entities like the House of Representatives and the Small Business Administration.
📎 Williams House Statement — Main Street Parity Act · House Small Business Committee — Main Street Parity Act Advances · Congress.gov — H.R. 5763 Bill Summary
Casino & Gambling Sector Faces New Regulatory Pressures and Tax Changes
Federal and state authorities moved aggressively on casino-style gambling, with new definitions excluding certain products from swap regulation and a crackdown on tax deductions for gaming losses. Reports suggest casino advocacy groups such as the National Small Business Assn, which lobbied the House of Representatives and the Executive Office of the President (EOP), expanded lobbying to address compliance with revised W-2G thresholds and stricter consumer protections.
📎 Casino.org — Latest Gambling Tax Law Changes 2026 · Public Gaming — US Gambling Legislation News 2026 · Federal Register — Further Definition of “Swap” To Exclude Casino-Style Gambling Products
Sharp Spending Increases as Business Groups Target FDA, ITA Amid Policy Uncertainty
Lobbying spend by chambers and retail trade groups, including the U.S. Chamber of Commerce and the National Small Business Assn, surged toward agencies like the FDA and the International Trade Administration, mainly tied to food industry and trade policy developments. While direct causality is unclear, data indicate a heightened advocacy push coinciding with regulatory and legislative ambiguity affecting core business operations.
📎 Q3 2026 Lobbying Filings: Every Federal Lobbying Report for the Quarter ...

Section A: Lobbying Spend by Industry
How much each industry in this channel spent on federal lobbying in Q3 of 2026, compared with its average over the prior six quarters.
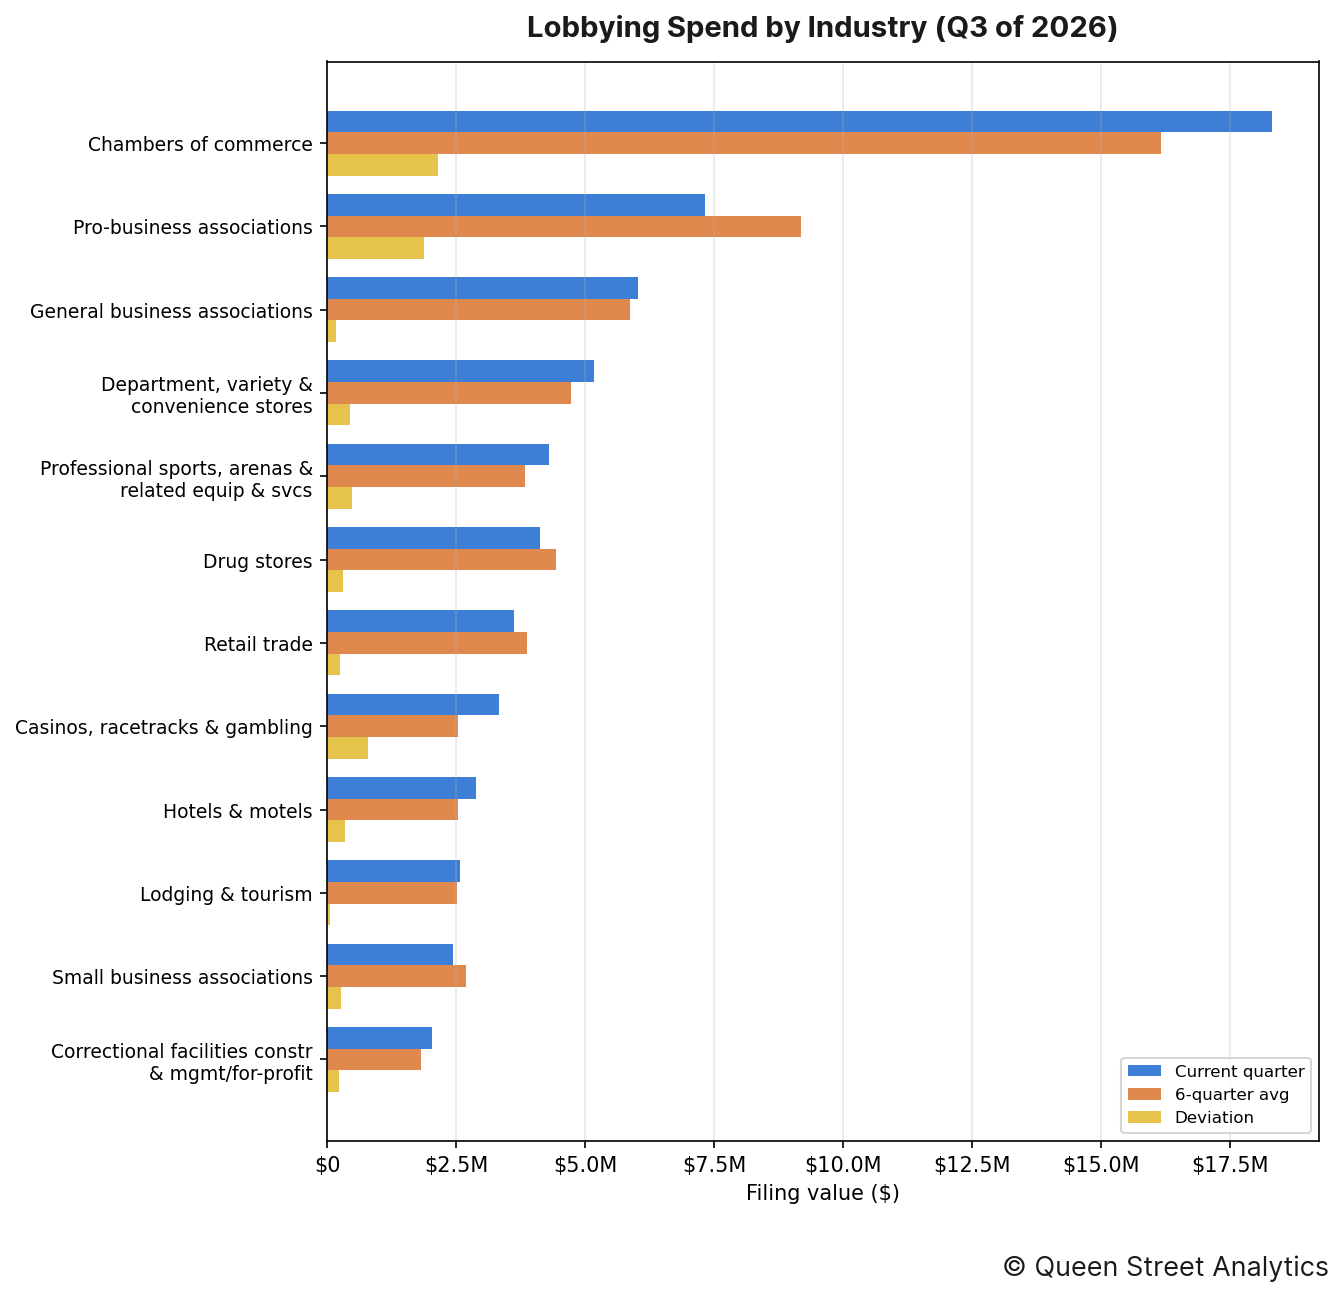
In Q3 of 2026, there was $76.6M worth of disclosed lobbying activity on Hospitality & Retail, roughly in line with the recent quarterly average of $74.1M. This activity can be broken down by industry as follows:
↳ There was $18.3M worth of Chambers of commerce lobbying, 13% higher than the recent quarterly average of $16.2M.
↳ There was $7.3M worth of Pro-business associations lobbying, 20% lower than the recent quarterly average of $9.2M.
↳ There was $6.0M worth of General business associations lobbying, roughly in line with the recent quarterly average of $5.9M.
↳ There was $5.2M worth of Department, variety & convenience stores lobbying, roughly in line with the recent quarterly average of $4.7M.
↳ There was $4.3M worth of Professional sports, arenas & related equip & svcs lobbying, 12% higher than the recent quarterly average of $3.8M.
↳ There was $4.1M worth of Drug stores lobbying, roughly in line with the recent quarterly average of $4.4M.
Section B: Lobbying Spend Trend
This channel's total disclosed lobbying spend across recent quarters, aggregated over all of its industries.
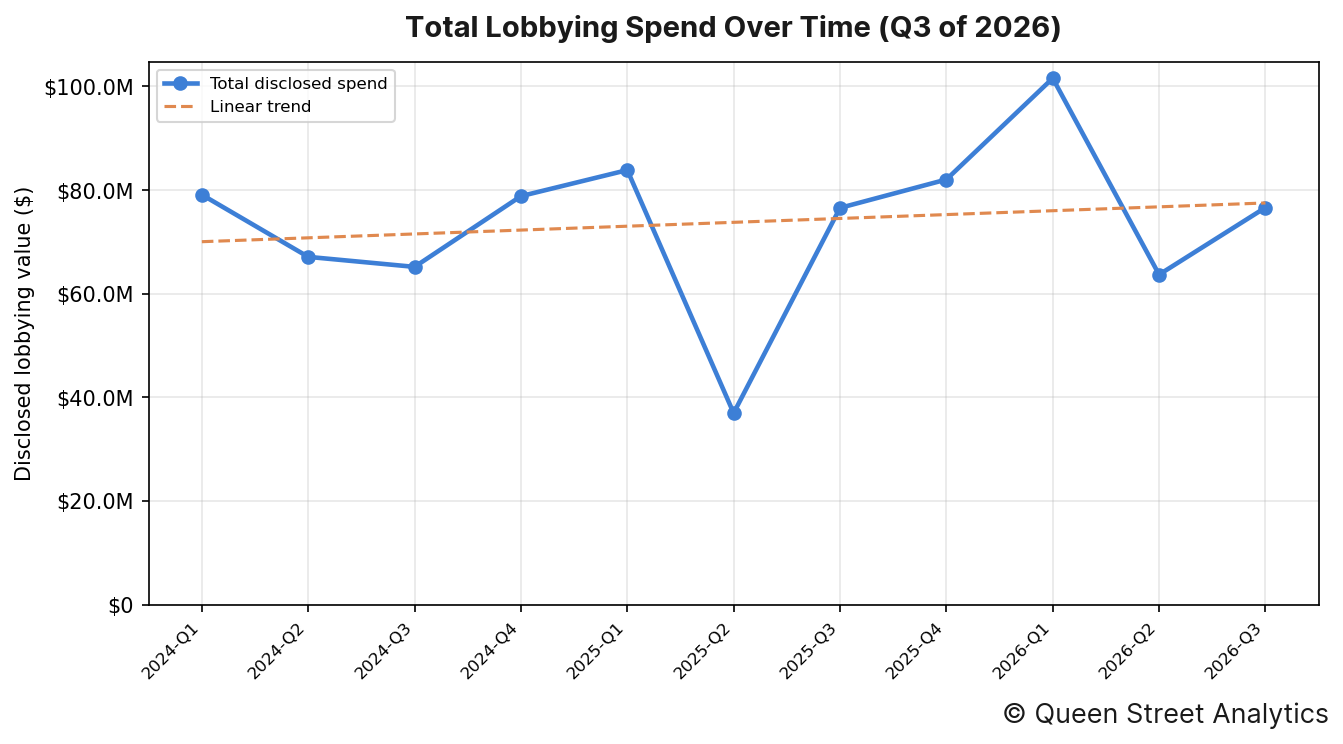
In Q3 of 2026, there was $76.6M worth of disclosed lobbying activity on Hospitality & Retail. Across the 11 quarters shown, the channel's total disclosed spend has held roughly steady over this period.
Organizations' Lobby Spend
The image below shows the organizations whose lobbying spend moved most from their six-quarter average.
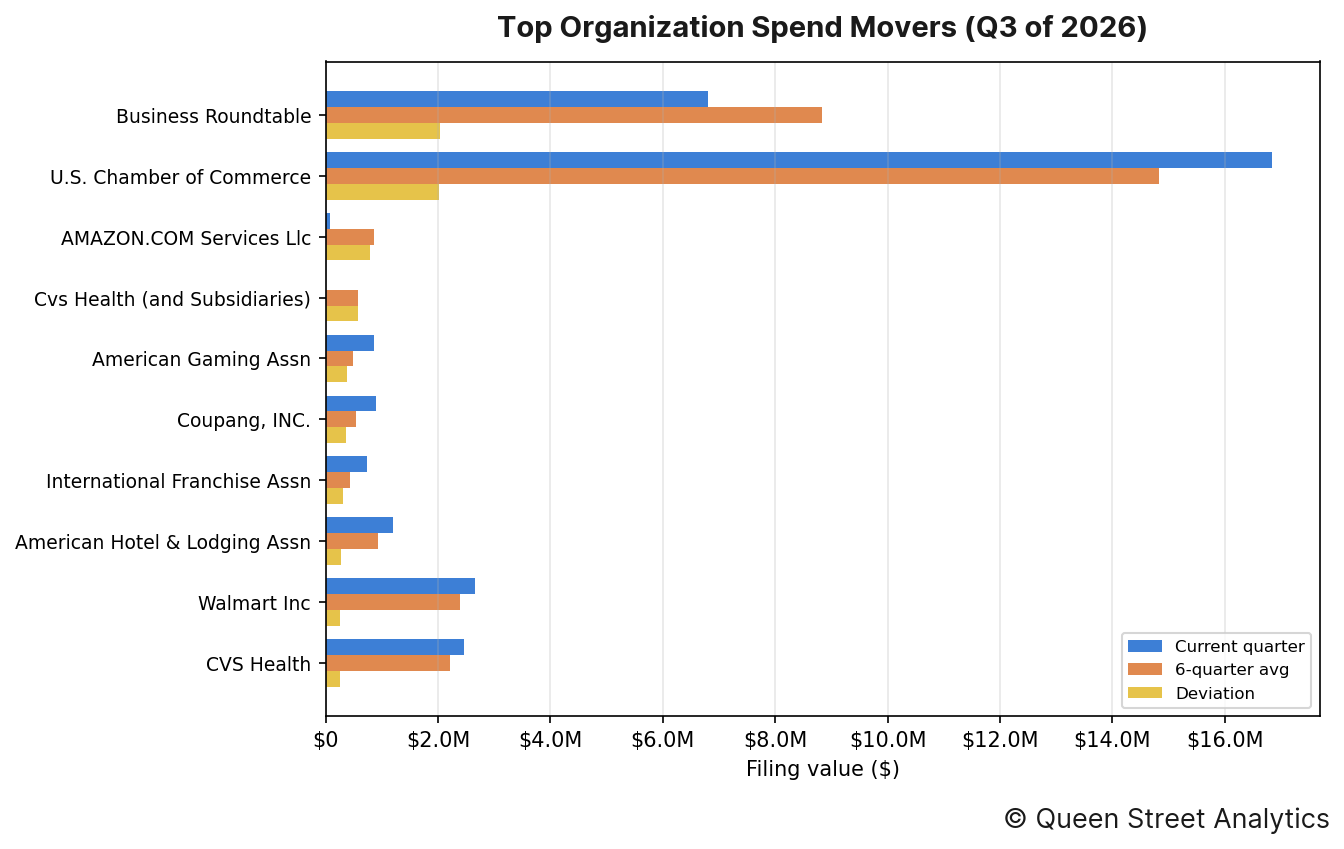
The organizations whose spending moved most from their own recent quarterly average were as follows:
↳ Business Roundtable accounted for $6.8M in disclosed lobbying, 23% lower than the recent quarterly average of $8.8M.
↳ U.S. Chamber of Commerce accounted for $16.9M in disclosed lobbying, 14% higher than the recent quarterly average of $14.8M.
↳ AMAZON.COM Services Llc accounted for $80k in disclosed lobbying, 91% lower than the recent quarterly average of $861k.
↳ Cvs Health (and Subsidiaries) accounted for $0 in disclosed lobbying, 100% lower than the recent quarterly average of $573k.
↳ American Gaming Assn accounted for $860k in disclosed lobbying, 80% higher than the recent quarterly average of $478k.
↳ Coupang, INC. accounted for $895k in disclosed lobbying, 68% higher than the recent quarterly average of $532k.
Section D: Government Entities Lobbied
This section documents this quarter's most lobbied federal government departments.
By industry
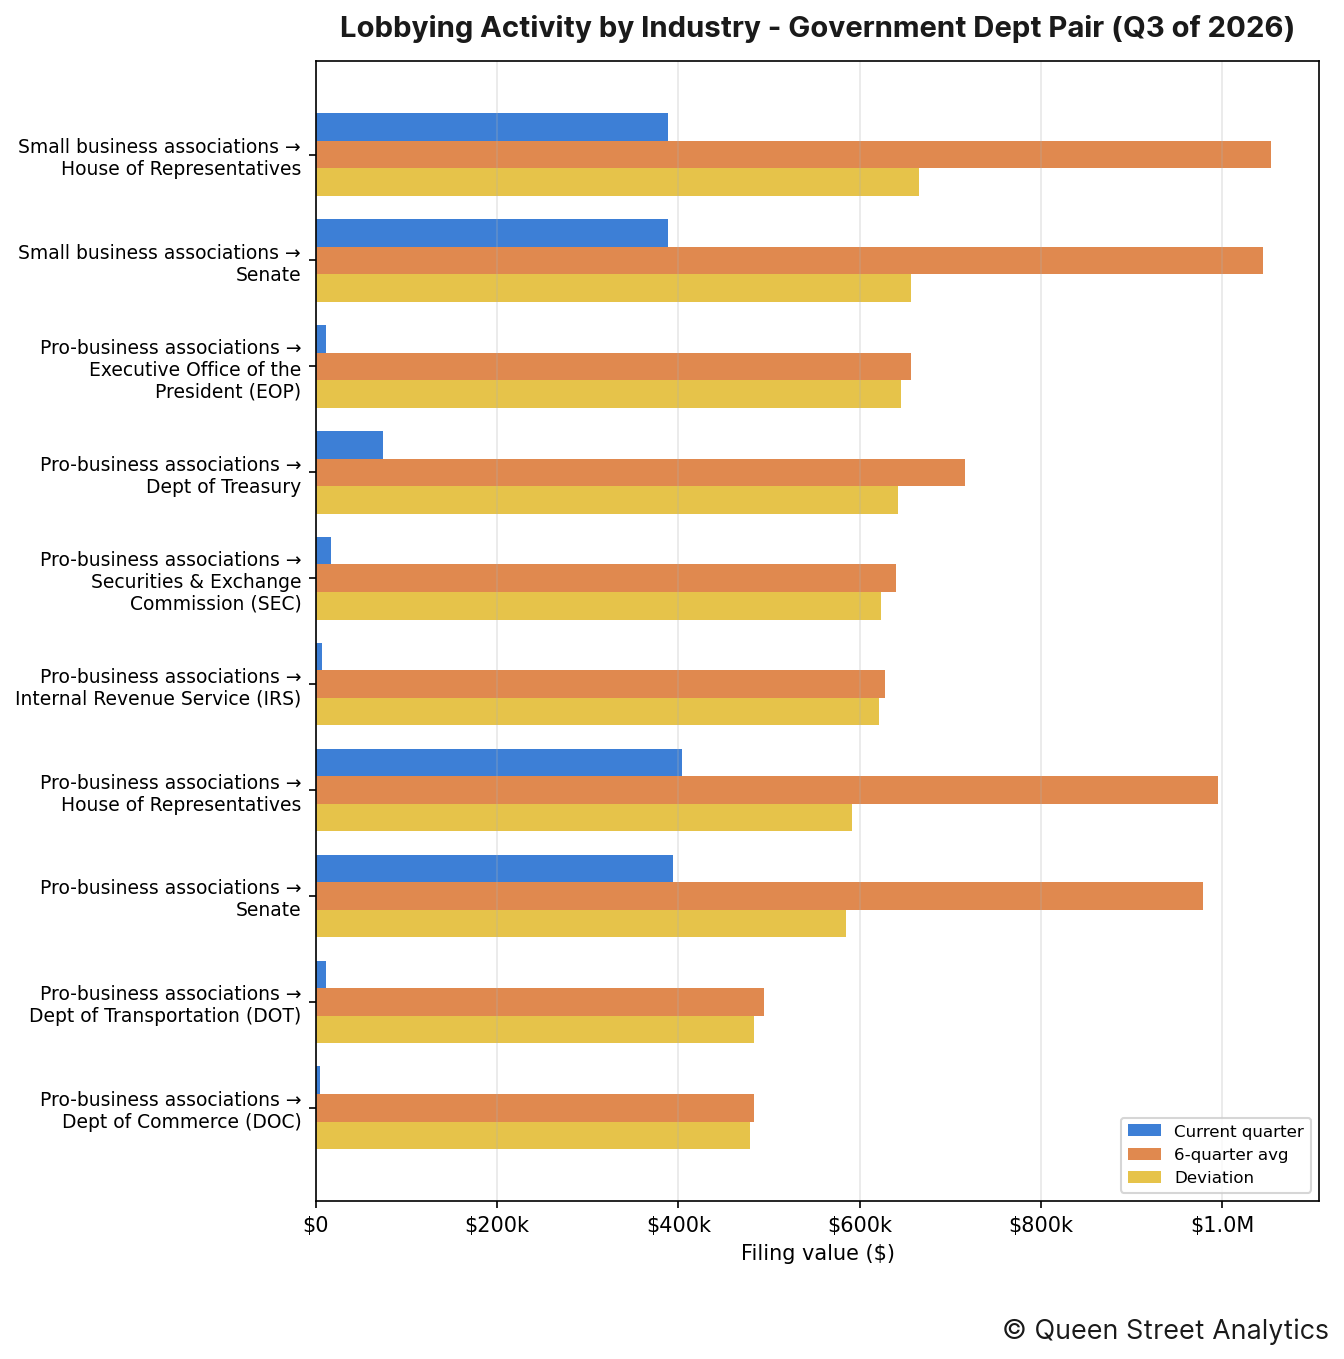
The industry–entity pairings that moved most this quarter were as follows:
↳ Small business associations directed $389k of lobbying toward House of Representatives, 63% lower than the recent quarterly average of $1.1M.
↳ Small business associations directed $389k of lobbying toward Senate, 63% lower than the recent quarterly average of $1.0M.
↳ Pro-business associations directed $11k of lobbying toward Executive Office of the President (EOP), 98% lower than the recent quarterly average of $657k.
By organization
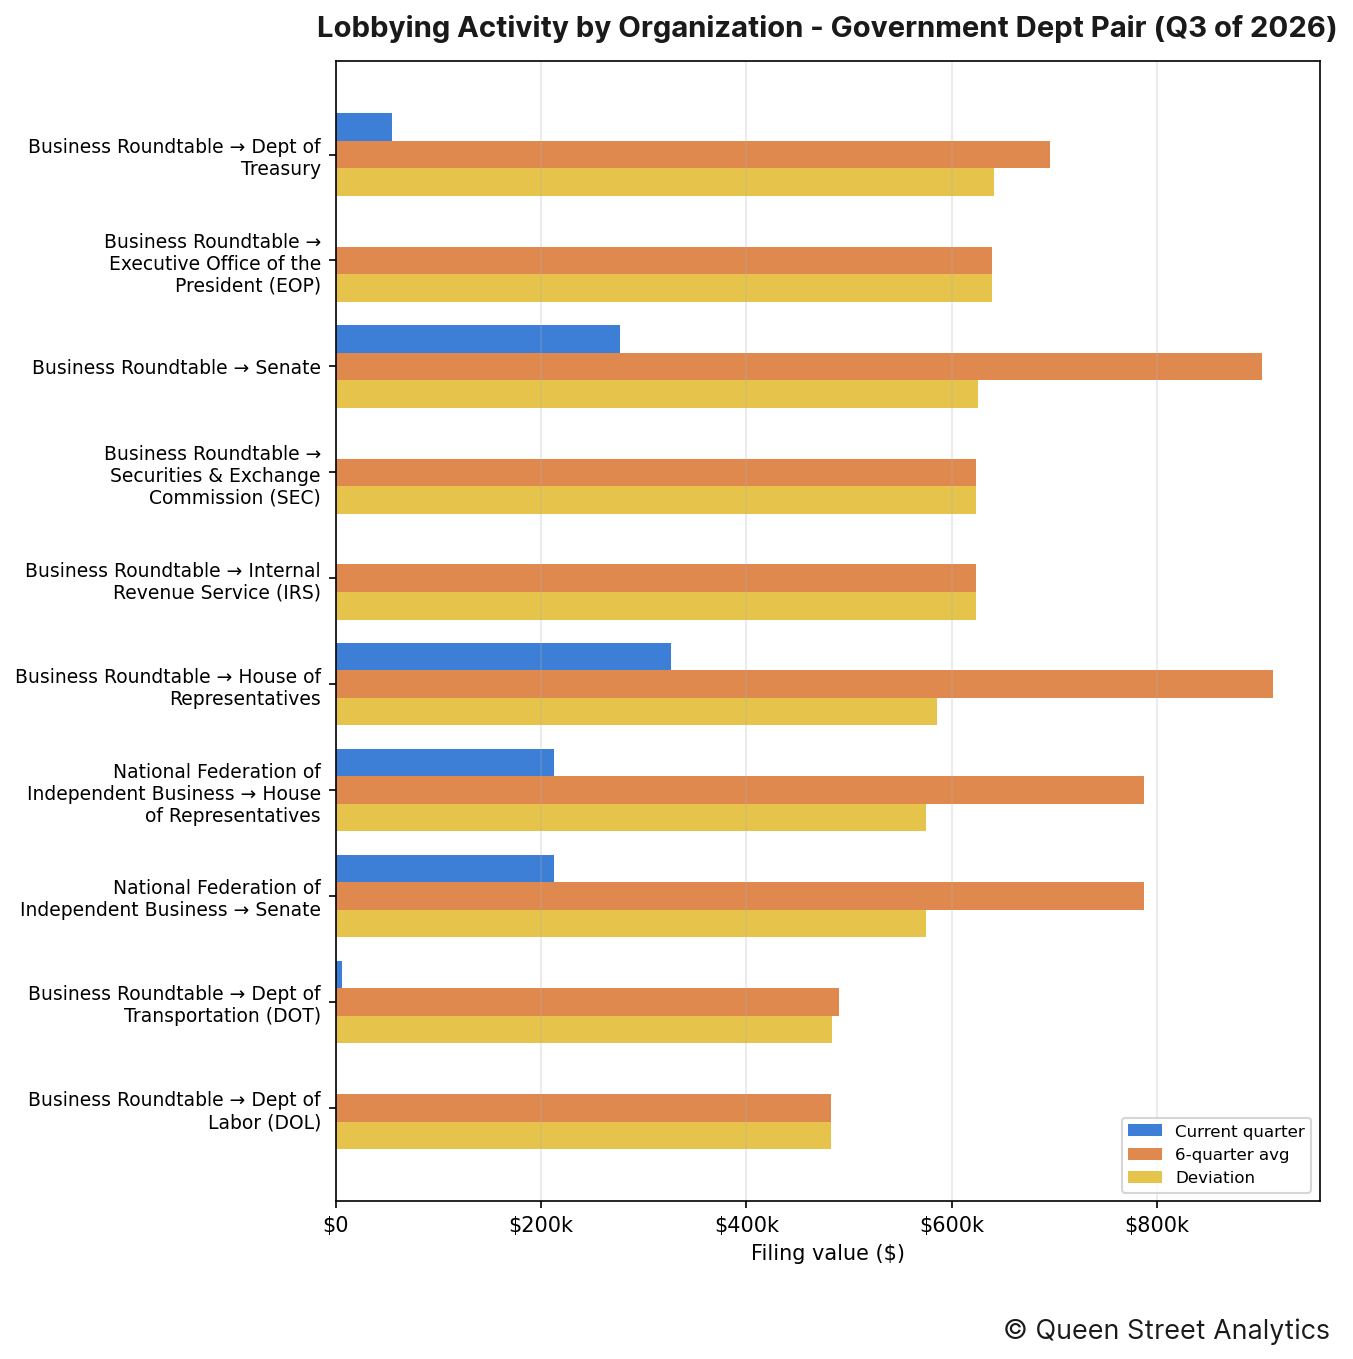
The organization–entity pairings that moved most this quarter were as follows:
↳ Business Roundtable directed $55k of lobbying toward Dept of Treasury, 92% lower than the recent quarterly average of $696k.
↳ Business Roundtable directed $0 of lobbying toward Executive Office of the President (EOP), 100% lower than the recent quarterly average of $639k.
↳ Business Roundtable directed $277k of lobbying toward Senate, 69% lower than the recent quarterly average of $903k.
Section E: Lobbying Issues
This section documents this quarter's most lobbied-on issues.
By industry
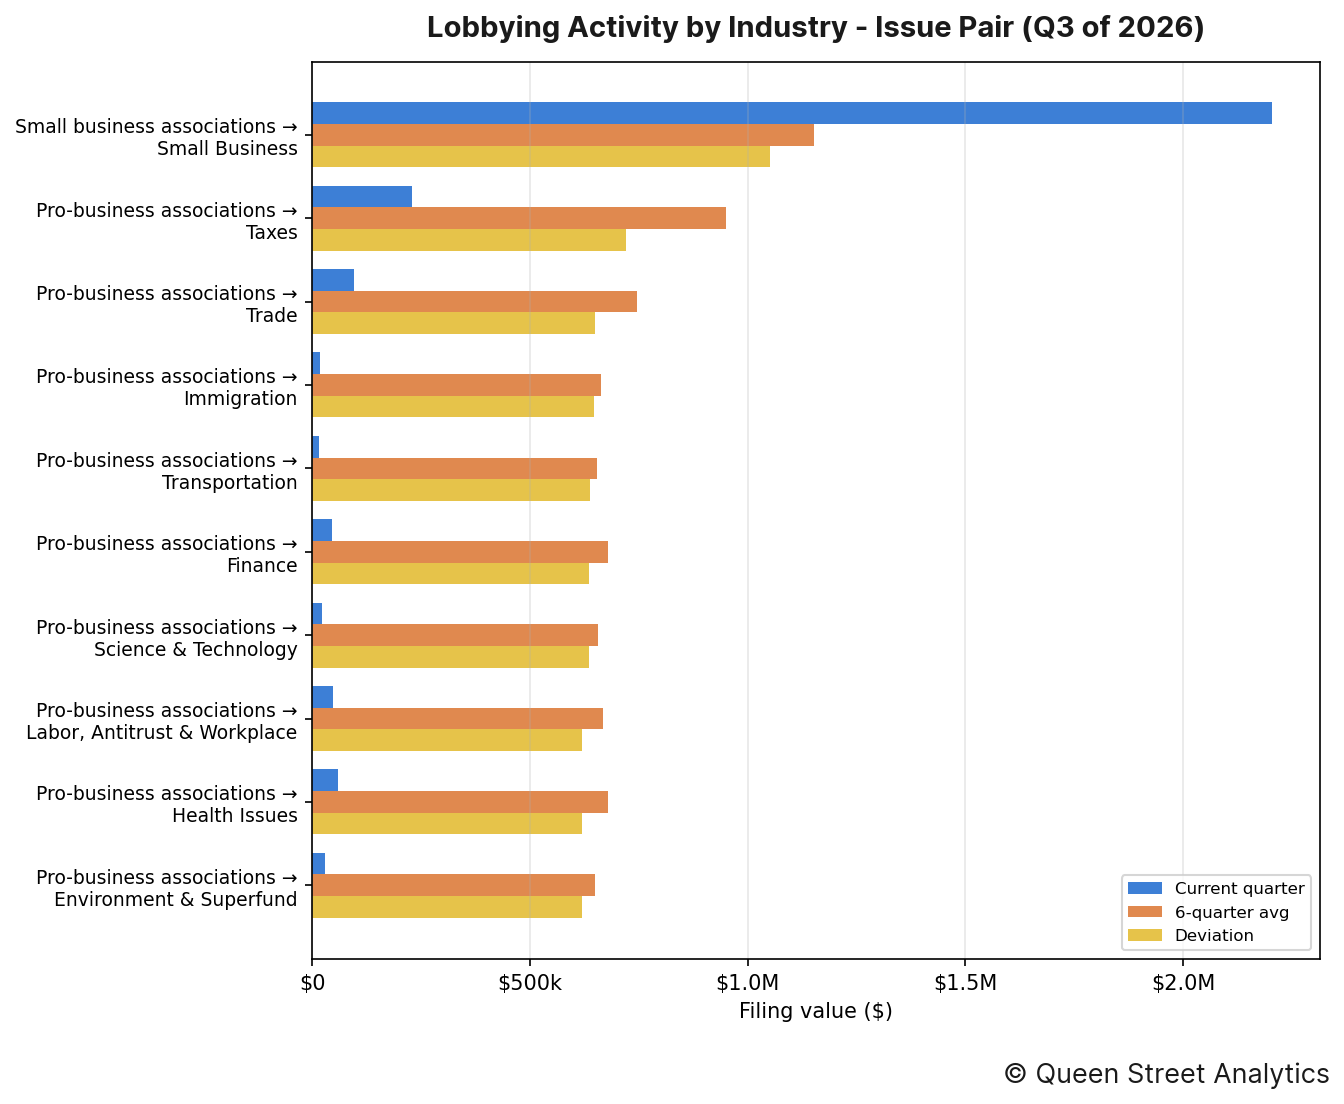
The industry–issue pairings that moved most this quarter were as follows:
↳ Small business associations put $2.2M toward lobbying on Small Business, 91% higher than the recent quarterly average of $1.2M.
↳ Pro-business associations put $230k toward lobbying on Taxes, 76% lower than the recent quarterly average of $951k.
↳ Pro-business associations put $96k toward lobbying on Trade, 87% lower than the recent quarterly average of $745k.
By organization
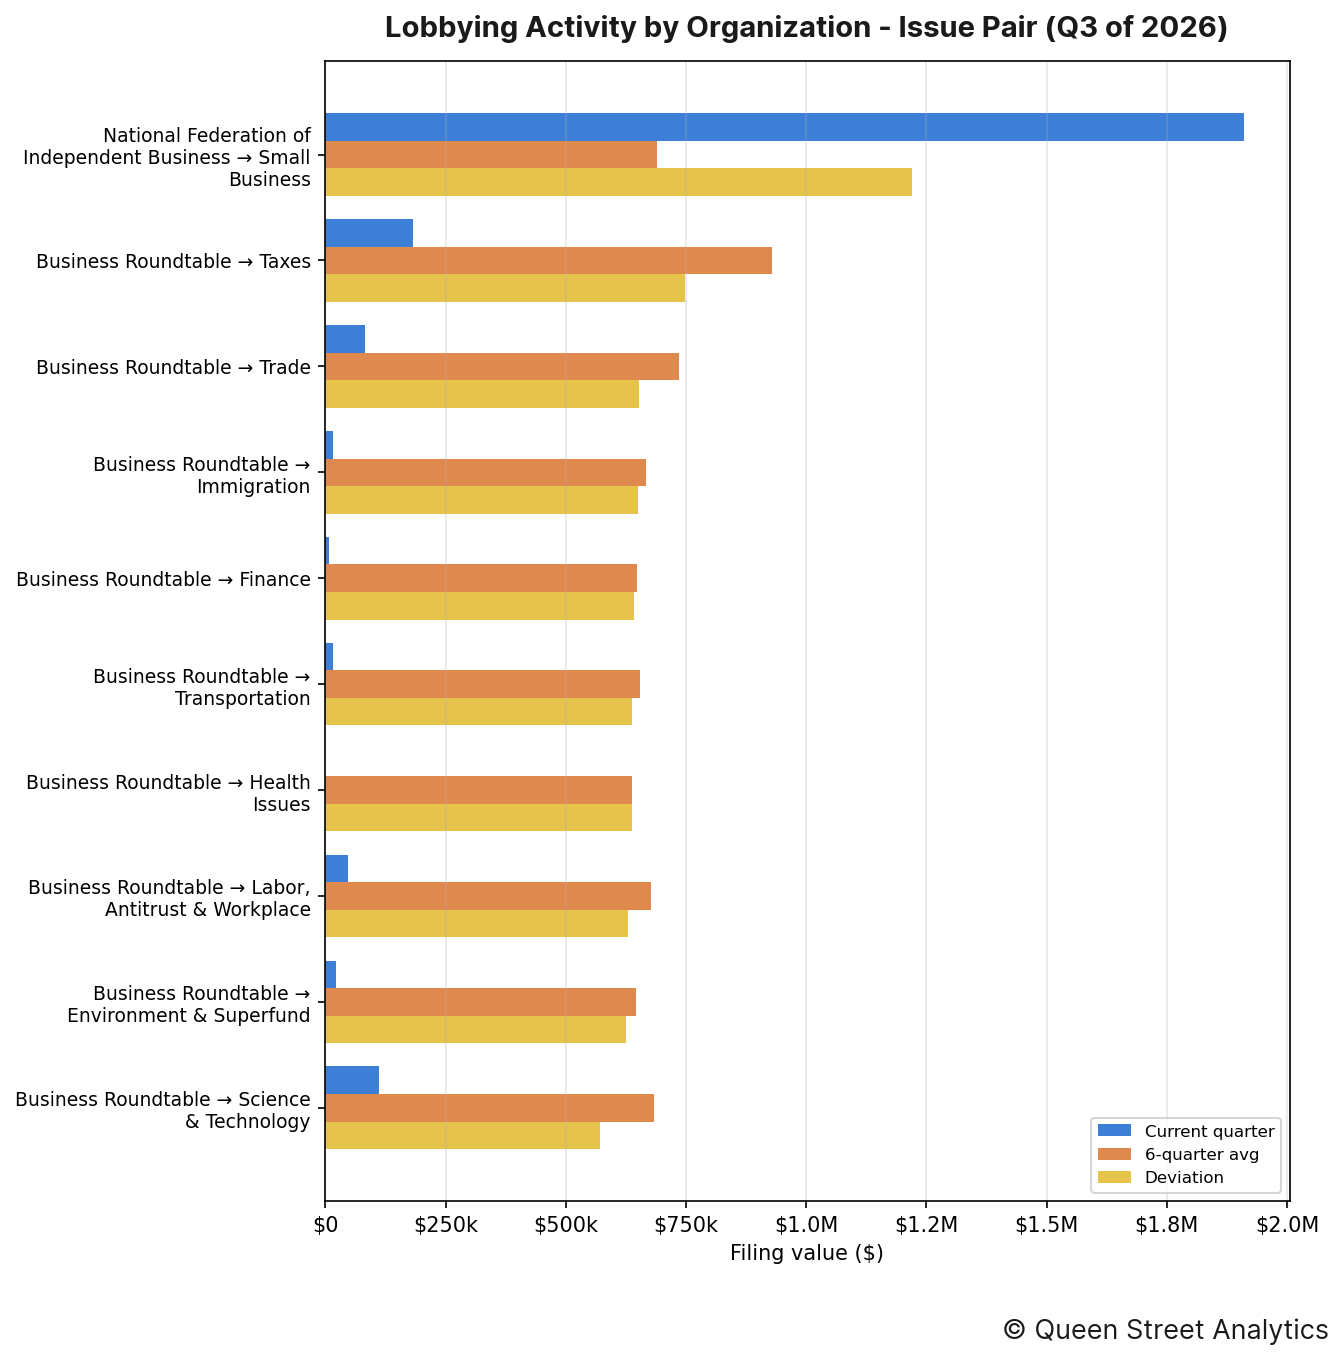
The organization–issue pairings that moved most this quarter were as follows:
↳ National Federation of Independent Business put $1.9M toward lobbying on Small Business, 177% higher than the recent quarterly average of $690k.
↳ Business Roundtable put $182k toward lobbying on Taxes, 80% lower than the recent quarterly average of $929k.
↳ Business Roundtable put $82k toward lobbying on Trade, 89% lower than the recent quarterly average of $735k.
Section F: Most-Active Lobbyists
The figure below lists the lobbyists who managed the most imputed lobbying value this quarter, alongside their firm or organization. Because a filing's value is split evenly across the lobbyists it names, these dollar figures are imputed rather than directly disclosed.
No lobbyist activity to report this quarter.
Section G: Organization Network
The header image for this edition maps how this channel's organizations (neutral nodes) connect to the federal entities they lobbied (colored nodes) this quarter. A link's weight is the filing value directed to that entity, and node size reflects total value; the House and Senate are excluded (nearly every organization lobbies them) so the specialized targets stand out.
The most widely lobbied entity this quarter was White House Office, which was lobbied by 16 organizations.
Methodology
Every figure in this report starts from one number: the disclosed value of each lobbying filing, which we take as the income a registrant reported plus any in-house expenses (income + expenses) on its quarterly US Senate and House LDA disclosure. Before totalling anything we clean the filings — applying each amendment over the original it replaces, removing duplicates, and setting aside non-standard records such as registrations and terminations — and map every filing to a lobbying channel and industry using the organization's CRP industry code.
How the money is divided. A filing's full value counts once toward the organization that paid it and that organization's industry, so the industry and organization rankings (Sections A–C) reflect whole dollars. But a single filing usually names several government entities, several issue areas, and several lobbyists at once, and the disclosure never says how the fee was split among them. Rather than credit the full amount to each — which would count the same dollars over and over — we divide a filing's value evenly across the distinct items it names. So a $200,000 filing that lists four agencies contributes $50,000 to each in Section D, and the same even split is applied across issues in Section E and across lobbyists in Section F. That way every section's totals trace back to the same underlying money without double-counting.
Reading the movements. A “deviation” compares the quarter's value to the average of the prior six quarters, so a rise or fall is measured against an entity's own recent norm rather than against the rest of the field. Section B takes the wider view: it sums every industry into one channel total and plots it quarter by quarter, with a fitted line showing the overall direction of travel. Source: US Senate and House LDA disclosures.


