USA Lobbying on Higher Ed - Washington (Q4 2025)





Trustees of the Univ of Pennsylvania, Johns Hopkins University, The Regents of the University of Michigan, and Syracuse University were unusually active lobbyists this quarter.
View the interactive network in Queen Street Analytics →
Each quarter we track movements in US federal lobbying, channel by channel. This edition covers Higher Ed for Q4 of 2025, ranking the organizations, government entities, issues, and lobbyists whose disclosed spend moved most.
Central Themes in this Quarter’s Lobby Data
Sweeping Federal Higher Ed Overhaul Drives Lobbying Surge
Major higher education lobbying activity in late 2025 appears to align with the passage and ongoing implementation of the 'One Big Beautiful Bill Act' (P.L. 119-21), with the Association of American Medical Colleges pressing both the Senate and House of Representatives on affordable income-driven repayment plans. The law's sweeping changes to student loans, aid eligibility, and new endowment excise taxes have spurred universities such as Rutgers University to engage policymakers in the House of Representatives as they face operational uncertainty and regulatory delays, while the National Assn of Colleges & Employers has also focused its efforts on student financial aid provisions before the Senate.
📎 One Big Beautiful Bill Act Updates | Federal Student Aid · Amendments to the Higher Education Act Made by P.L. 119-21, the FY2025 ... · U.S. Federal Policy Tracker | CASE
Department of Education Shakeup Spurs Advocacy Push
Reports indicate that the partial dismantling of the Education Department, with key functions shifting to other agencies and significant workforce reductions, added urgency for institutions and groups such as the Association of American Medical Colleges to lobby both Congress, including the House of Representatives and the Senate, and the executive branch. This unprecedented realignment generated widespread concerns about funding continuity, policy oversight, and student program stability.
📎 Changes at the Department of Education, November 2025 · Board Briefing: Federal Restructuring and Its Impact on Higher Education
Federal Appropriations Battles Intensify Research Lobbying
Lobbying activity from top research universities appears to mirror contentious negotiations in Congress over 2026 appropriations for science, health, and defense, with the Association of American Medical Colleges advocating before the House of Representatives and agencies such as the Dept of Health & Human Services and the Natl Institutes of Health. Institutions including the University of Alaska closely tracked spending bills and research funding rules as debate over agency budgets and support for graduate programs sharpened this quarter.
📎 U.S. House Appropriations Bill Tracker · Higher Education Legislation in 2025 - National Conference of State ... · Higher Education Policy - U.S. Department of Education
Financial Aid Disruptions Prompt Schools to Step Up Advocacy
Ongoing disruptions to the federal student aid process—including technical glitches, shifting standards, and looming changes to FAFSA—seem to have heightened lobbying efforts by colleges, such as the Association of American Medical Colleges. Institutions reportedly sought to ensure continued access to aid for students amid policy uncertainty and administrative rollouts, with the Association of American Medical Colleges engaging with the House of Representatives and the Executive Office of the President.
📎 TICAS 2025 FEDERAL POLICY AGENDA · Higher Education Legislation in 2025 - National Conference of State ...
Heightened Scrutiny on DEI and Endowments Fuels Governance Lobbying
Increased advocacy aimed at campus governance and funding is plausibly connected to recent executive orders restricting DEI programs and new federal investigations into large university endowments, exemplified by efforts from the Association of American Medical Colleges in engaging with the Executive Office of the President (EOP) and the House of Representatives. Federal mandates on campus protests and compliance added further impetus for institutions to engage with policymakers on both sides of the aisle during Q4, with organizations like the Association of American Medical Colleges emphasizing these priorities in their outreach to federal entities.
📎 U.S. Federal Policy Tracker | CASE · Board Briefing: Federal Restructuring and Its Impact on Higher Education

Section A: Lobbying Spend by Industry
How much each industry in this channel spent on federal lobbying in Q4 of 2025, compared with its average over the prior six quarters.
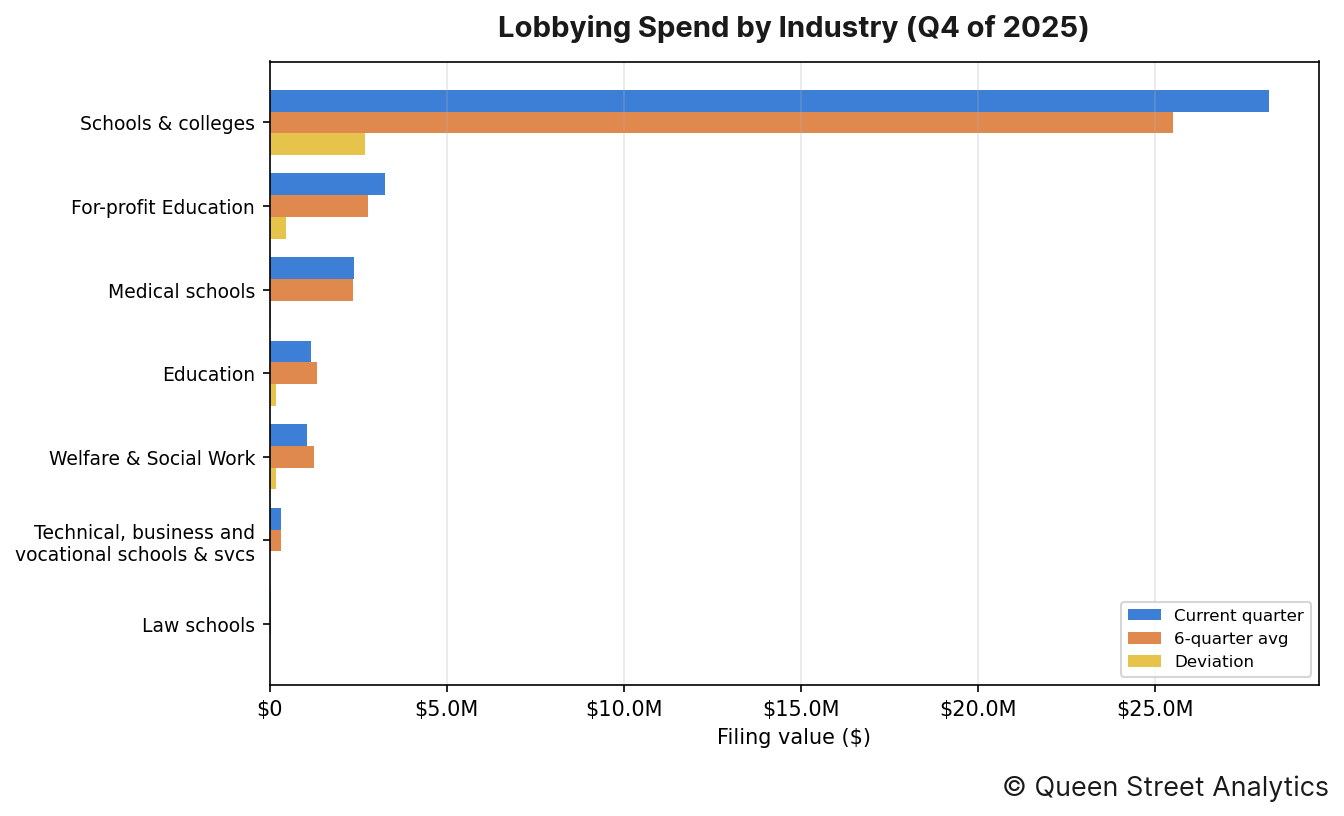
In Q4 of 2025, there was $36.3M worth of disclosed lobbying activity on Higher Ed, roughly in line with the recent quarterly average of $33.6M. This activity can be broken down by industry as follows:
↳ There was $28.2M worth of Schools & colleges lobbying, 11% higher than the recent quarterly average of $25.5M.
↳ There was $3.2M worth of For-profit Education lobbying, 17% higher than the recent quarterly average of $2.8M.
↳ There was $2.3M worth of Medical schools lobbying, roughly in line with the recent quarterly average of $2.4M.
↳ There was $1.2M worth of Education lobbying, 14% lower than the recent quarterly average of $1.3M.
↳ There was $1.1M worth of Welfare & Social Work lobbying, 15% lower than the recent quarterly average of $1.2M.
↳ There was $310k worth of Technical, business and vocational schools & svcs lobbying, roughly in line with the recent quarterly average of $332k.
Section B: Lobbying Spend Trend
This channel's total disclosed lobbying spend across recent quarters, aggregated over all of its industries.
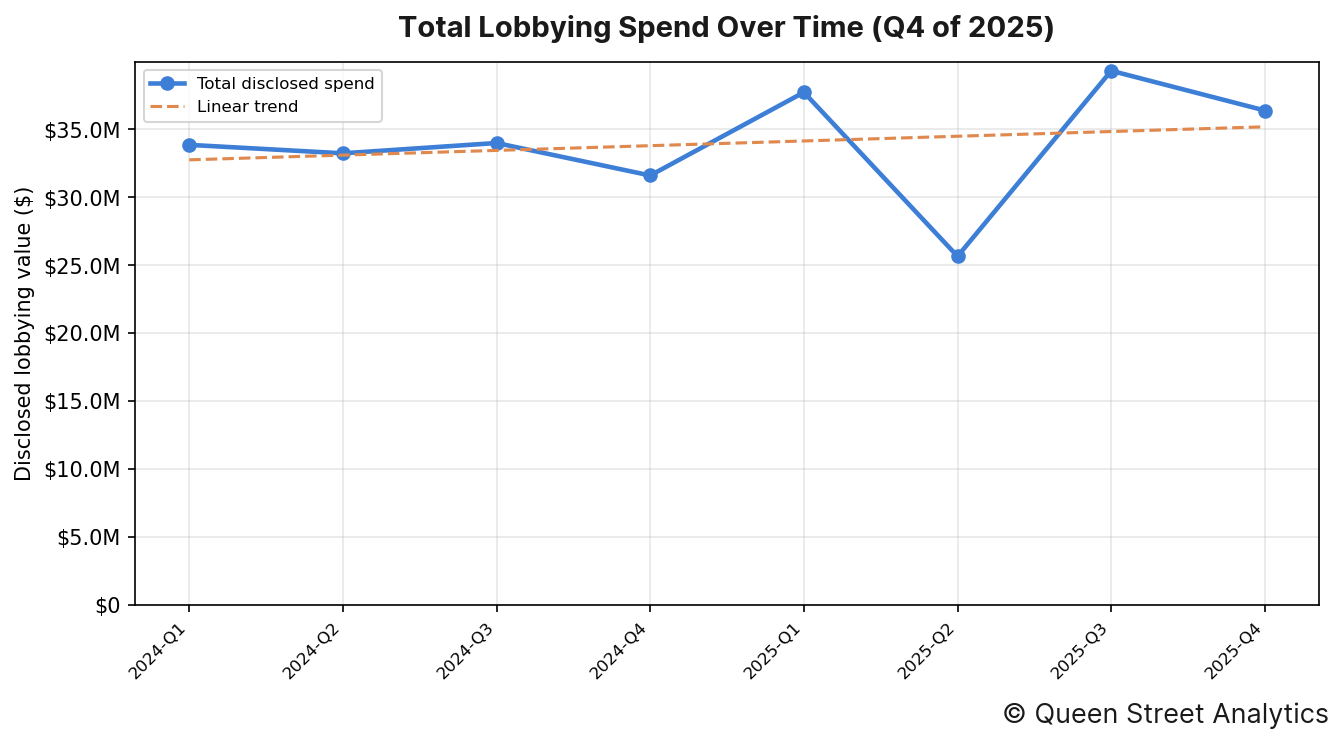
In Q4 of 2025, there was $36.3M worth of disclosed lobbying activity on Higher Ed. Across the 8 quarters shown, the channel's total disclosed spend has held roughly steady over this period.
Organizations' Lobby Spend
The image below shows the organizations whose lobbying spend moved most from their six-quarter average.
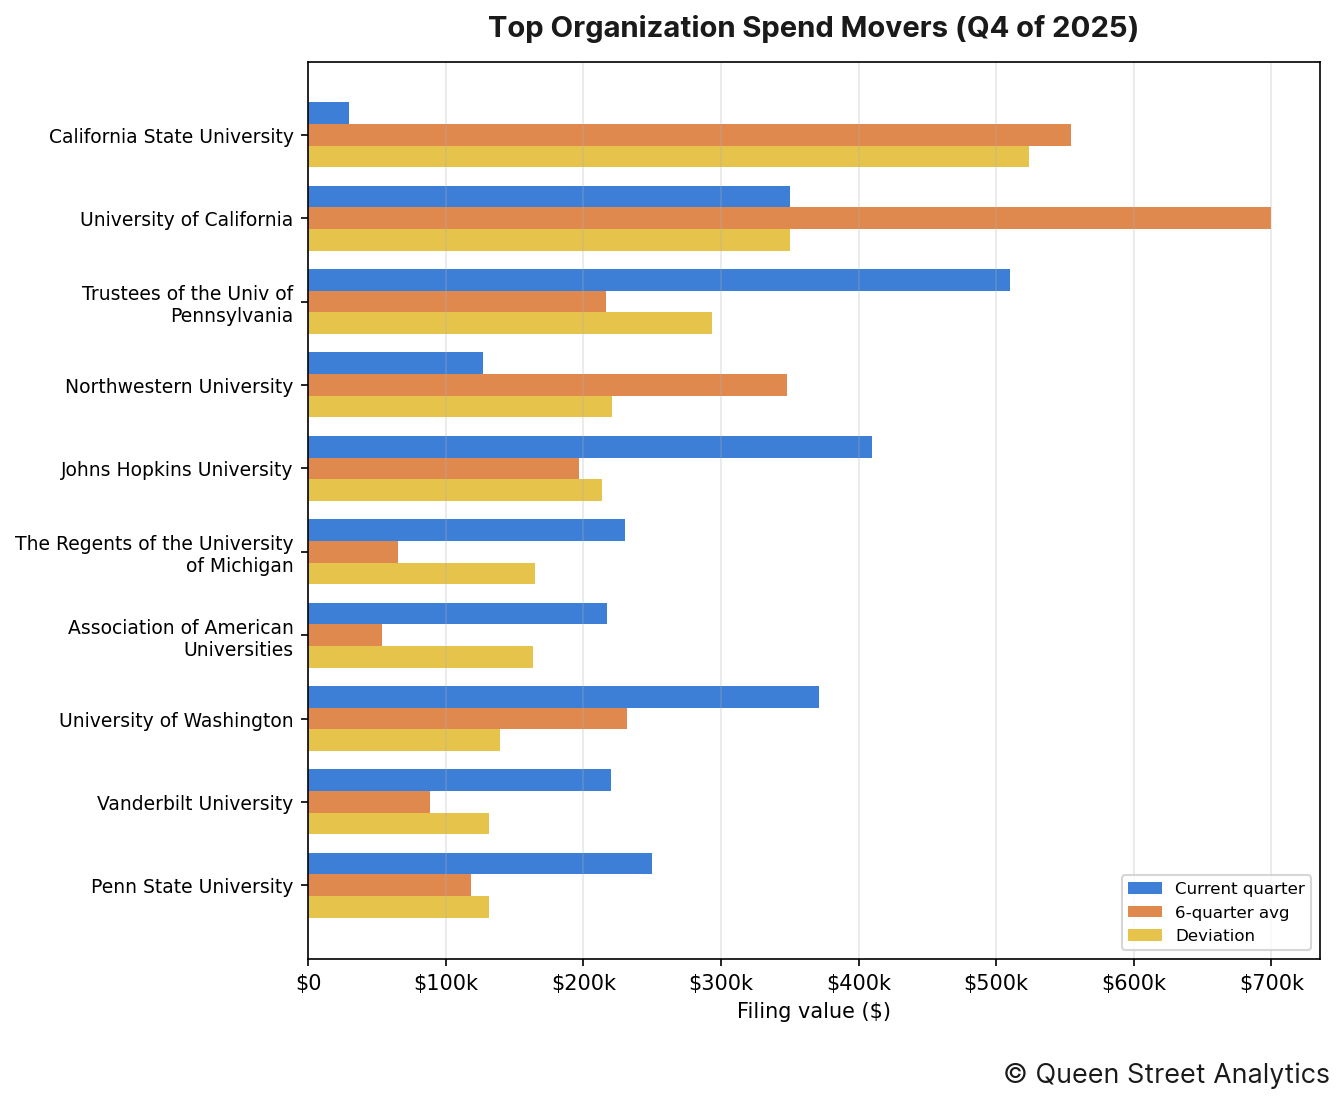
The organizations whose spending moved most from their own recent quarterly average were as follows:
↳ California State University accounted for $30k in disclosed lobbying, 95% lower than the recent quarterly average of $554k.
↳ University of California accounted for $350k in disclosed lobbying, 50% lower than the recent quarterly average of $700k.
↳ Trustees of the Univ of Pennsylvania accounted for $510k in disclosed lobbying, 135% higher than the recent quarterly average of $217k.
↳ Northwestern University accounted for $127k in disclosed lobbying, 63% lower than the recent quarterly average of $348k.
↳ Johns Hopkins University accounted for $410k in disclosed lobbying, 108% higher than the recent quarterly average of $197k.
↳ The Regents of the University of Michigan accounted for $230k in disclosed lobbying, 254% higher than the recent quarterly average of $65k.
Section D: Government Entities Lobbied
This section documents this quarter's most lobbied federal government departments.
By industry
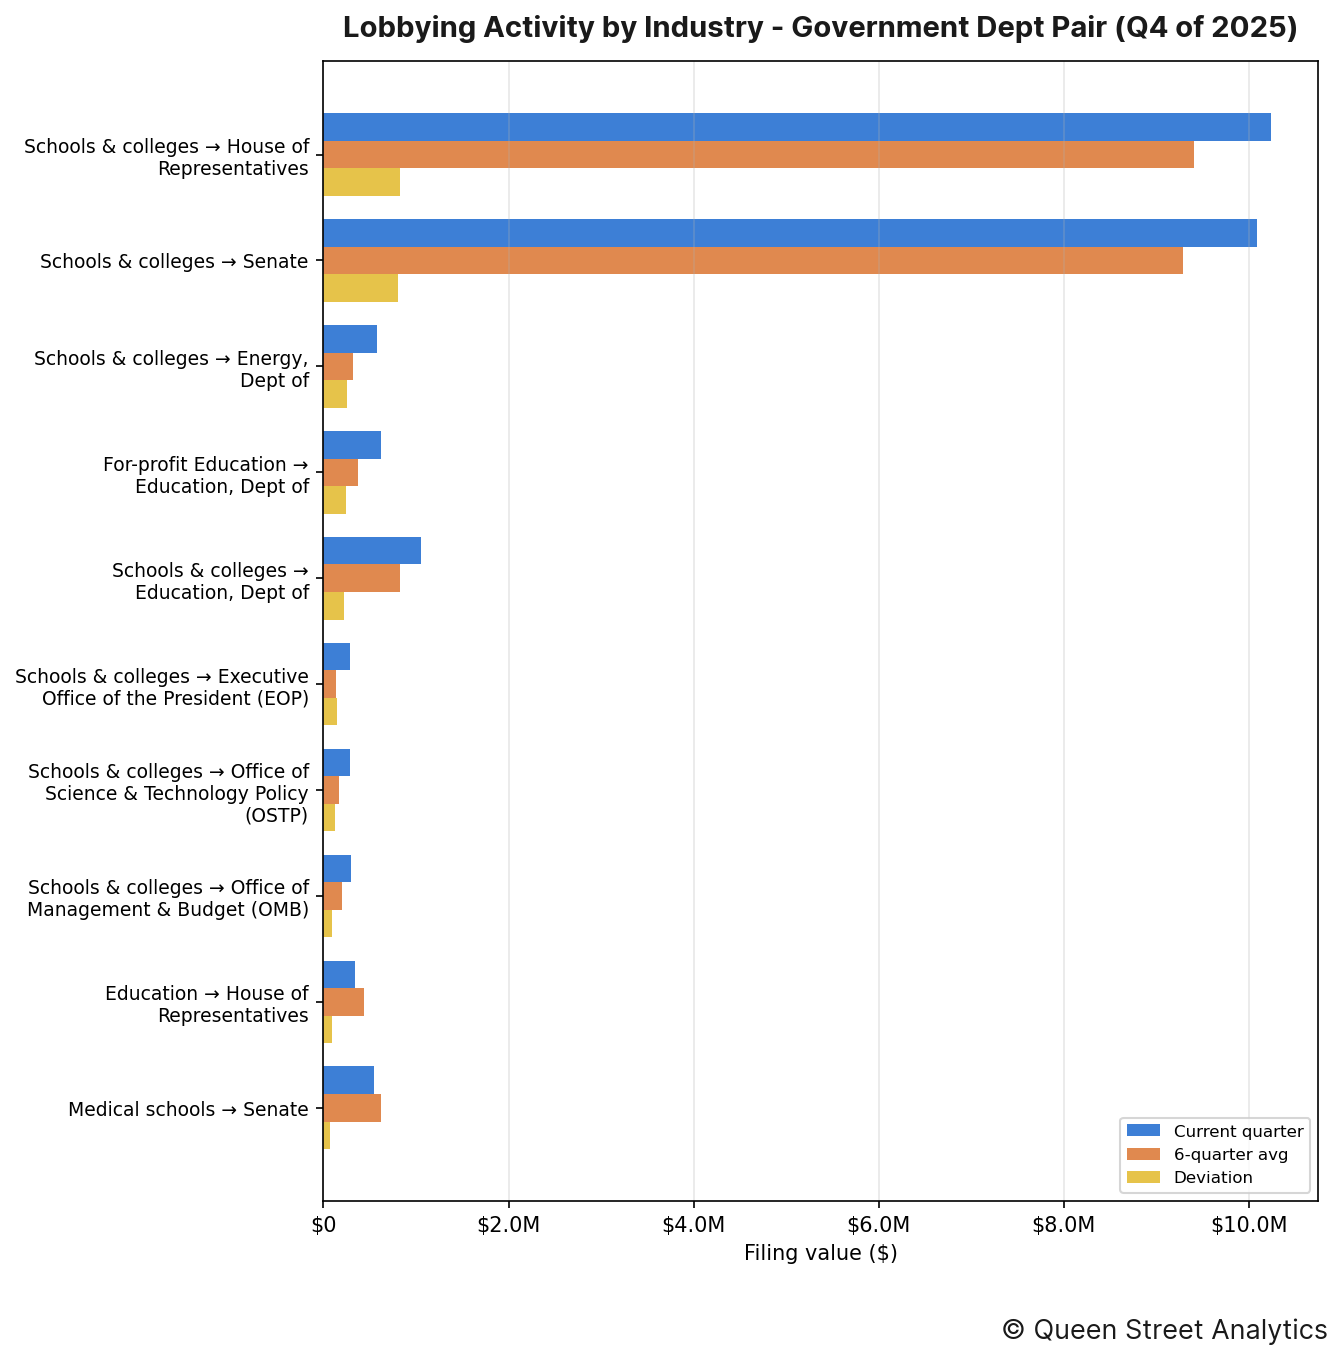
The industry–entity pairings that moved most this quarter were as follows:
↳ Schools & colleges directed $10.2M of lobbying toward House of Representatives, roughly in line with the recent quarterly average of $9.4M.
↳ Schools & colleges directed $10.1M of lobbying toward Senate, roughly in line with the recent quarterly average of $9.3M.
↳ Schools & colleges directed $583k of lobbying toward Dept of Energy, 80% higher than the recent quarterly average of $324k.
By organization
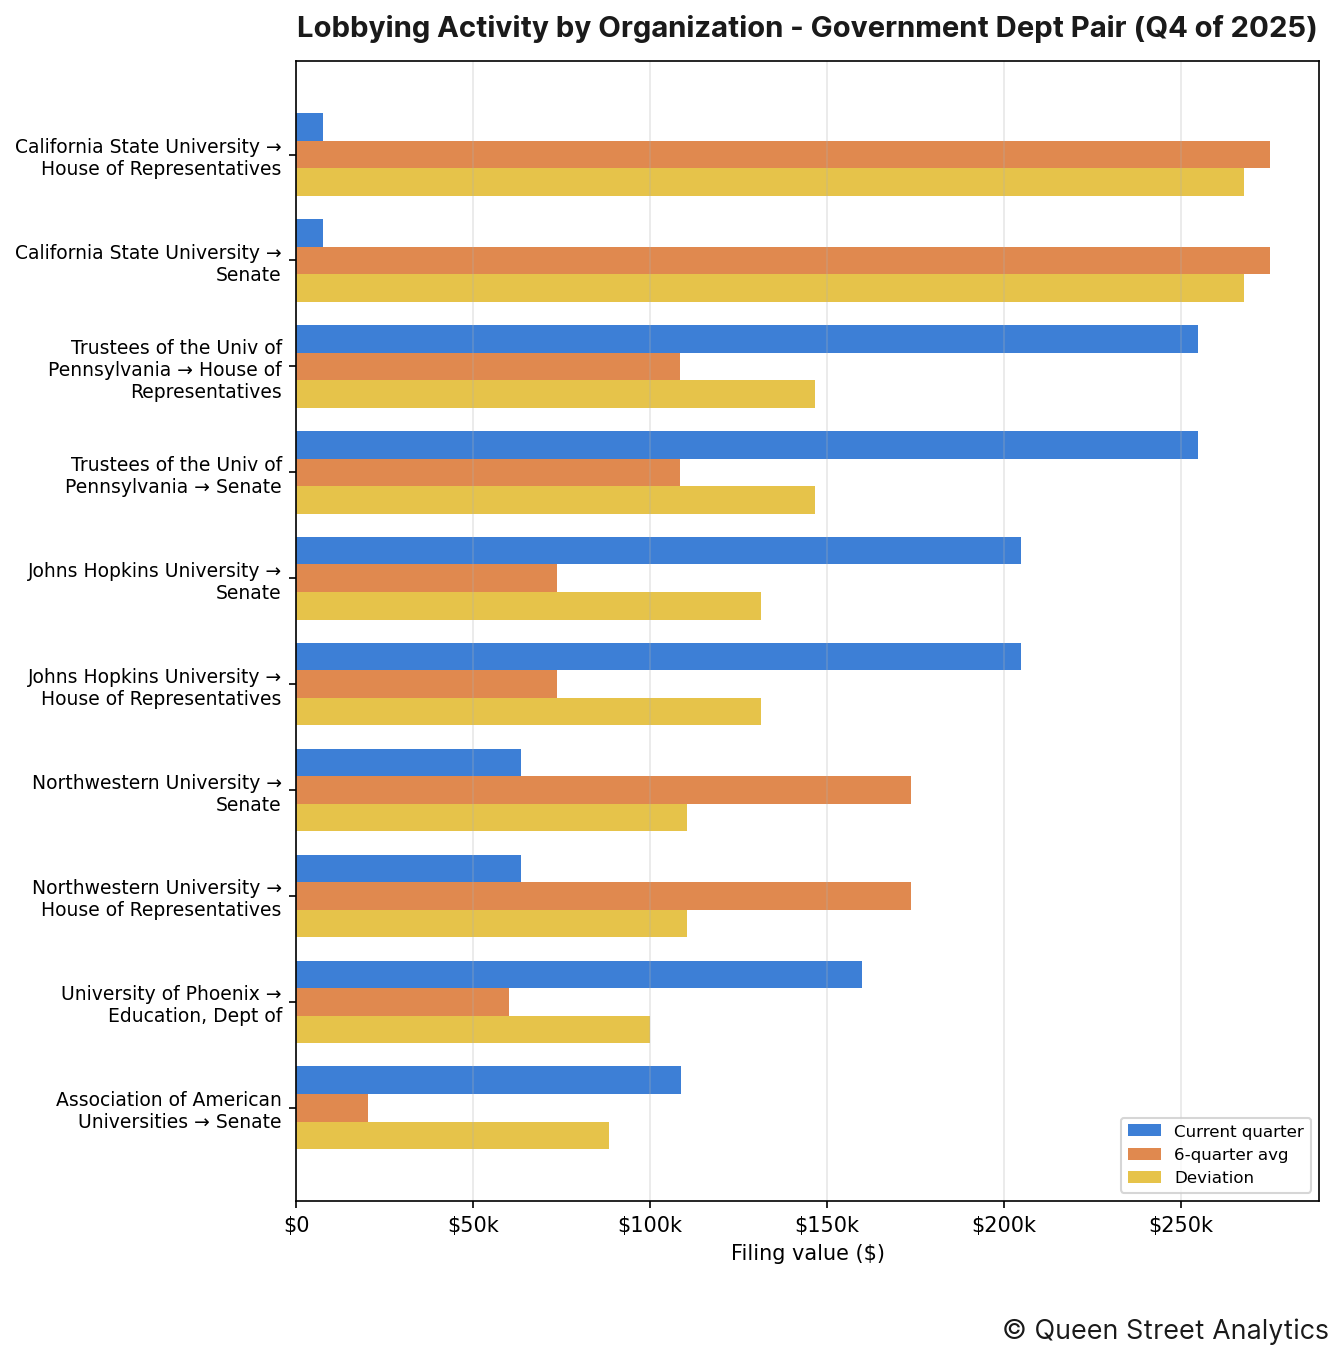
The organization–entity pairings that moved most this quarter were as follows:
↳ California State University directed $8k of lobbying toward House of Representatives, 97% lower than the recent quarterly average of $275k.
↳ California State University directed $8k of lobbying toward Senate, 97% lower than the recent quarterly average of $275k.
↳ Trustees of the Univ of Pennsylvania directed $255k of lobbying toward Senate, 135% higher than the recent quarterly average of $108k.
Section E: Lobbying Issues
This section documents this quarter's most lobbied-on issues.
By industry
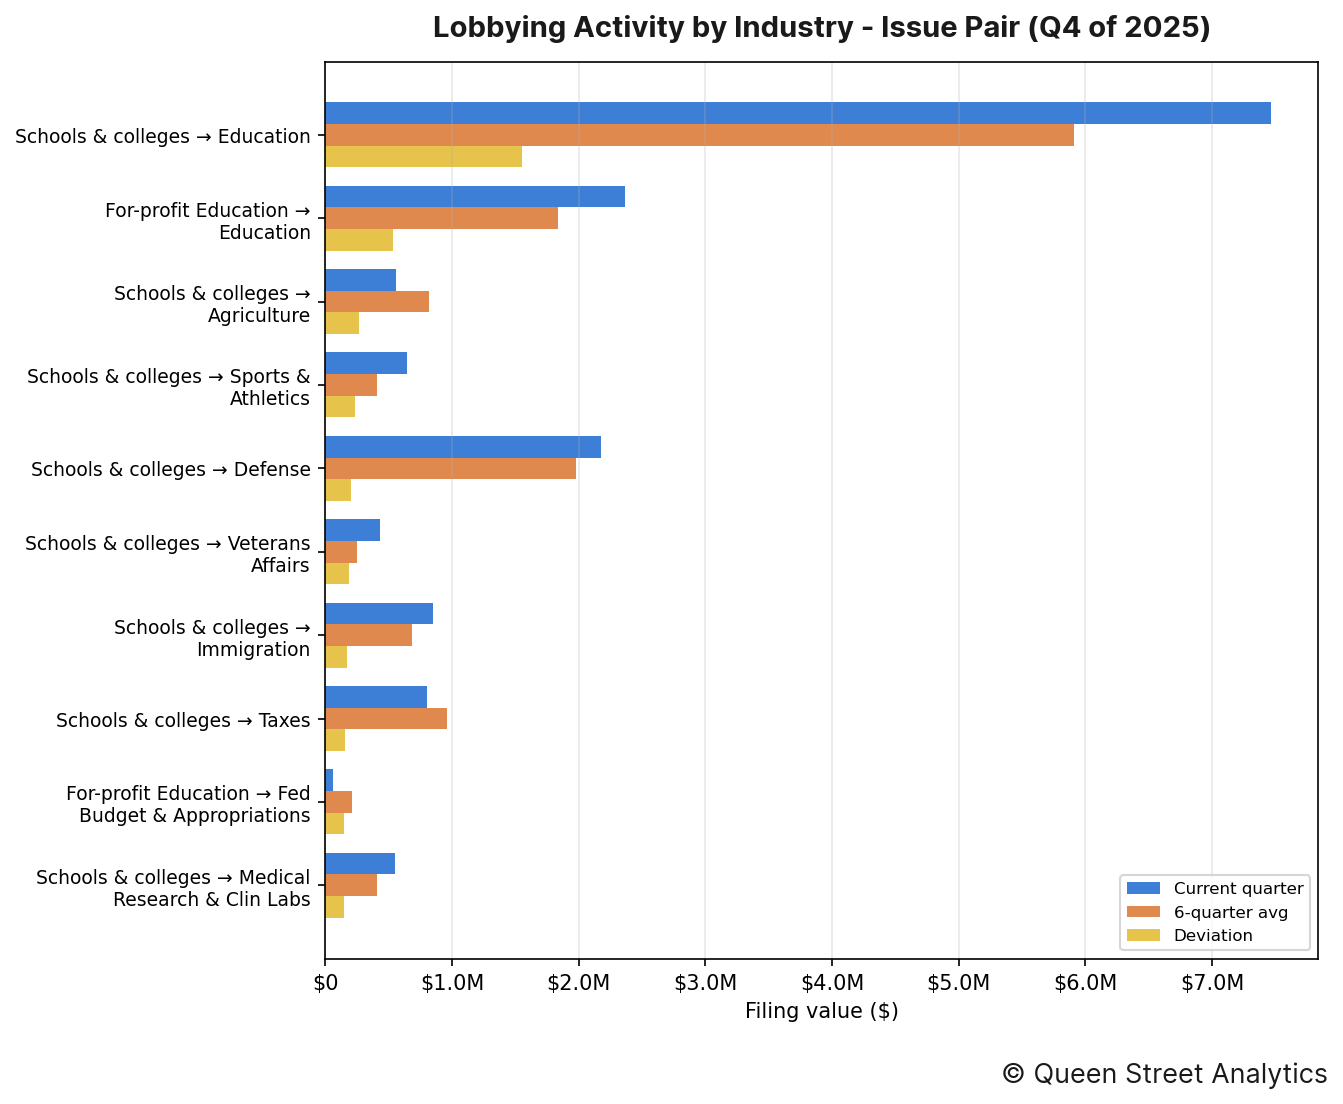
The industry–issue pairings that moved most this quarter were as follows:
↳ Schools & colleges put $7.5M toward lobbying on Education, 26% higher than the recent quarterly average of $5.9M.
↳ For-profit Education put $2.4M toward lobbying on Education, 29% higher than the recent quarterly average of $1.8M.
↳ Schools & colleges put $553k toward lobbying on Agriculture, 32% lower than the recent quarterly average of $817k.
By organization
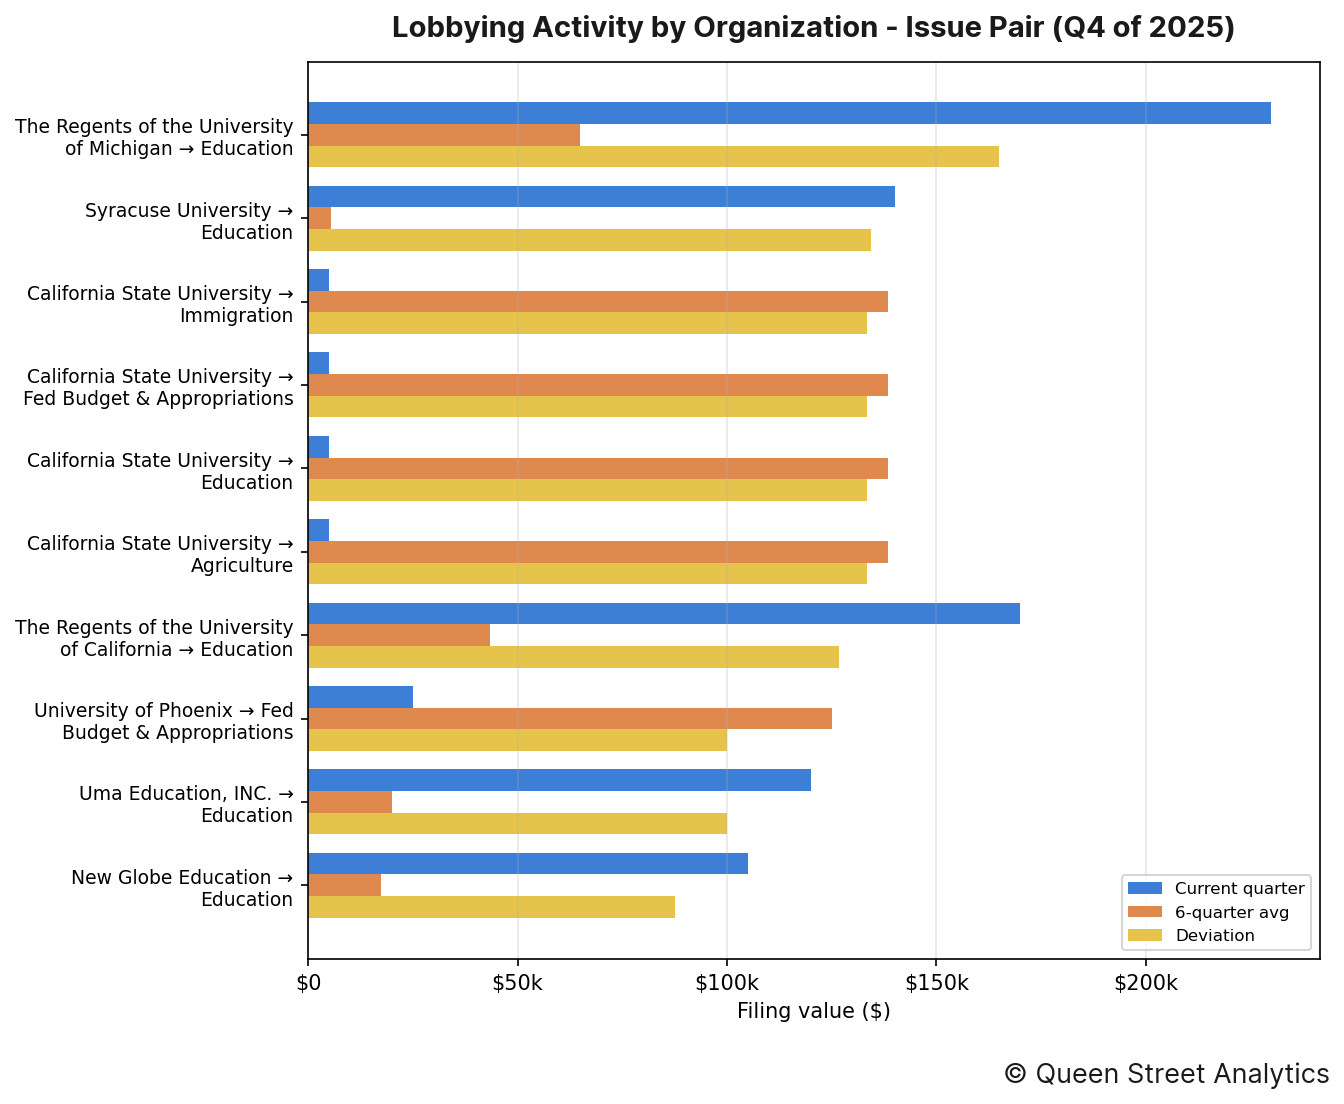
The organization–issue pairings that moved most this quarter were as follows:
↳ The Regents of the University of Michigan put $230k toward lobbying on Education, 254% higher than the recent quarterly average of $65k.
↳ Syracuse University put $140k toward lobbying on Education, 2420% higher than the recent quarterly average of $6k.
↳ California State University put $5k toward lobbying on Immigration, 96% lower than the recent quarterly average of $139k.
Section F: Most-Active Lobbyists
The figure below lists the lobbyists who managed the most imputed lobbying value this quarter, alongside their firm or organization. Because a filing's value is split evenly across the lobbyists it names, these dollar figures are imputed rather than directly disclosed.
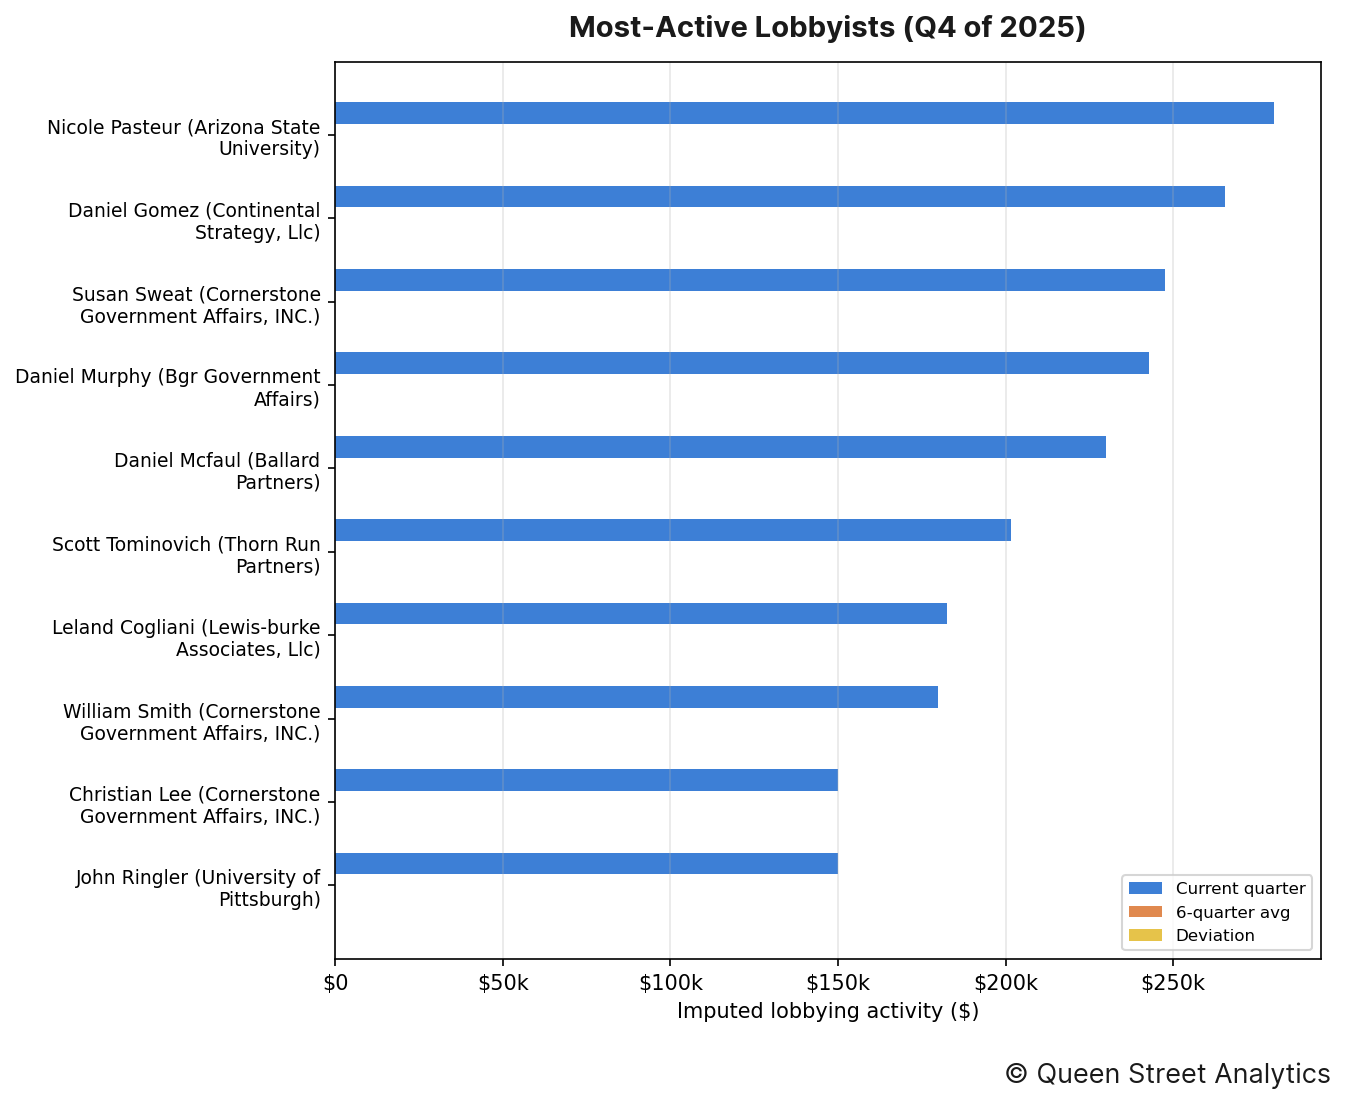
The lobbyists who managed the most imputed lobbying value this quarter were as follows:
↳ Nicole Pasteur (Arizona State University) was credited with an imputed $280k in lobbying activity.
↳ Daniel Gomez (Continental Strategy, Llc) was credited with an imputed $266k in lobbying activity.
↳ Susan Sweat (Cornerstone Government Affairs, INC) was credited with an imputed $248k in lobbying activity.
↳ Daniel Murphy (Bgr Government Affairs) was credited with an imputed $243k in lobbying activity.
↳ Daniel Mcfaul (Ballard Partners) was credited with an imputed $230k in lobbying activity.
Section G: Organization Network
The header image for this edition maps how this channel's organizations (neutral nodes) connect to the federal entities they lobbied (colored nodes) this quarter. A link's weight is the filing value directed to that entity, and node size reflects total value; the House and Senate are excluded (nearly every organization lobbies them) so the specialized targets stand out.
The most widely lobbied entity this quarter was Dept of Education, which was lobbied by 13 organizations.
Methodology
Every figure in this report starts from one number: the disclosed value of each lobbying filing, which we take as the income a registrant reported plus any in-house expenses (income + expenses) on its quarterly US Senate and House LDA disclosure. Before totalling anything we clean the filings — applying each amendment over the original it replaces, removing duplicates, and setting aside non-standard records such as registrations and terminations — and map every filing to a lobbying channel and industry using the organization's CRP industry code.
How the money is divided. A filing's full value counts once toward the organization that paid it and that organization's industry, so the industry and organization rankings (Sections A–C) reflect whole dollars. But a single filing usually names several government entities, several issue areas, and several lobbyists at once, and the disclosure never says how the fee was split among them. Rather than credit the full amount to each — which would count the same dollars over and over — we divide a filing's value evenly across the distinct items it names. So a $200,000 filing that lists four agencies contributes $50,000 to each in Section D, and the same even split is applied across issues in Section E and across lobbyists in Section F. That way every section's totals trace back to the same underlying money without double-counting.
Reading the movements. A “deviation” compares the quarter's value to the average of the prior six quarters, so a rise or fall is measured against an entity's own recent norm rather than against the rest of the field. Section B takes the wider view: it sums every industry into one channel total and plots it quarter by quarter, with a fitted line showing the overall direction of travel. Source: US Senate and House LDA disclosures.


