USA Lobbying on Healthcare - Washington (Q1 2026)





Pharmaceutical Research and Manufacturers of America; American Medical Association; American Hospital Association were unusually active lobbyists this quarter.
View the interactive network in Queen Street Analytics →
Each quarter we track movements in US federal lobbying, channel by channel. This edition covers Healthcare for Q1 of 2026, ranking the organizations, government entities, issues, and lobbyists whose disclosed spend moved most.
Central Themes in this Quarter’s Lobby Data
Coverage Uncertainty Rises as ACA Subsidies Expire
Early 2026 saw the expiration of enhanced Affordable Care Act premium tax credits, leading to rising premiums and potential lapses in coverage for millions. Hospitals and safety-net providers, alongside the American College of Physicians and the American College of Physician Services, INC., raised concerns about uncompensated care as lobbying surged to address funding gaps and coverage for vulnerable populations through engagements with the Centers For Medicare and Medicaid Services and the Centers For Disease Control & Prevention. Efforts to extend subsidy support faltered in Congress, heightening the policy’s relevance.
📎 Notable healthcare policies taking effect in 2026 - Becker's Hospital ... · Healthcare policy 2026: navigate change and challenges | EY - US · 2026 Legislative and Regulatory Outlook | Insights | Holland & Knight
“Big Beautiful Bill” Spurs Aggressive Restructuring and New Lobbying
The rollout of the 'One Big Beautiful Bill Act' (OBBBA) drove significant reforms spanning Medicaid, Medicare, and ACA payment models in Q1 2026. These reforms enacted work requirements and payment system changes, with the Rural Health Transformation Program beginning multi-billion dollar federal disbursements—sparking elevated advocacy from hospitals and rural health interests, including efforts by the American College of Physician Services, INC. and the American College of Physicians targeting the Centers For Medicare and Medicaid Services (CMS). Stakeholder lobbying reflected the need for statutory clarification and funding protections.
📎 McDermott+ 2026 healthcare preview: Key regulatory themes · 6 Key Federal Health Law Changes in 2025 and Their 2026 Impact · 4 “Big, Beautiful Bill” changes that will reshape care in 2026
Drug Price Negotiation and PBM Reform Ignite Industry Response
Medicare drug price negotiation and strict reforms on pharmacy benefit managers (PBMs) began in 2026, prompting a sharp spike in lobbying from major pharmaceutical and PBM stakeholders such as the American College of Physician Services, INC. and the American College of Physicians. Provisions included negotiated prices for select Part D drugs, a ban on spread pricing, and tighter transparency rules—issues prioritized by organizations like PhRMA and several drugmakers, as well as highlighted in recent filings involving entities such as the Centers For Medicare and Medicaid Services (CMS). Scrutiny of compliance and market impacts is expected to persist.
📎 Congress Advances FY 2026 HHS Appropriations Bill with Health Extenders ... · Healthcare policy 2026: navigate change and challenges | EY - US · 6 Key Federal Health Law Changes in 2025 and Their 2026 Impact
Hospitals Face New CMS Payment Models and Heightened Lobbying Activity
Hospitals and health systems contended with fresh CMS payment reforms—such as site-neutral payments and 340B Drug Program changes—finalized in Q1 2026. These shifts spurred advocacy, with organizations like the American College of Physician Services, INC. and the American College of Physicians focusing efforts toward the Centers For Medicare and Medicaid Services (CMS) and the Dept of Veterans Affairs (VA), centered on protecting reimbursement levels and seeking statutory clarity for children’s, veterans’, and front-line hospitals. Groups focused on transparency and modernization initiatives amid tight budget constraints.
📎 Notable healthcare policies taking effect in 2026 - Becker's Hospital ... · Healthcare policy 2026: navigate change and challenges | EY - US · Federal Health Policy: Key Developments to Watch in 2026
Health Data Privacy and Interoperability Regulation Looms
The OMB’s 2026 Unified Agenda previewed significant rulemaking on health privacy, data interoperability, and digital health, spurring waves of compliance-focused lobbying from groups such as the American College of Physician Services, INC. and the American College of Physicians before the Centers for Medicare and Medicaid Services (CMS) and the Centers For Disease Control & Prevention (CDC). Anticipated updates to HIPAA, data-sharing standards, and health technology regulations are on the horizon, with major advocacy groups seeking input on the evolving regulatory landscape. These proposals could reshape digital health practices in late 2026.
📎 OMB Publishes 2026 Unified Agenda Signaling Upcoming Health Privacy and ... · 6 Key Federal Health Law Changes in 2025 and Their 2026 Impact · Healthcare policy 2026: navigate change and challenges | EY - US

Section A: Lobbying Spend by Industry
How much each industry in this channel spent on federal lobbying in Q1 of 2026, compared with its average over the prior six quarters.
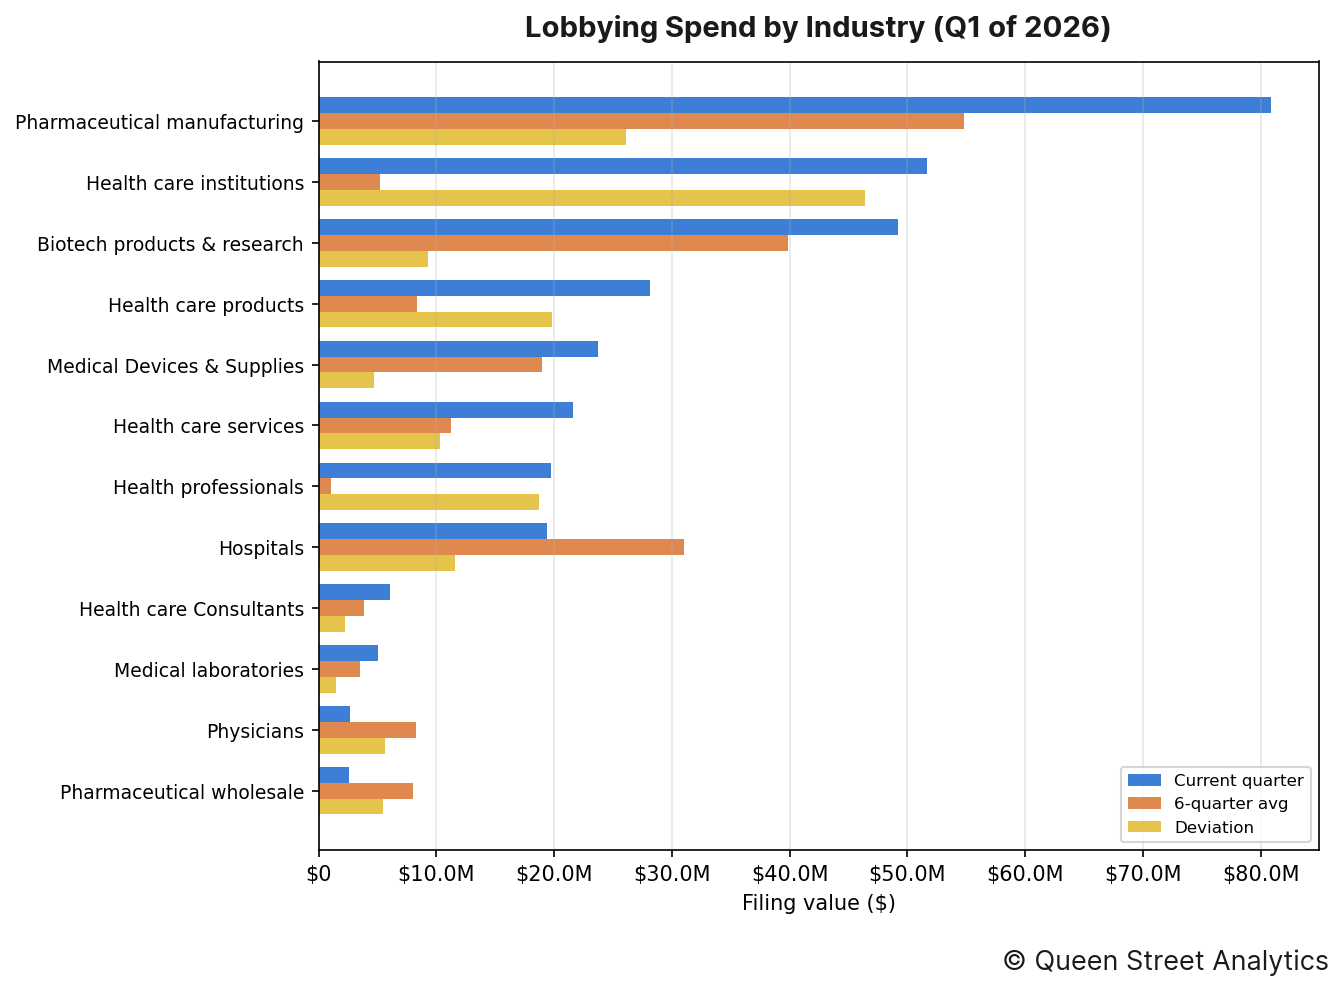
In Q1 of 2026, there was $325.3M worth of disclosed lobbying activity on Healthcare, 37% higher than the recent quarterly average of $237.9M. This activity can be broken down by industry as follows:
↳ There was $80.9M worth of Pharmaceutical manufacturing lobbying, 48% higher than the recent quarterly average of $54.8M.
↳ There was $51.6M worth of Health care institutions lobbying, 887% higher than the recent quarterly average of $5.2M.
↳ There was $49.2M worth of Biotech products & research lobbying, 23% higher than the recent quarterly average of $39.9M.
↳ There was $28.1M worth of Health care products lobbying, 237% higher than the recent quarterly average of $8.3M.
↳ There was $23.7M worth of Medical Devices & Supplies lobbying, 25% higher than the recent quarterly average of $19.0M.
↳ There was $21.6M worth of Health care services lobbying, 92% higher than the recent quarterly average of $11.3M.
Section B: Lobbying Spend Trend
This channel's total disclosed lobbying spend across recent quarters, aggregated over all of its industries.
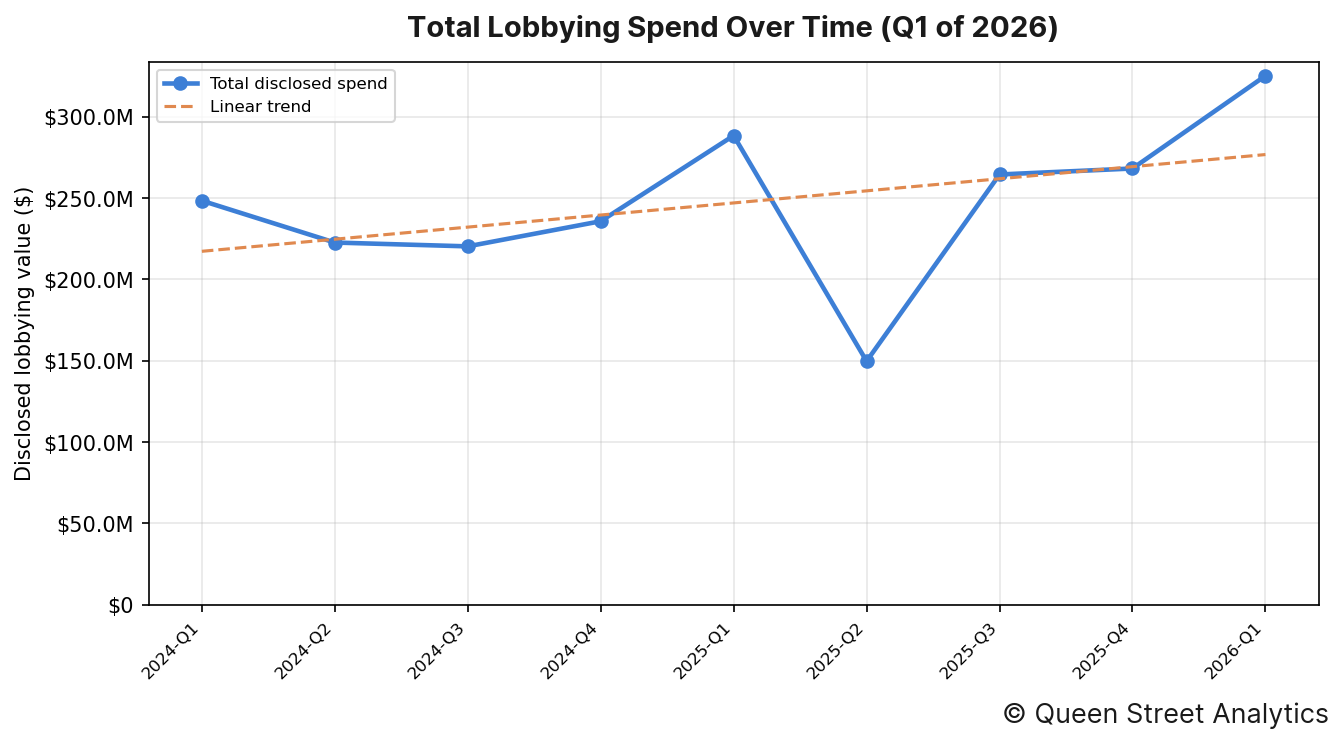
In Q1 of 2026, there was $325.3M worth of disclosed lobbying activity on Healthcare. Across the 9 quarters shown, the channel's total disclosed spend has risen over this period.
Organizations' Lobby Spend
The image below shows the organizations whose lobbying spend moved most from their six-quarter average.
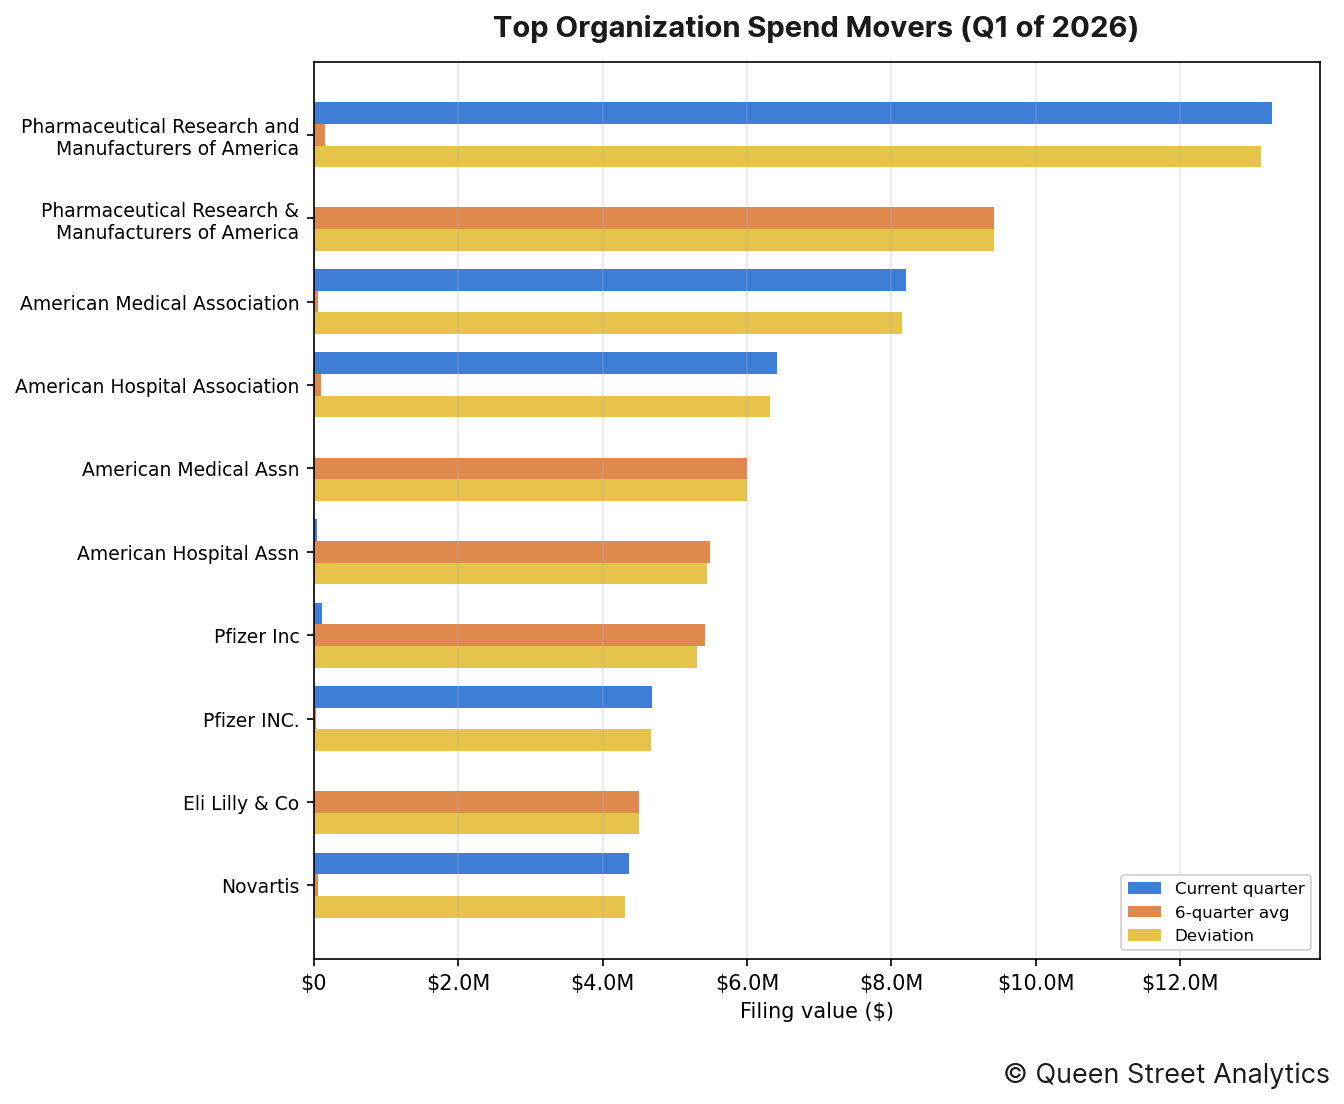
The organizations whose spending moved most from their own recent quarterly average were as follows:
↳ Pharmaceutical Research and Manufacturers of America accounted for $13.3M in disclosed lobbying, 8948% higher than the recent quarterly average of $147k.
↳ Pharmaceutical Research & Manufacturers of America accounted for $0 in disclosed lobbying, 100% lower than the recent quarterly average of $9.4M.
↳ American Medical Association accounted for $8.2M in disclosed lobbying, 13583% higher than the recent quarterly average of $60k.
↳ American Hospital Association accounted for $6.4M in disclosed lobbying, 6647% higher than the recent quarterly average of $95k.
↳ American Medical Assn accounted for $0 in disclosed lobbying, 100% lower than the recent quarterly average of $6.0M.
↳ American Hospital Assn accounted for $40k in disclosed lobbying, 99% lower than the recent quarterly average of $5.5M.
Section D: Government Entities Lobbied
This section documents this quarter's most lobbied federal government departments.
By industry
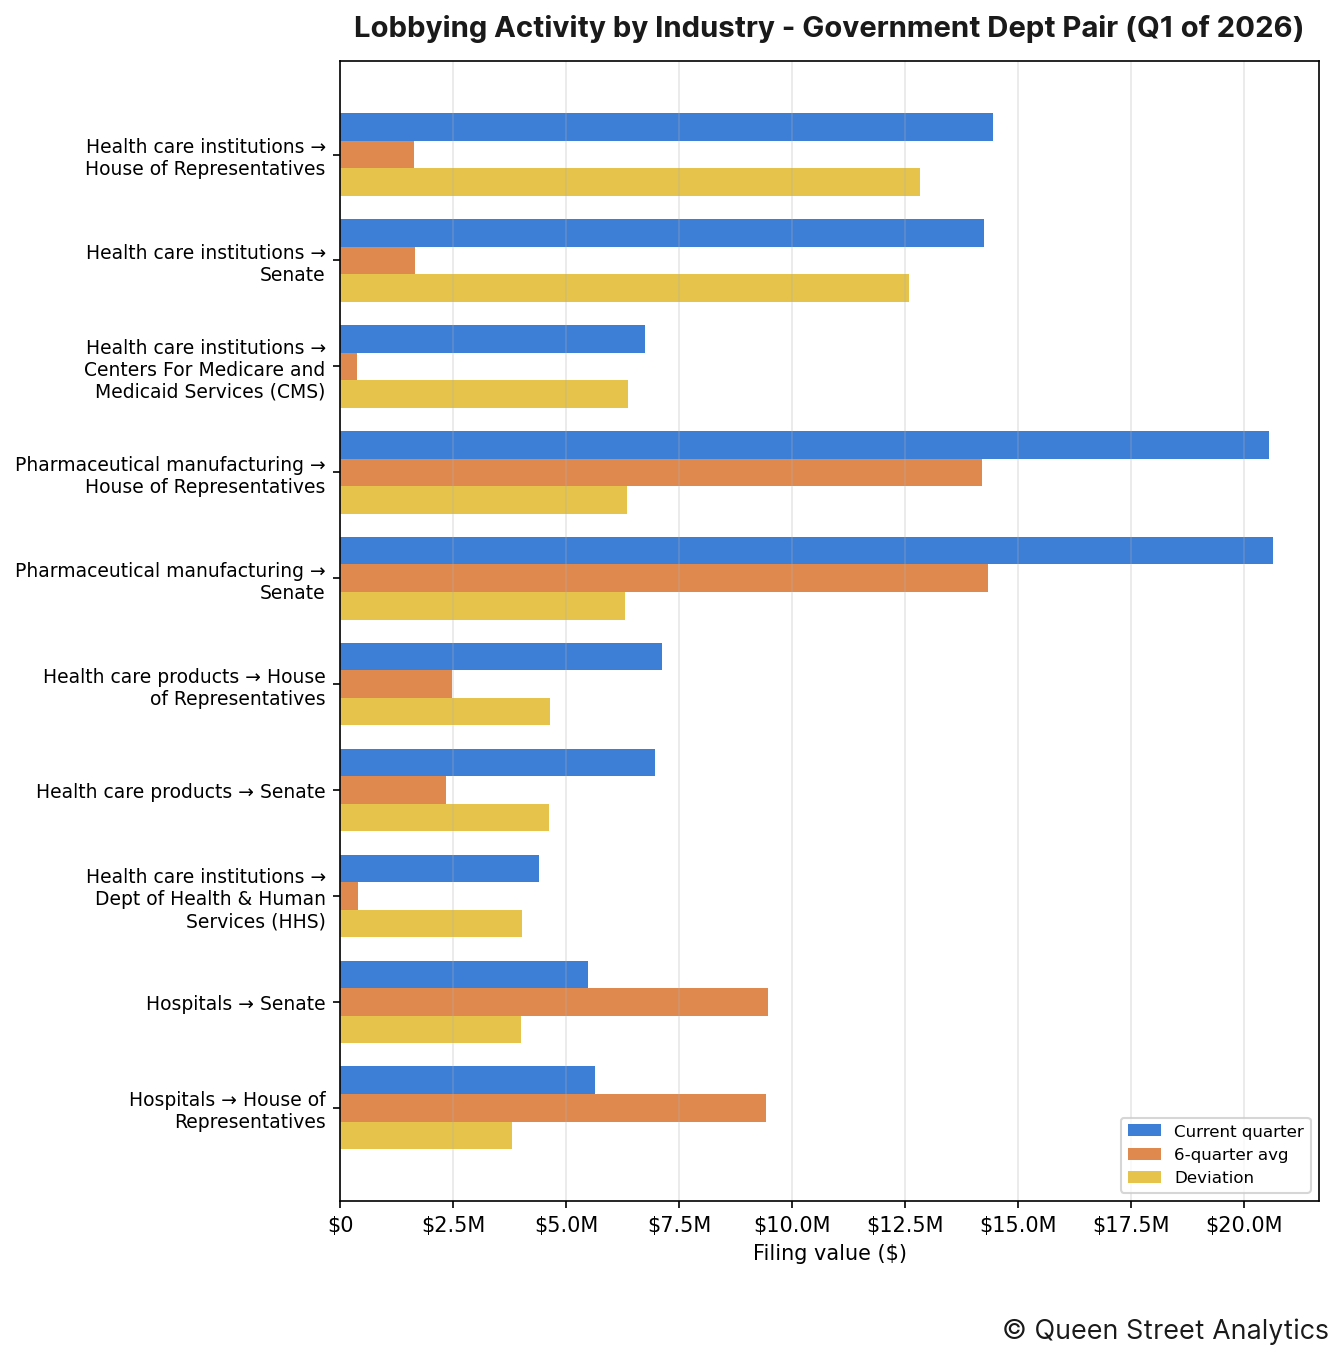
The industry–entity pairings that moved most this quarter were as follows:
↳ Health care institutions directed $14.5M of lobbying toward House of Representatives, 786% higher than the recent quarterly average of $1.6M.
↳ Health care institutions directed $14.2M of lobbying toward Senate, 763% higher than the recent quarterly average of $1.7M.
↳ Health care institutions directed $6.7M of lobbying toward Centers For Medicare and Medicaid Services (CMS), 1708% higher than the recent quarterly average of $373k.
By organization
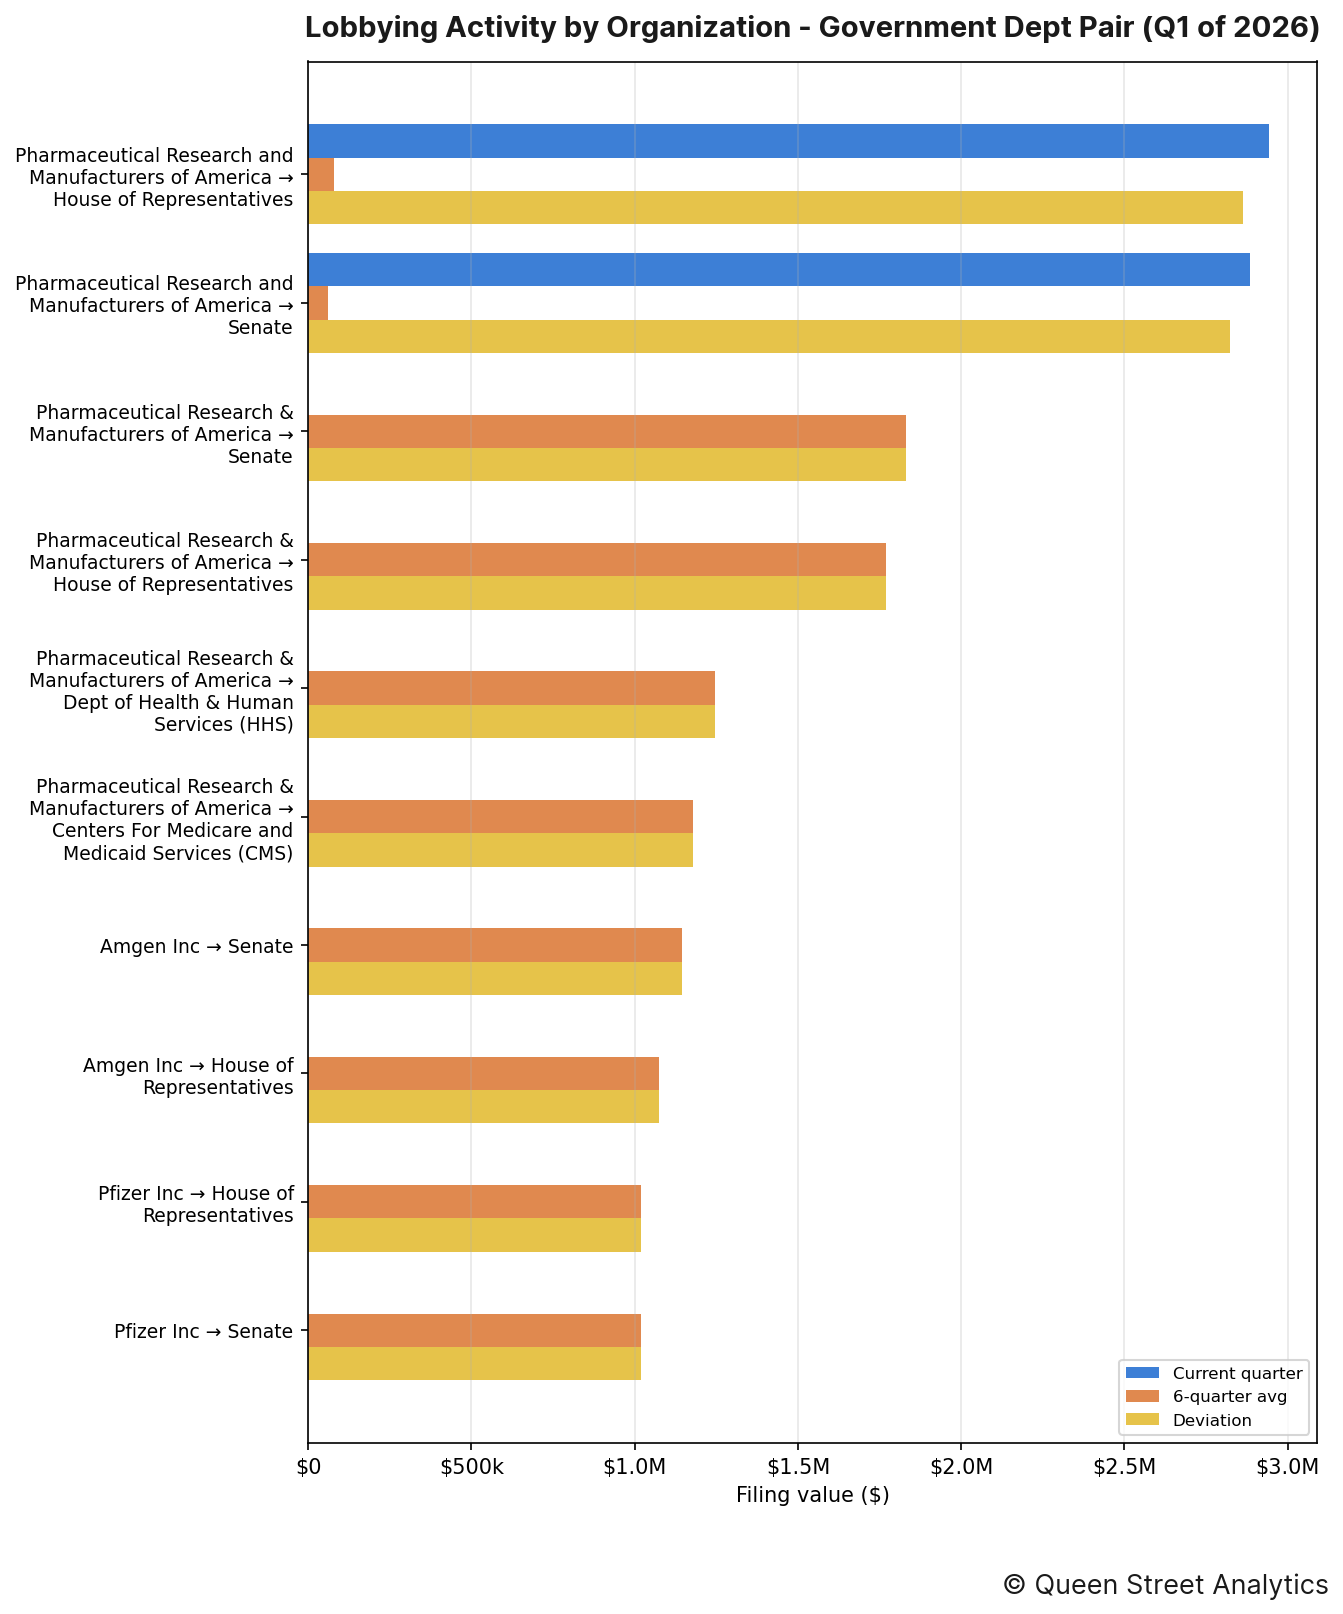
The organization–entity pairings that moved most this quarter were as follows:
↳ Pharmaceutical Research and Manufacturers of America directed $2.9M of lobbying toward House of Representatives, 3580% higher than the recent quarterly average of $80k.
↳ Pharmaceutical Research and Manufacturers of America directed $2.9M of lobbying toward Senate, 4640% higher than the recent quarterly average of $61k.
↳ Pharmaceutical Research & Manufacturers of America directed $0 of lobbying toward Senate, 100% lower than the recent quarterly average of $1.8M.
Section E: Lobbying Issues
This section documents this quarter's most lobbied-on issues.
By industry
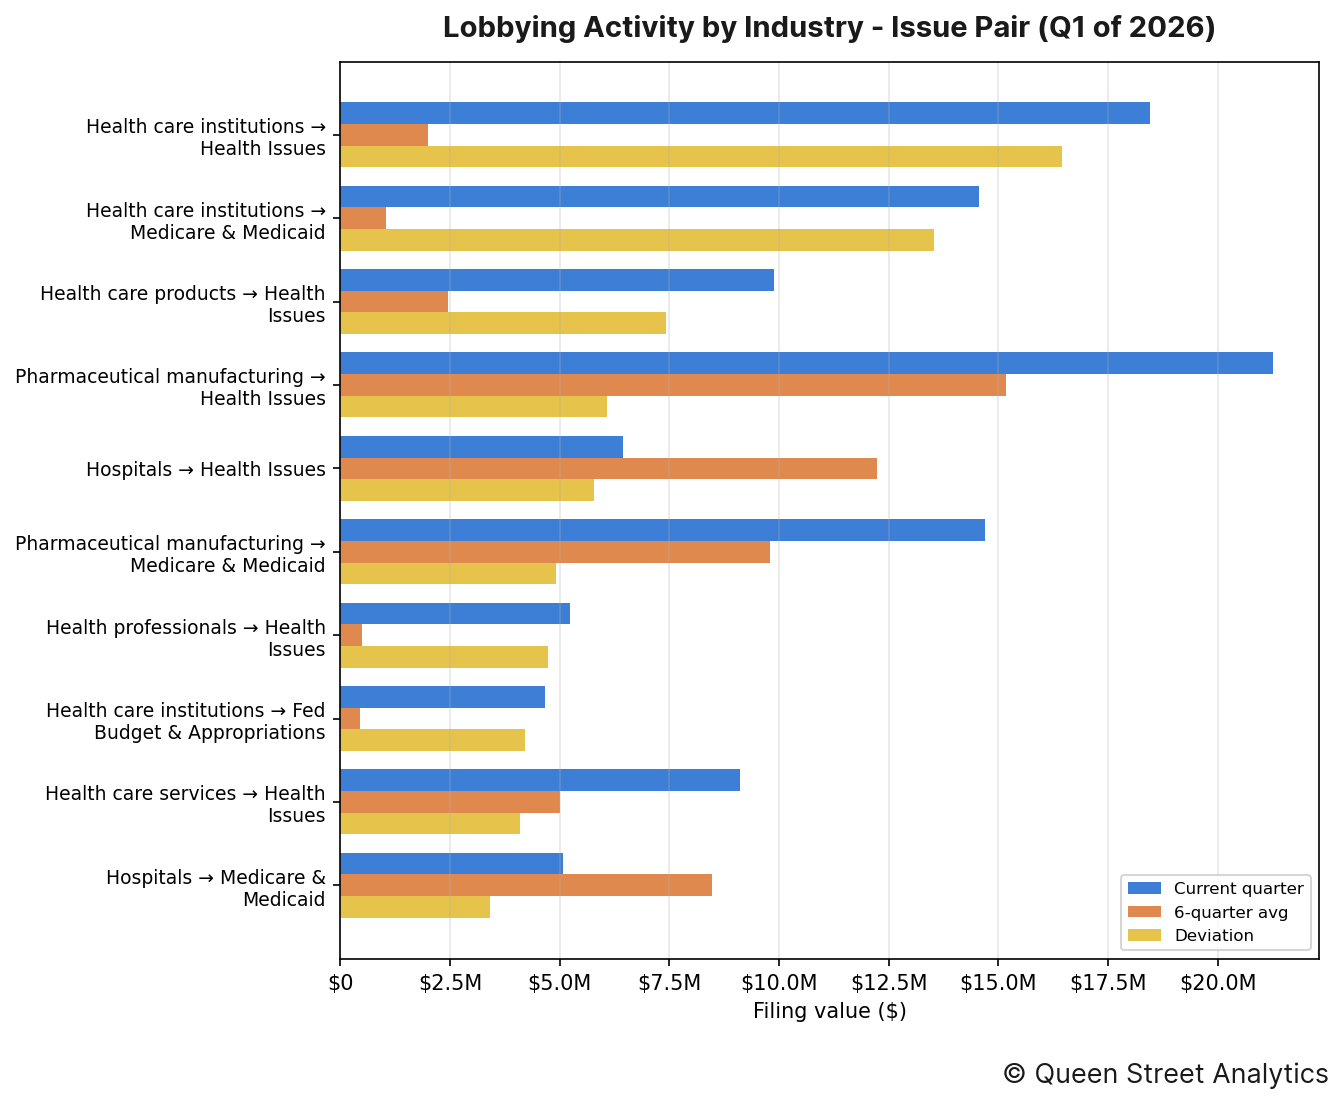
The industry–issue pairings that moved most this quarter were as follows:
↳ Health care institutions put $18.4M toward lobbying on Health Issues, 823% higher than the recent quarterly average of $2.0M.
↳ Health care institutions put $14.6M toward lobbying on Medicare & Medicaid, 1311% higher than the recent quarterly average of $1.0M.
↳ Health care products put $9.9M toward lobbying on Health Issues, 304% higher than the recent quarterly average of $2.4M.
By organization
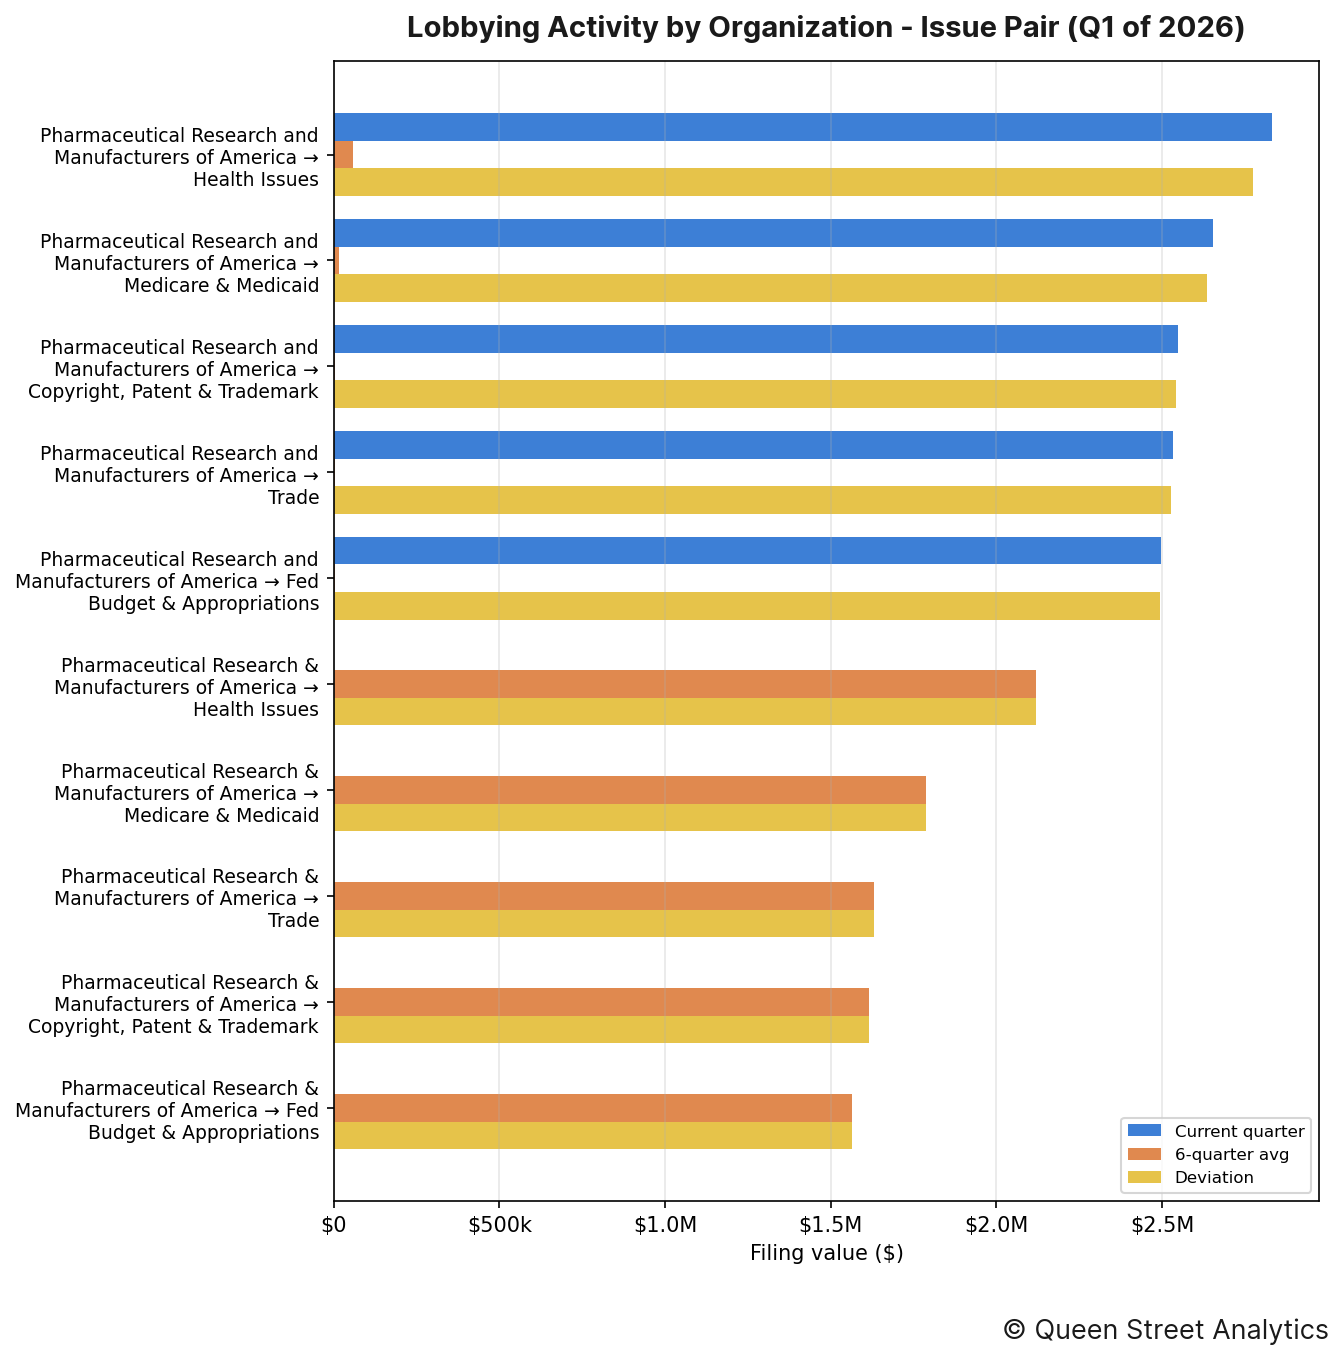
The organization–issue pairings that moved most this quarter were as follows:
↳ Pharmaceutical Research and Manufacturers of America put $2.8M toward lobbying on Health Issues, 4797% higher than the recent quarterly average of $58k.
↳ Pharmaceutical Research and Manufacturers of America put $2.7M toward lobbying on Medicare & Medicaid, 16287% higher than the recent quarterly average of $16k.
↳ Pharmaceutical Research and Manufacturers of America put $2.5M toward lobbying on Copyright, Patent & Trademark, 47433% higher than the recent quarterly average of $5k.
Section F: Most-Active Lobbyists
The figure below lists the lobbyists who managed the most imputed lobbying value this quarter, alongside their firm or organization. Because a filing's value is split evenly across the lobbyists it names, these dollar figures are imputed rather than directly disclosed.
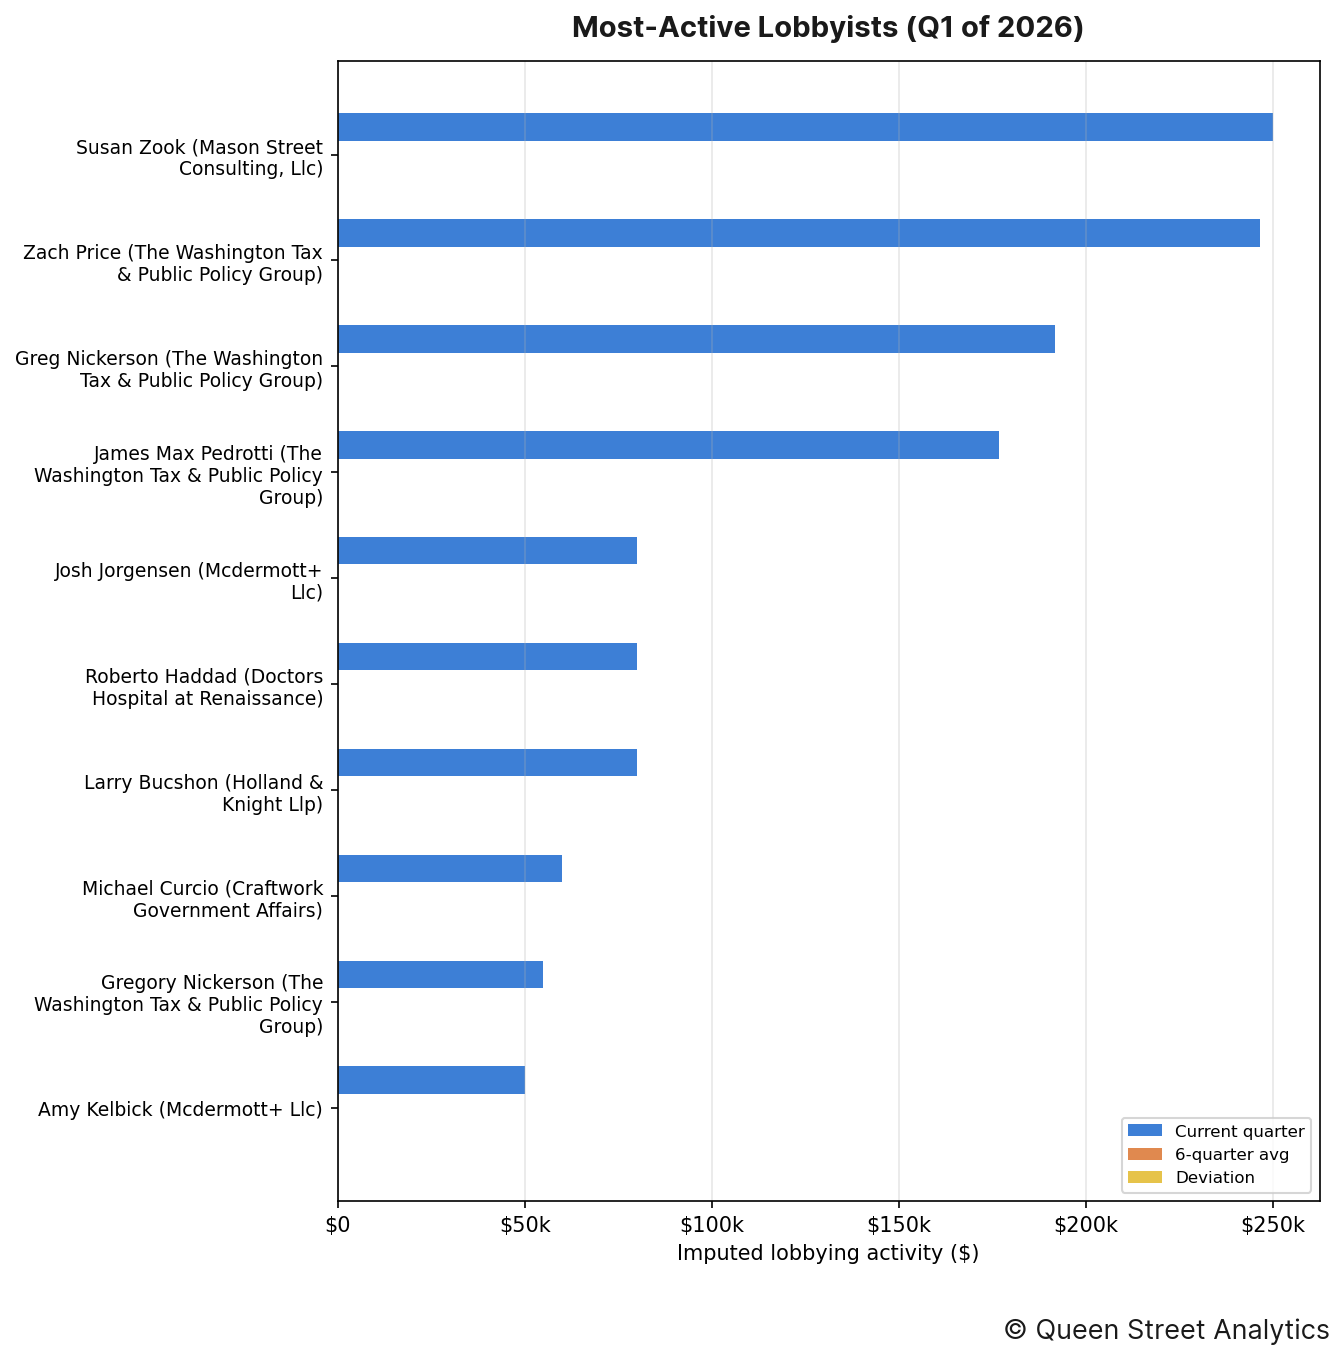
The lobbyists who managed the most imputed lobbying value this quarter were as follows:
↳ Susan Zook (Mason Street Consulting, Llc) was credited with an imputed $250k in lobbying activity.
↳ Zach Price (The Washington Tax & Public Policy Group) was credited with an imputed $247k in lobbying activity.
↳ Greg Nickerson (The Washington Tax & Public Policy Group) was credited with an imputed $192k in lobbying activity.
↳ James Max Pedrotti (The Washington Tax & Public Policy Group) was credited with an imputed $177k in lobbying activity.
↳ Josh Jorgensen (Mcdermott+ Llc) was credited with an imputed $80k in lobbying activity.
Section G: Organization Network
The header image for this edition maps how this channel's organizations (neutral nodes) connect to the federal entities they lobbied (colored nodes) this quarter. A link's weight is the filing value directed to that entity, and node size reflects total value; the House and Senate are excluded (nearly every organization lobbies them) so the specialized targets stand out.
The most widely lobbied entity this quarter was Dept of Health & Human Services (HHS), which was lobbied by 19 organizations.
Methodology
Every figure in this report starts from one number: the disclosed value of each lobbying filing, which we take as the income a registrant reported plus any in-house expenses (income + expenses) on its quarterly US Senate and House LDA disclosure. Before totalling anything we clean the filings — applying each amendment over the original it replaces, removing duplicates, and setting aside non-standard records such as registrations and terminations — and map every filing to a lobbying channel and industry using the organization's CRP industry code.
How the money is divided. A filing's full value counts once toward the organization that paid it and that organization's industry, so the industry and organization rankings (Sections A–C) reflect whole dollars. But a single filing usually names several government entities, several issue areas, and several lobbyists at once, and the disclosure never says how the fee was split among them. Rather than credit the full amount to each — which would count the same dollars over and over — we divide a filing's value evenly across the distinct items it names. So a $200,000 filing that lists four agencies contributes $50,000 to each in Section D, and the same even split is applied across issues in Section E and across lobbyists in Section F. That way every section's totals trace back to the same underlying money without double-counting.
Reading the movements. A “deviation” compares the quarter's value to the average of the prior six quarters, so a rise or fall is measured against an entity's own recent norm rather than against the rest of the field. Section B takes the wider view: it sums every industry into one channel total and plots it quarter by quarter, with a fitted line showing the overall direction of travel. Source: US Senate and House LDA disclosures.