USA Lobbying on Environment - Washington (Q3 2026)


Waste Connections Us INC, Republic Services INC, Wastewater Action Alliance, Reworld Waste Llc, Ashbritt INC, and Packers Sanitation Services were unusually active lobbyists this quarter.
View the interactive network in Queen Street Analytics →
Each quarter we track movements in US federal lobbying, channel by channel. This edition covers Environment for Q3 of 2026, ranking the organizations, government entities, issues, and lobbyists whose disclosed spend moved most.
Central Themes in this Quarter’s Lobby Data
EPA Rule Change Spurs Waste Sector Engagement on Biogas and RFS Eligibility
Regulatory adjustments in the 2026–2027 Renewable Fuel Standard, notably clarifying biogas eligibility and removing eRINs, appear to have triggered intensified advocacy from waste industry stakeholders including Waste Connections Us, INC., Waste Management Inc, Covanta Energy Corp, and Reworld Waste, Llc, who each engaged directly with the Environmental Protection Agency (EPA), the House of Representatives, and the Senate. Waste firms and landfill operators reportedly ramped up their engagement with the EPA to shape these outcomes, aligning with marked increases in lobbying spend and explicit filings connected to landfill gas and biogas project rules.
📎 EPA - Final Renewable Fuel Standards for 2026 and 2027 · EPA Regulations Docket · ENERGY AND WATER DEVELOPMENT APPROPRIATIONS FOR FISCAL YEAR 2026
PFAS 'Passive Receiver' Liability Debates Draw Strong Waste Sector Advocacy
Waste and water utilities, including California Assn of Sanitation Agencies and Republic Services, INC., lobbied heavily for CERCLA liability protections related to PFAS before both the House of Representatives and the Senate, as Congressional hearings and stakeholder letters highlighted potential regulatory and investment impacts. Advocacy coincided with Congressional advancement of bills like H.R. 1267 and public debate about whether 'passive receivers' should face Superfund liability, with lobbying filings from organizations such as Waste Management Inc and Republic Services, INC. directly tied to these developments.
📎 U.S. Conference of Mayors Letter - May 2026 · Waste Dive - PFAS Hearing Coverage · NACo - Congress Examines PFAS Liability · Energy and Water Development: FY2026 Appropriations
Federal Appropriations Boost Water and Waste Infrastructure, Fueling Sector Lobbying
Expanded and sustained federal funding for water and wastewater infrastructure in the FY2026 Energy and Water Development Appropriations bill correlates with a notable uptrend in targeted lobbying. Waste sector clients, such as Waste Control Specialists Inc, and wastewater advocacy groups including Tri-city Regional Sanitary District and Central Contra Costa Sanitary District, mention appropriations advocacy with the House of Representatives and Senate in filings, possibly seeking to shape grant distribution and program priorities tied to recent Congressional earmarks.
📎 Energy and Water Development: FY2026 Appropriations · FY26 EWD Bill Report - appropriations.senate.gov · H.R. 4553: Energy and Water Development and Related Agencies ...
Legislative Push for Permitting Reform and Wipe Labeling Drives Issue-Focused Lobbying
Lobbying filings spotlight support for permitting reform and labeling regulation, referencing specific bills like the PERMIT Act and WIPPES Act, as seen in advocacy by the California Assn of Sanitation Agencies to the House of Representatives and Senate. This advocacy coincides with increased federal legislative attention to environmental permitting and labeling issues—suggesting alignment between sector priorities and Congressional activity in 2026.
📎 Congress.gov - PERMIT Act · Congress.gov - WIPPES Act

Section A: Lobbying Spend by Industry
How much each industry in this channel spent on federal lobbying in Q3 of 2026, compared with its average over the prior six quarters.
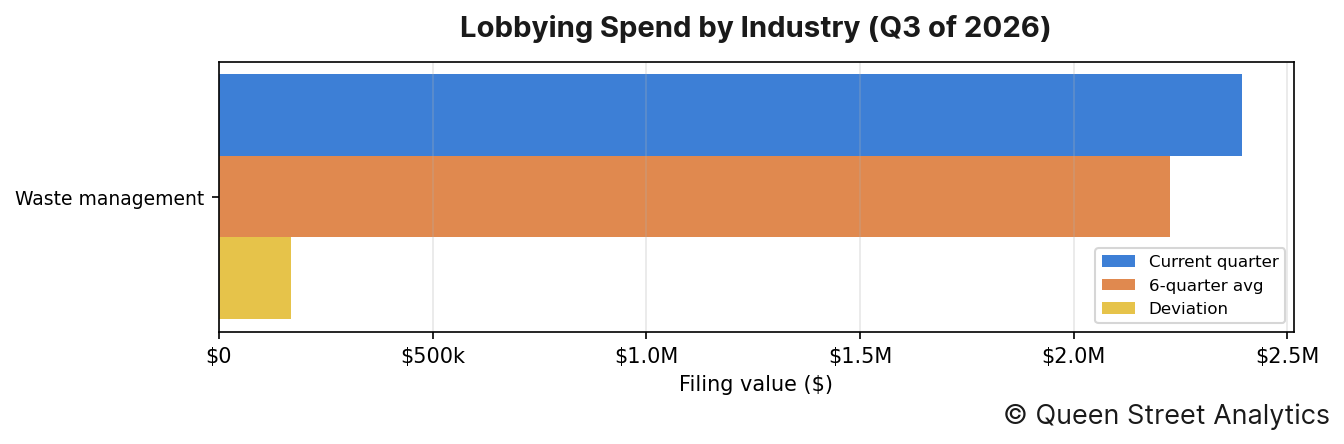
In Q3 of 2026, there was $2.4M worth of disclosed lobbying activity on Environment, roughly in line with the recent quarterly average of $2.2M. This activity can be broken down by industry as follows:
↳ There was $2.4M worth of Waste management lobbying, roughly in line with the recent quarterly average of $2.2M.
Section B: Lobbying Spend Trend
This channel's total disclosed lobbying spend across recent quarters, aggregated over all of its industries.
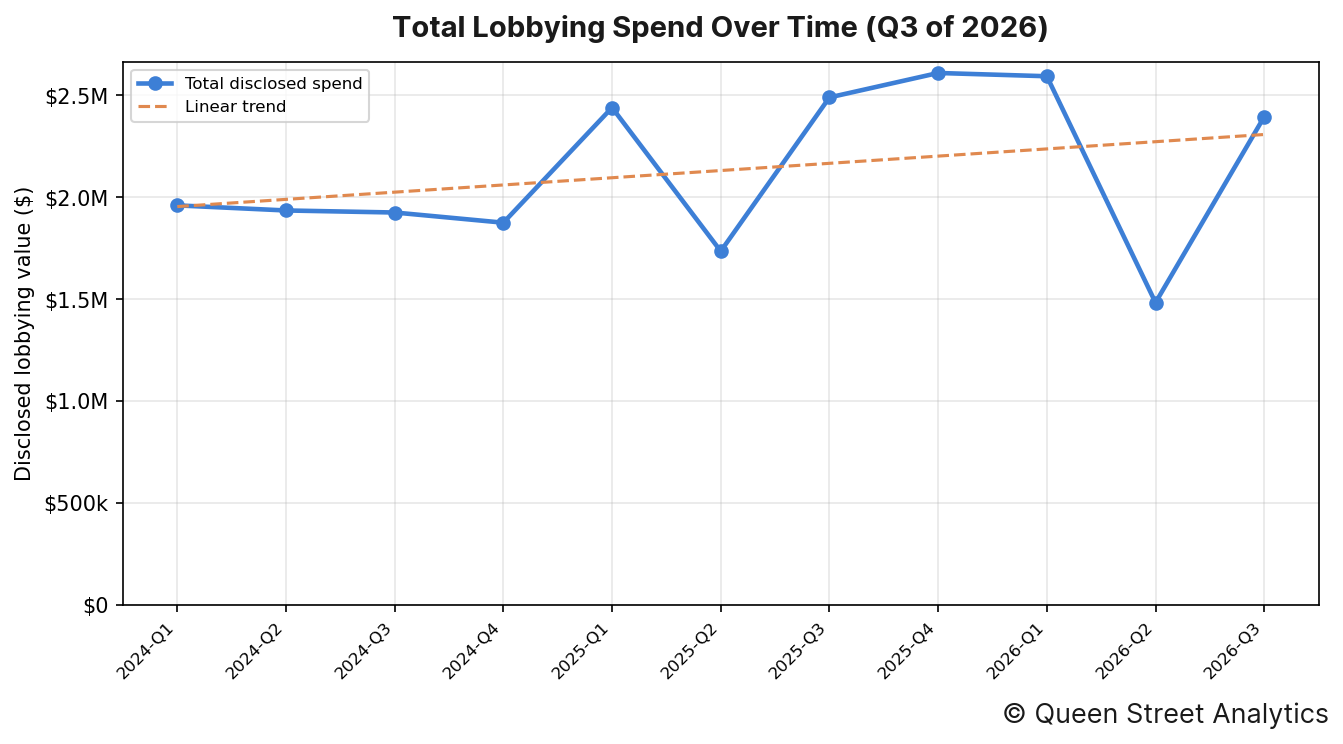
In Q3 of 2026, there was $2.4M worth of disclosed lobbying activity on Environment. Across the 11 quarters shown, the channel's total disclosed spend has risen over this period.
Organizations' Lobby Spend
The image below shows the organizations whose lobbying spend moved most from their six-quarter average.
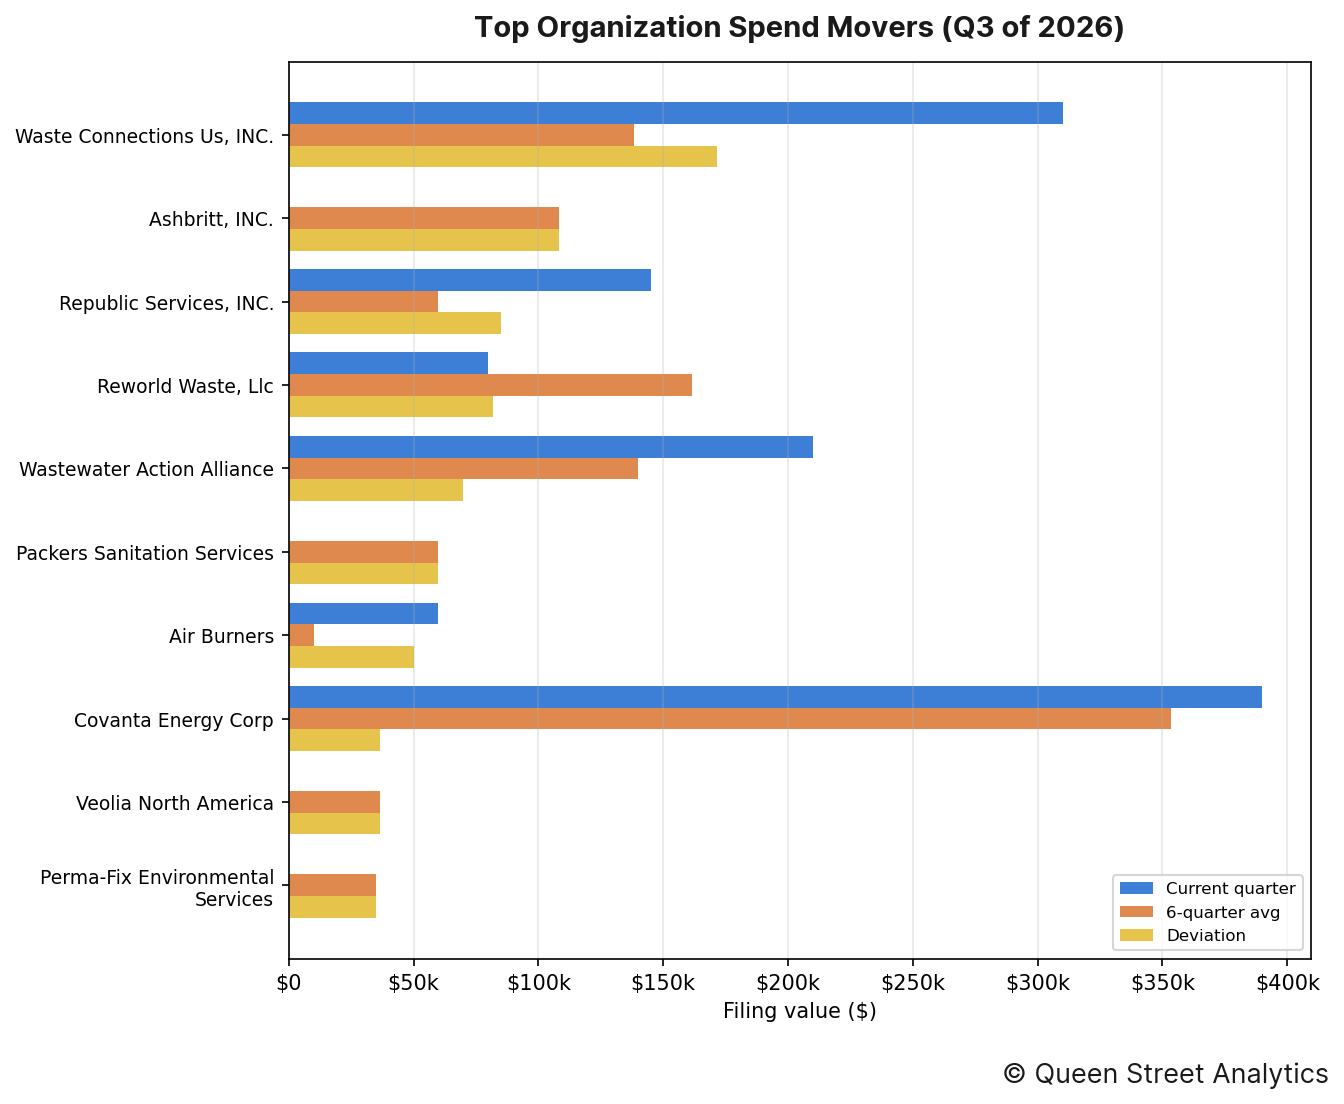
The organizations whose spending moved most from their own recent quarterly average were as follows:
↳ Waste Connections Us, INC. accounted for $310k in disclosed lobbying, 124% higher than the recent quarterly average of $138k.
↳ Ashbritt, INC. accounted for $0 in disclosed lobbying, 100% lower than the recent quarterly average of $108k.
↳ Republic Services, INC. accounted for $145k in disclosed lobbying, 142% higher than the recent quarterly average of $60k.
↳ Reworld Waste, Llc accounted for $80k in disclosed lobbying, 51% lower than the recent quarterly average of $162k.
↳ Wastewater Action Alliance accounted for $210k in disclosed lobbying, 50% higher than the recent quarterly average of $140k.
↳ Packers Sanitation Services accounted for $0 in disclosed lobbying, 100% lower than the recent quarterly average of $60k.
Section D: Government Entities Lobbied
This section documents this quarter's most lobbied federal government departments.
By industry
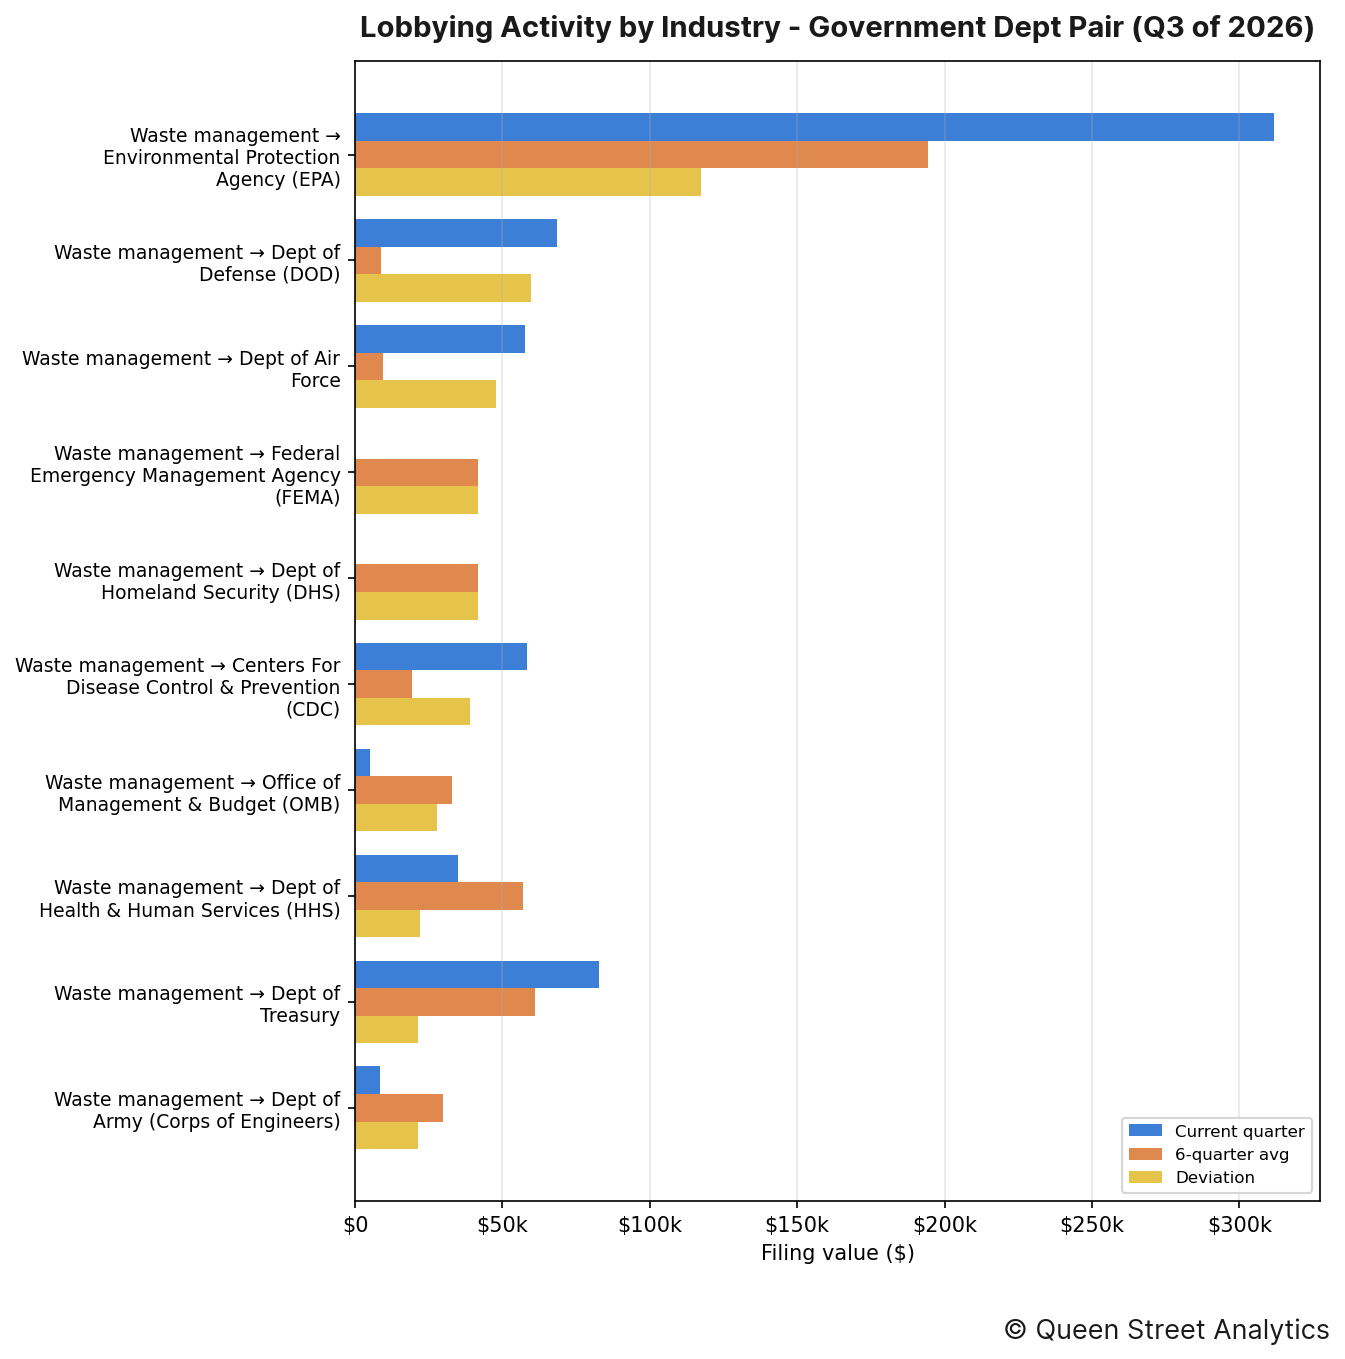
The industry–entity pairings that moved most this quarter were as follows:
↳ Waste management directed $312k of lobbying toward Environmental Protection Agency (EPA), 60% higher than the recent quarterly average of $194k.
↳ Waste management directed $68k of lobbying toward Dept of Defense (DOD), 671% higher than the recent quarterly average of $9k.
↳ Waste management directed $58k of lobbying toward Dept of Air Force, 500% higher than the recent quarterly average of $10k.
By organization
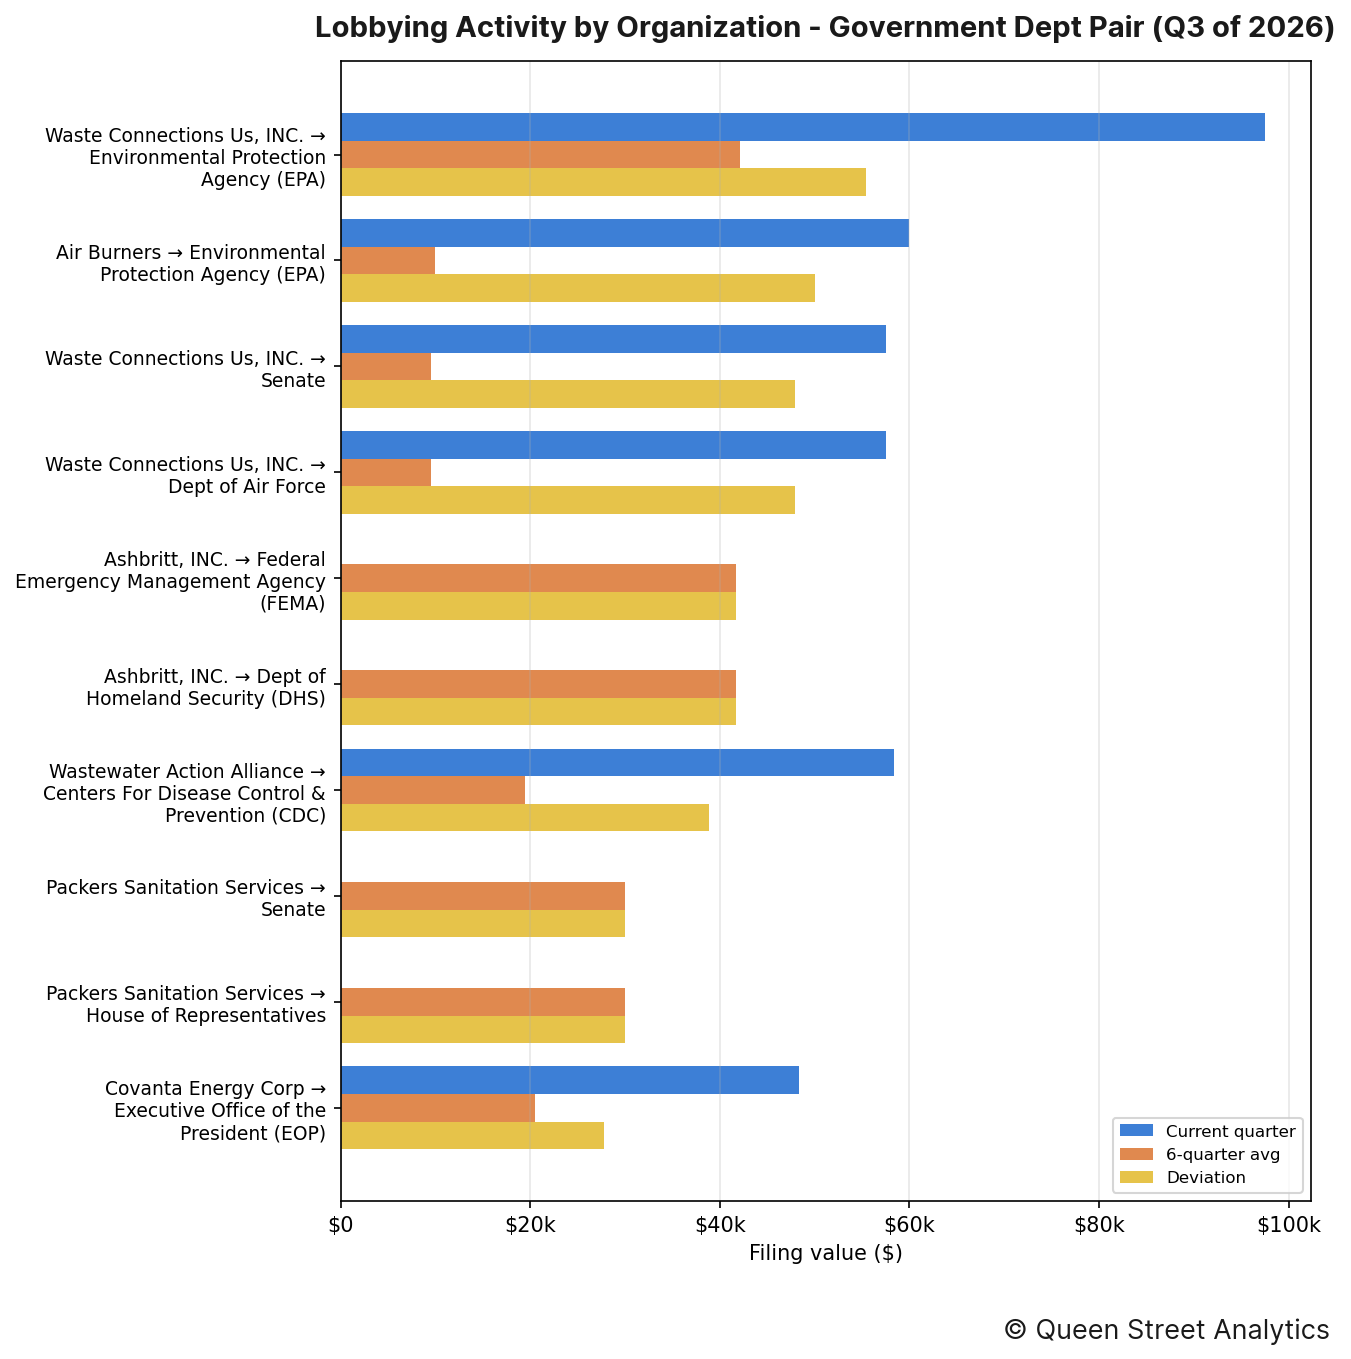
The organization–entity pairings that moved most this quarter were as follows:
↳ Waste Connections Us, INC. directed $98k of lobbying toward Environmental Protection Agency (EPA), 132% higher than the recent quarterly average of $42k.
↳ Air Burners directed $60k of lobbying toward Environmental Protection Agency (EPA), 500% higher than the recent quarterly average of $10k.
↳ Waste Connections Us, INC. directed $58k of lobbying toward Senate, 500% higher than the recent quarterly average of $10k.
Section E: Lobbying Issues
This section documents this quarter's most lobbied-on issues.
By industry
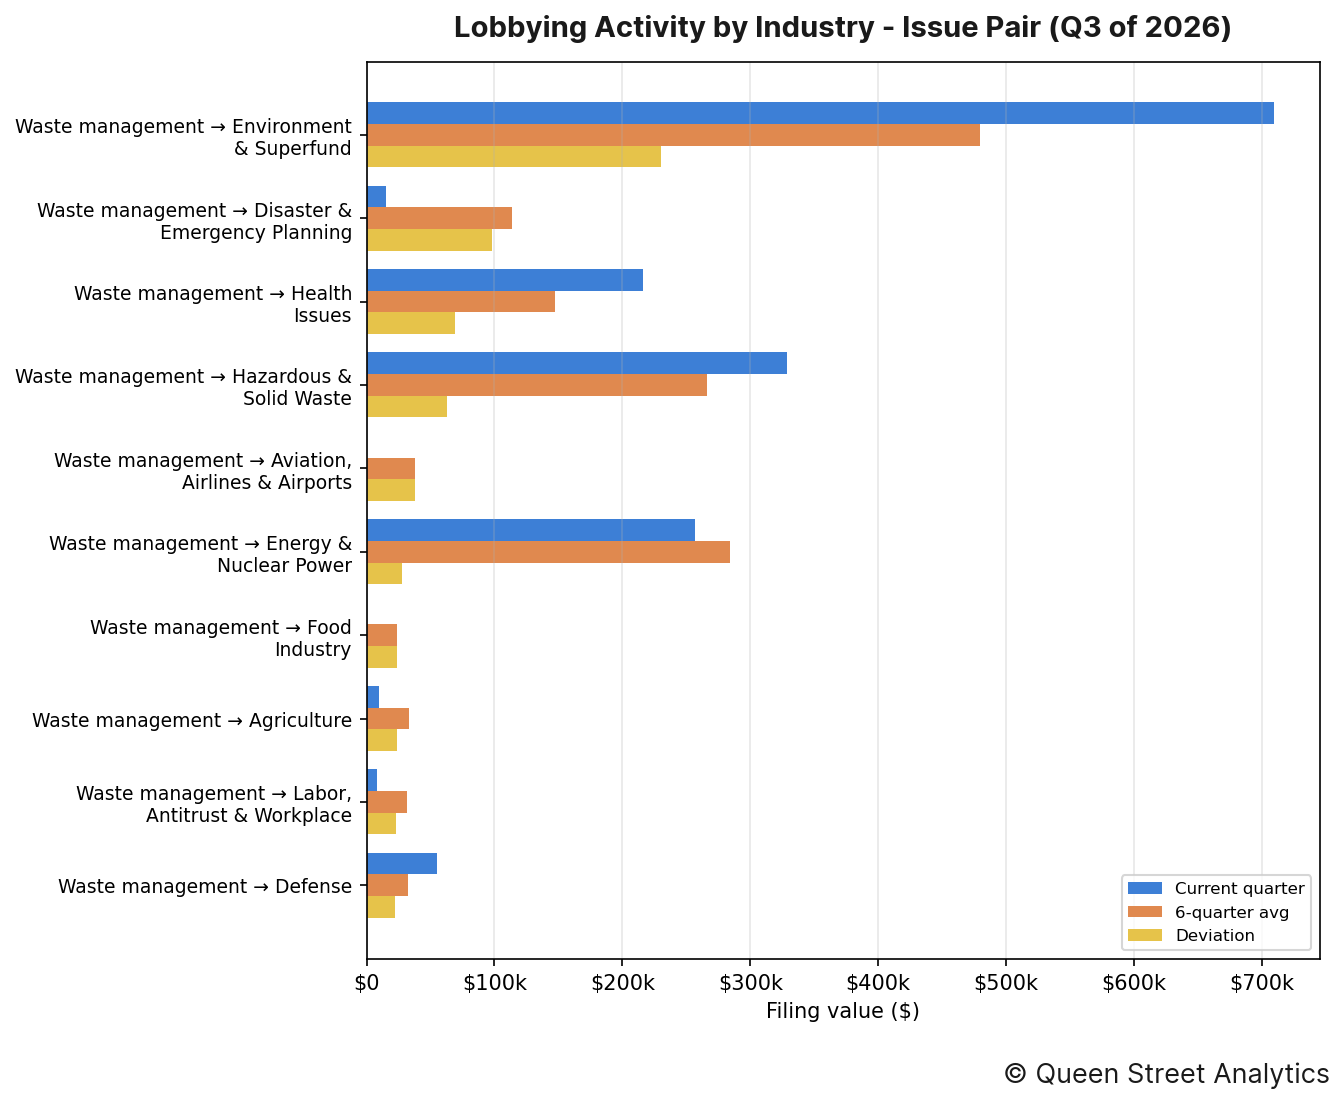
The industry–issue pairings that moved most this quarter were as follows:
↳ Waste management put $710k toward lobbying on Environment & Superfund, 48% higher than the recent quarterly average of $480k.
↳ Waste management put $15k toward lobbying on Disaster & Emergency Planning, 87% lower than the recent quarterly average of $113k.
↳ Waste management put $216k toward lobbying on Health Issues, 47% higher than the recent quarterly average of $147k.
By organization
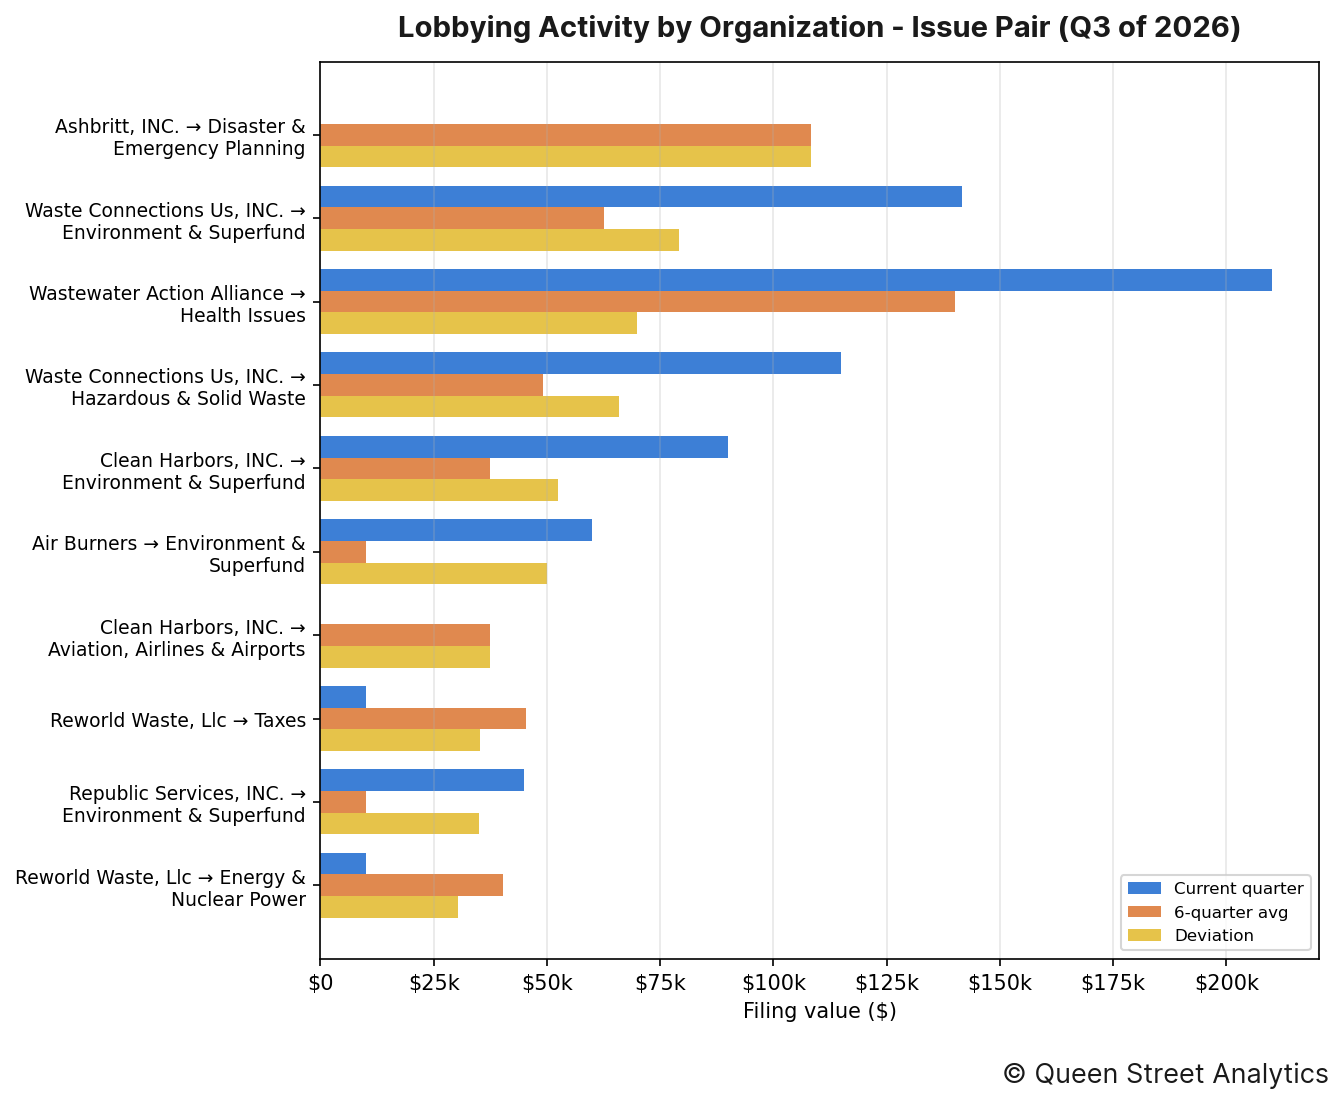
The organization–issue pairings that moved most this quarter were as follows:
↳ Ashbritt, INC. put $0 toward lobbying on Disaster & Emergency Planning, 100% lower than the recent quarterly average of $108k.
↳ Waste Connections Us, INC. put $142k toward lobbying on Environment & Superfund, 127% higher than the recent quarterly average of $62k.
↳ Wastewater Action Alliance put $210k toward lobbying on Health Issues, 50% higher than the recent quarterly average of $140k.
Section F: Most-Active Lobbyists
The figure below lists the lobbyists who managed the most imputed lobbying value this quarter, alongside their firm or organization. Because a filing's value is split evenly across the lobbyists it names, these dollar figures are imputed rather than directly disclosed.
No lobbyist activity to report this quarter.
Section G: Organization Network
The header image for this edition maps how this channel's organizations (neutral nodes) connect to the federal entities they lobbied (colored nodes) this quarter. A link's weight is the filing value directed to that entity, and node size reflects total value; the House and Senate are excluded (nearly every organization lobbies them) so the specialized targets stand out.
The most widely lobbied entity this quarter was Environmental Protection Agency (EPA), which was lobbied by 14 organizations.
Methodology
Every figure in this report starts from one number: the disclosed value of each lobbying filing, which we take as the income a registrant reported plus any in-house expenses (income + expenses) on its quarterly US Senate and House LDA disclosure. Before totalling anything we clean the filings — applying each amendment over the original it replaces, removing duplicates, and setting aside non-standard records such as registrations and terminations — and map every filing to a lobbying channel and industry using the organization's CRP industry code.
How the money is divided. A filing's full value counts once toward the organization that paid it and that organization's industry, so the industry and organization rankings (Sections A–C) reflect whole dollars. But a single filing usually names several government entities, several issue areas, and several lobbyists at once, and the disclosure never says how the fee was split among them. Rather than credit the full amount to each — which would count the same dollars over and over — we divide a filing's value evenly across the distinct items it names. So a $200,000 filing that lists four agencies contributes $50,000 to each in Section D, and the same even split is applied across issues in Section E and across lobbyists in Section F. That way every section's totals trace back to the same underlying money without double-counting.
Reading the movements. A “deviation” compares the quarter's value to the average of the prior six quarters, so a rise or fall is measured against an entity's own recent norm rather than against the rest of the field. Section B takes the wider view: it sums every industry into one channel total and plots it quarter by quarter, with a fitted line showing the overall direction of travel. Source: US Senate and House LDA disclosures.


