USA Lobbying on Agri-Food - Washington (Q4 2025)





Consumer Brands Assn, CropLife America, American Beverage Assn, Altria Client Services, Publix Super Markets, FMI The Food Industry Assn were unusually active lobbyists this quarter.
View the interactive network in Queen Street Analytics →
Each quarter we track movements in US federal lobbying, channel by channel. This edition covers Agri-Food for Q4 of 2025, ranking the organizations, government entities, issues, and lobbyists whose disclosed spend moved most.
Central Themes in this Quarter’s Lobby Data
Congressional Overhaul of Farm and Food Policy Spurs Record Lobbying
Major agricultural groups and food industry associations, including the National Farmers Union, appear to have intensified lobbying as Congress passed the 'One Big Beautiful Bill Act.' The sweeping legislation, advancing in July 2025, substantially disrupted federal subsidy and nutrition program allocations, prompting wide-ranging advocacy efforts from both farm and anti-hunger constituencies. Observers report that various industry sectors, some represented in direct outreach to federal entities such as the Department of Agriculture (USDA) and the House of Representatives, faced significant exposure to both new supports and cost-cutting provisions.
📎 Reconciliation bill includes major farm policy changes for 2025 · How the Federal Reconciliation Bill Will Affect Farms... · 2025 Year in Review for U.S. Agriculture | AgAmerica
Nutrition and Food Labeling Rules Prompt Wave of Industry Advocacy
New federal efforts under the 'Make America Healthy Again' initiative and concurrent discussion of stricter food labeling and SNAP eligibility triggered notable lobbying increases from brands and consumer package goods groups, with the National Farmers Union actively engaging the Dept of Health & Human Services and Congress. Industry voices, including those represented by the National Farmers Union, sought to influence how agencies define ultra-processed foods and structure healthy food incentives, with key debates extending into school meals and product reformulation. Stakeholders are apparently responding to possible shake-ups in both product marketing and regulatory requirements.
📎 Food Law’s 2025 “Top Ten” – National Agricultural Law Center · Choices Magazine Online · The Most Important Food Policy Changes of 2025 So Far
Policy Crackdown on Foreign Farmland and Pesticides Triggers Industry Pushback
Heightened political action on foreign ownership restrictions and evolving pesticide regulations led farm and chemical associations, including the National Farmers Union, to significantly boost their lobbying presence with entities such as the Department of Agriculture (USDA) and the Environmental Protection Agency (EPA). Ten states revised foreign farmland ownership rules, while federal revisions to pesticide and water laws signaled fresh compliance challenges. Industry groups reportedly pressed for clearer pathways amid uncertainty around land access and agri-input approvals.
📎 Foreign farmland limits top 2025 ag law issues - Farm Progress · 2025 in Review: How Agriculture Persevered Through Challenges This Year · 2025 Year in Review for U.S. Agriculture | AgAmerica
SNAP and Infant Formula Policy Debates Intensify Stakeholder Actions
Hotly contested changes to food access programs, especially SNAP and infant formula standards, appear to coincide with elevated lobbying by food manufacturers and concern groups, including the National Farmers Union in its outreach to the Dept of Agriculture (USDA) and the House of Representatives. Legislative and regulatory disputes over school nutrition, SNAP food eligibility, and infant formula safety/quality drove advocacy around maternal and child nutrition. Multiple sectors likely sought to preserve or expand product eligibility amidst evolving rules for food assistance programs.
📎 Food Law’s 2025 “Top Ten” – National Agricultural Law Center · Reconciliation bill includes major farm policy changes for 2025 · The Most Important Food Policy Changes of 2025 So Far
Tobacco Industry Advocacy Intensifies Amid Tax and Regulatory Uncertainty
The tobacco sector’s lobbying saw a marked increase as Congress debated new excise taxes and regulatory clarity around CBD and vape products, with the National Farmers Union also making its presence felt before the House of Representatives and the Senate during this period. Industry actors appear to have amplified their presence during developments affecting FDA oversight and taxation, likely reacting to volatile policy proposals and ongoing appropriations talks, a trend reflected in the activities of National Farmers Union engaging with agencies such as the Dept of Agriculture (USDA) and the Dept of Health & Human Services (HHS). Broader labor and international trade issues may have further complicated industry advocacy during this period.
📎 Food Law’s 2025 “Top Ten” – National Agricultural Law Center · Reconciliation bill includes major farm policy changes for 2025

Section A: Lobbying Spend by Industry
How much each industry in this channel spent on federal lobbying in Q4 of 2025, compared with its average over the prior six quarters.
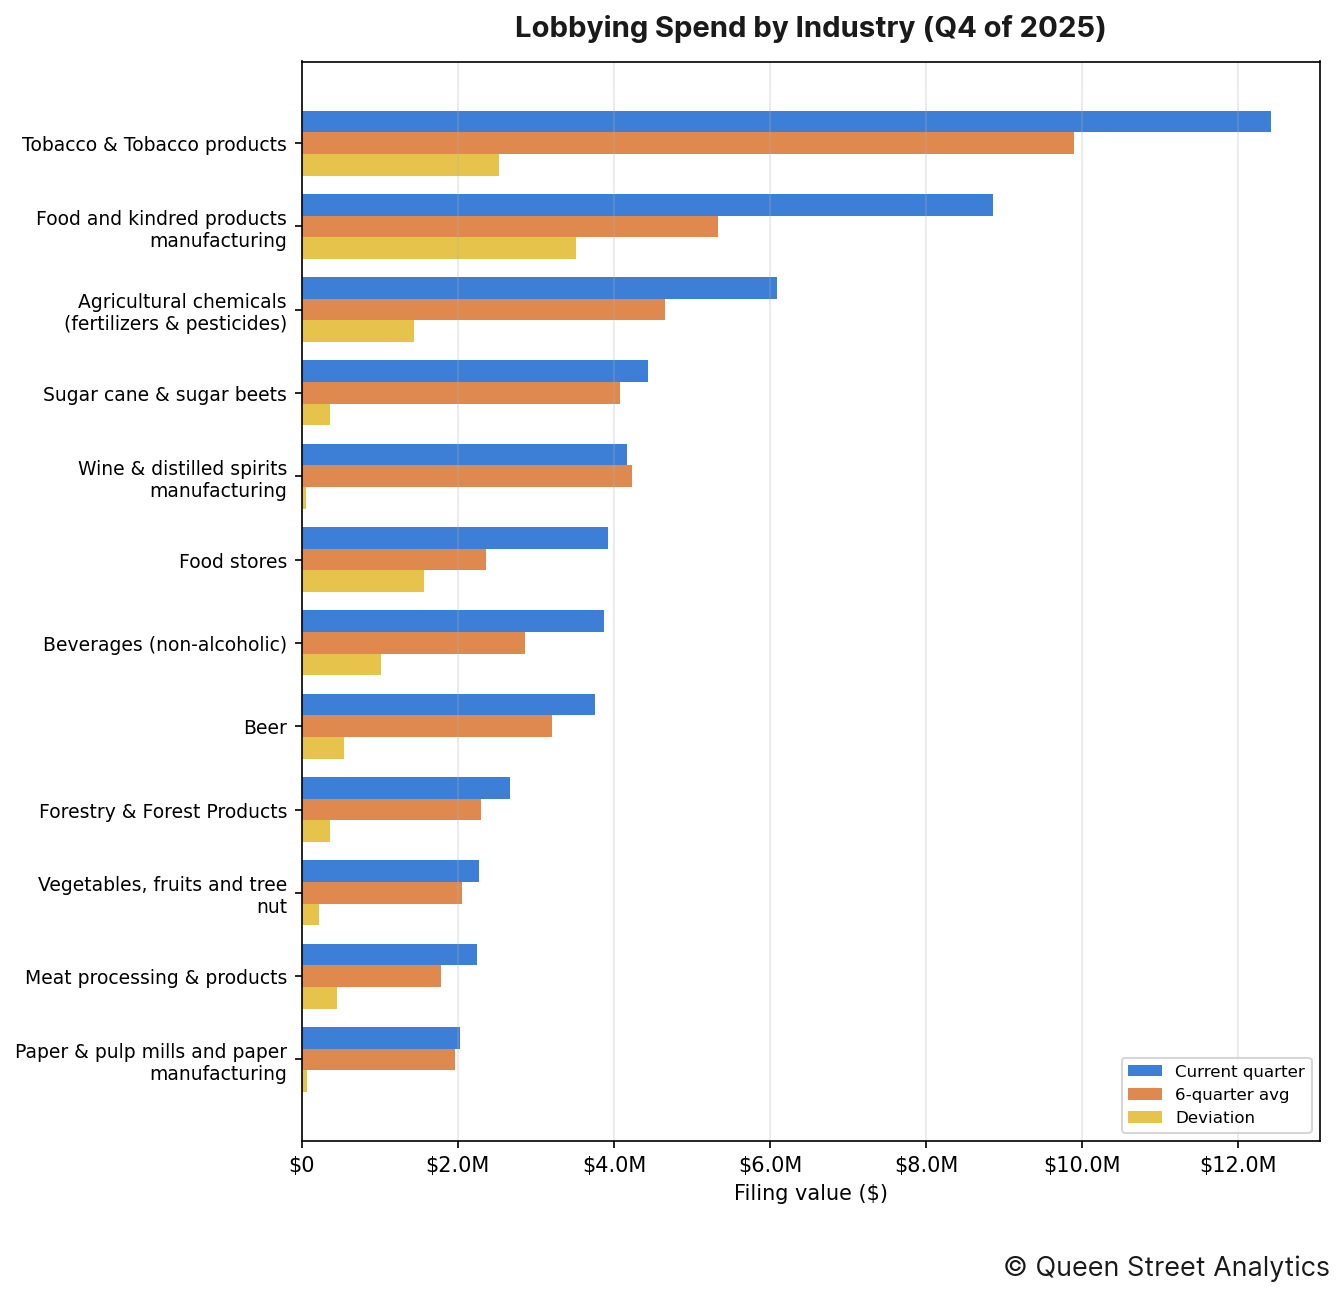
In Q4 of 2025, there was $80.5M worth of disclosed lobbying activity on Agri-Food, 19% higher than the recent quarterly average of $67.6M. This activity can be broken down by industry as follows:
↳ There was $12.4M worth of Tobacco & Tobacco products lobbying, 26% higher than the recent quarterly average of $9.9M.
↳ There was $8.9M worth of Food and kindred products manufacturing lobbying, 66% higher than the recent quarterly average of $5.3M.
↳ There was $6.1M worth of Agricultural chemicals (fertilizers & pesticides) lobbying, 31% higher than the recent quarterly average of $4.7M.
↳ There was $4.4M worth of Sugar cane & sugar beets lobbying, roughly in line with the recent quarterly average of $4.1M.
↳ There was $4.2M worth of Wine & distilled spirits manufacturing lobbying, roughly in line with the recent quarterly average of $4.2M.
↳ There was $3.9M worth of Food stores lobbying, 67% higher than the recent quarterly average of $2.4M.
Section B: Lobbying Spend Trend
This channel's total disclosed lobbying spend across recent quarters, aggregated over all of its industries.
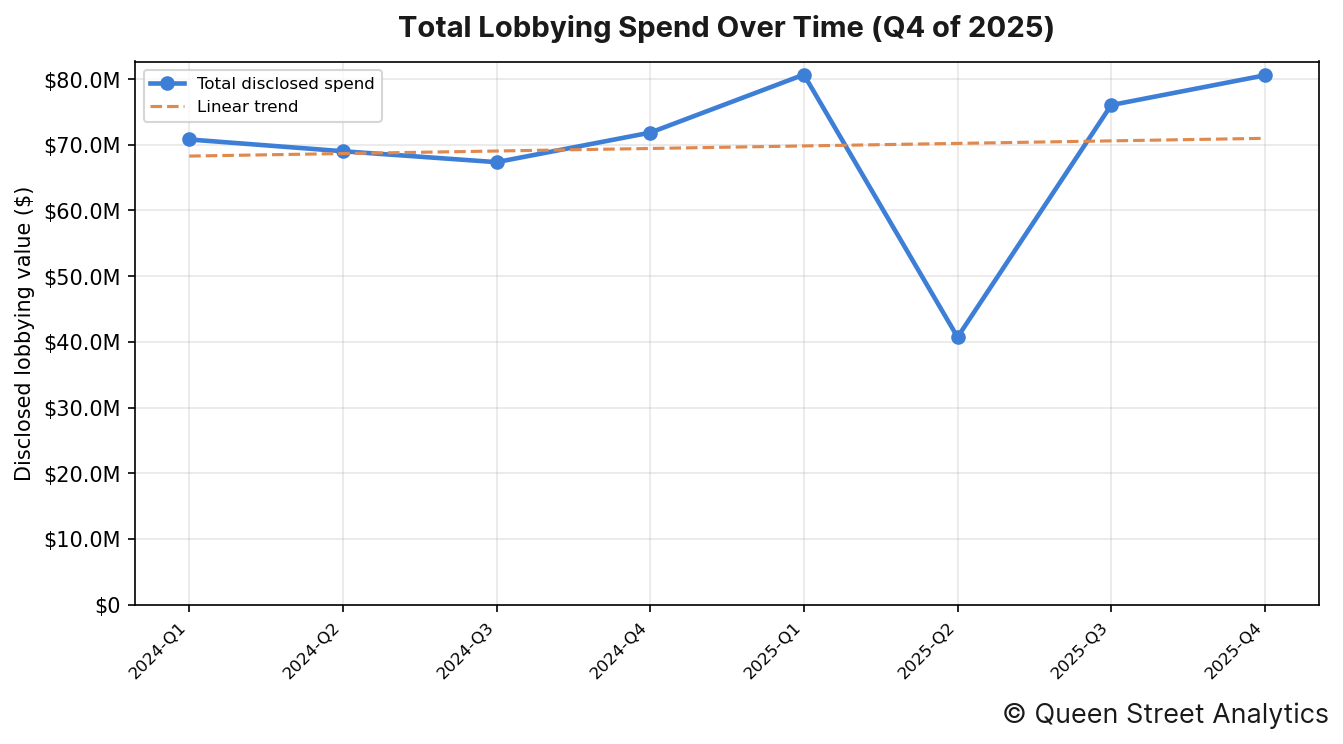
In Q4 of 2025, there was $80.5M worth of disclosed lobbying activity on Agri-Food. Across the 8 quarters shown, the channel's total disclosed spend has risen over this period.
Organizations' Lobby Spend
The image below shows the organizations whose lobbying spend moved most from their six-quarter average.
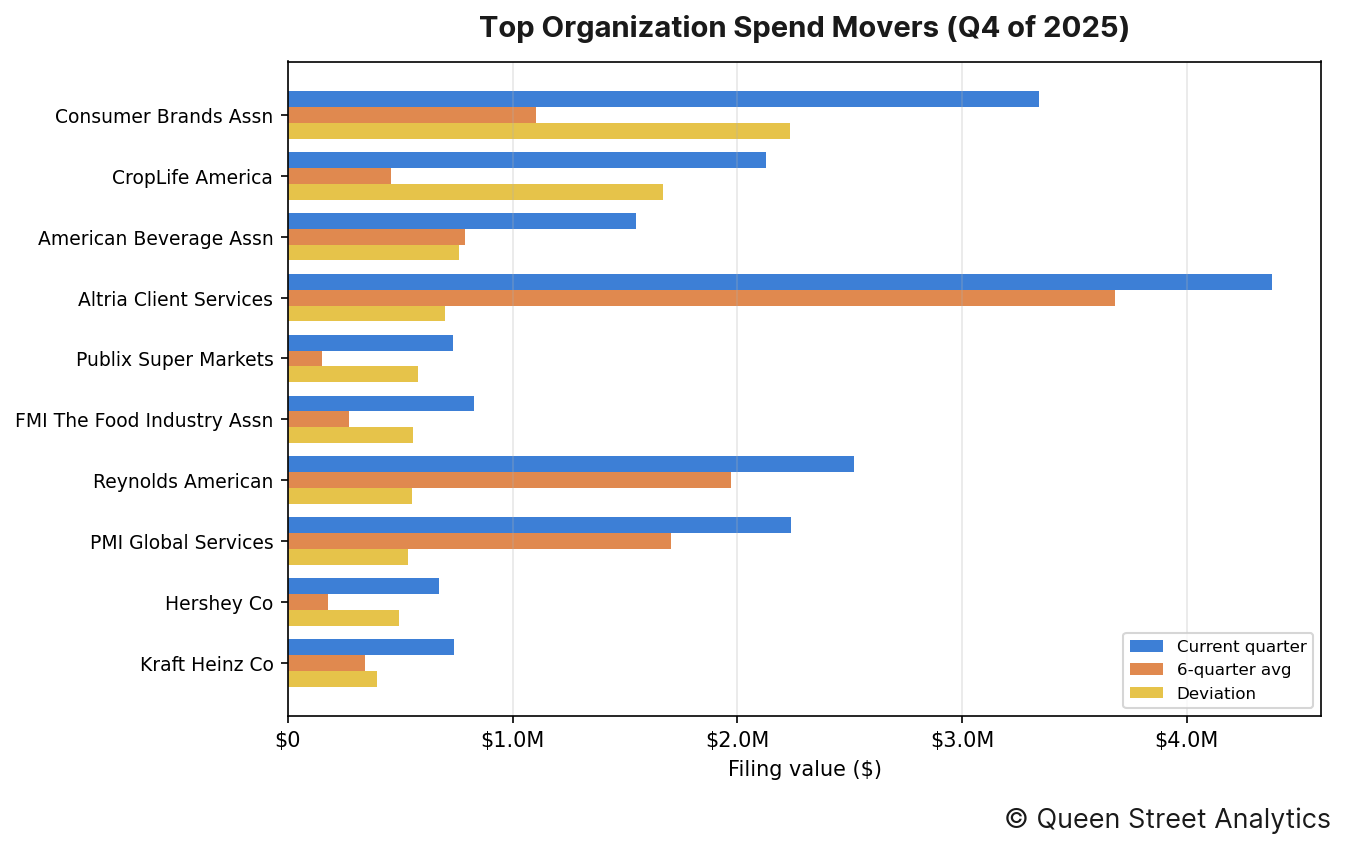
The organizations whose spending moved most from their own recent quarterly average were as follows:
↳ Consumer Brands Assn accounted for $3.3M in disclosed lobbying, 202% higher than the recent quarterly average of $1.1M.
↳ CropLife America accounted for $2.1M in disclosed lobbying, 364% higher than the recent quarterly average of $458k.
↳ American Beverage Assn accounted for $1.6M in disclosed lobbying, 97% higher than the recent quarterly average of $788k.
↳ Altria Client Services accounted for $4.4M in disclosed lobbying, 19% higher than the recent quarterly average of $3.7M.
↳ Publix Super Markets accounted for $732k in disclosed lobbying, 378% higher than the recent quarterly average of $153k.
↳ FMI The Food Industry Assn accounted for $830k in disclosed lobbying, 206% higher than the recent quarterly average of $272k.
Section D: Government Entities Lobbied
This section documents this quarter's most lobbied federal government departments.
By industry
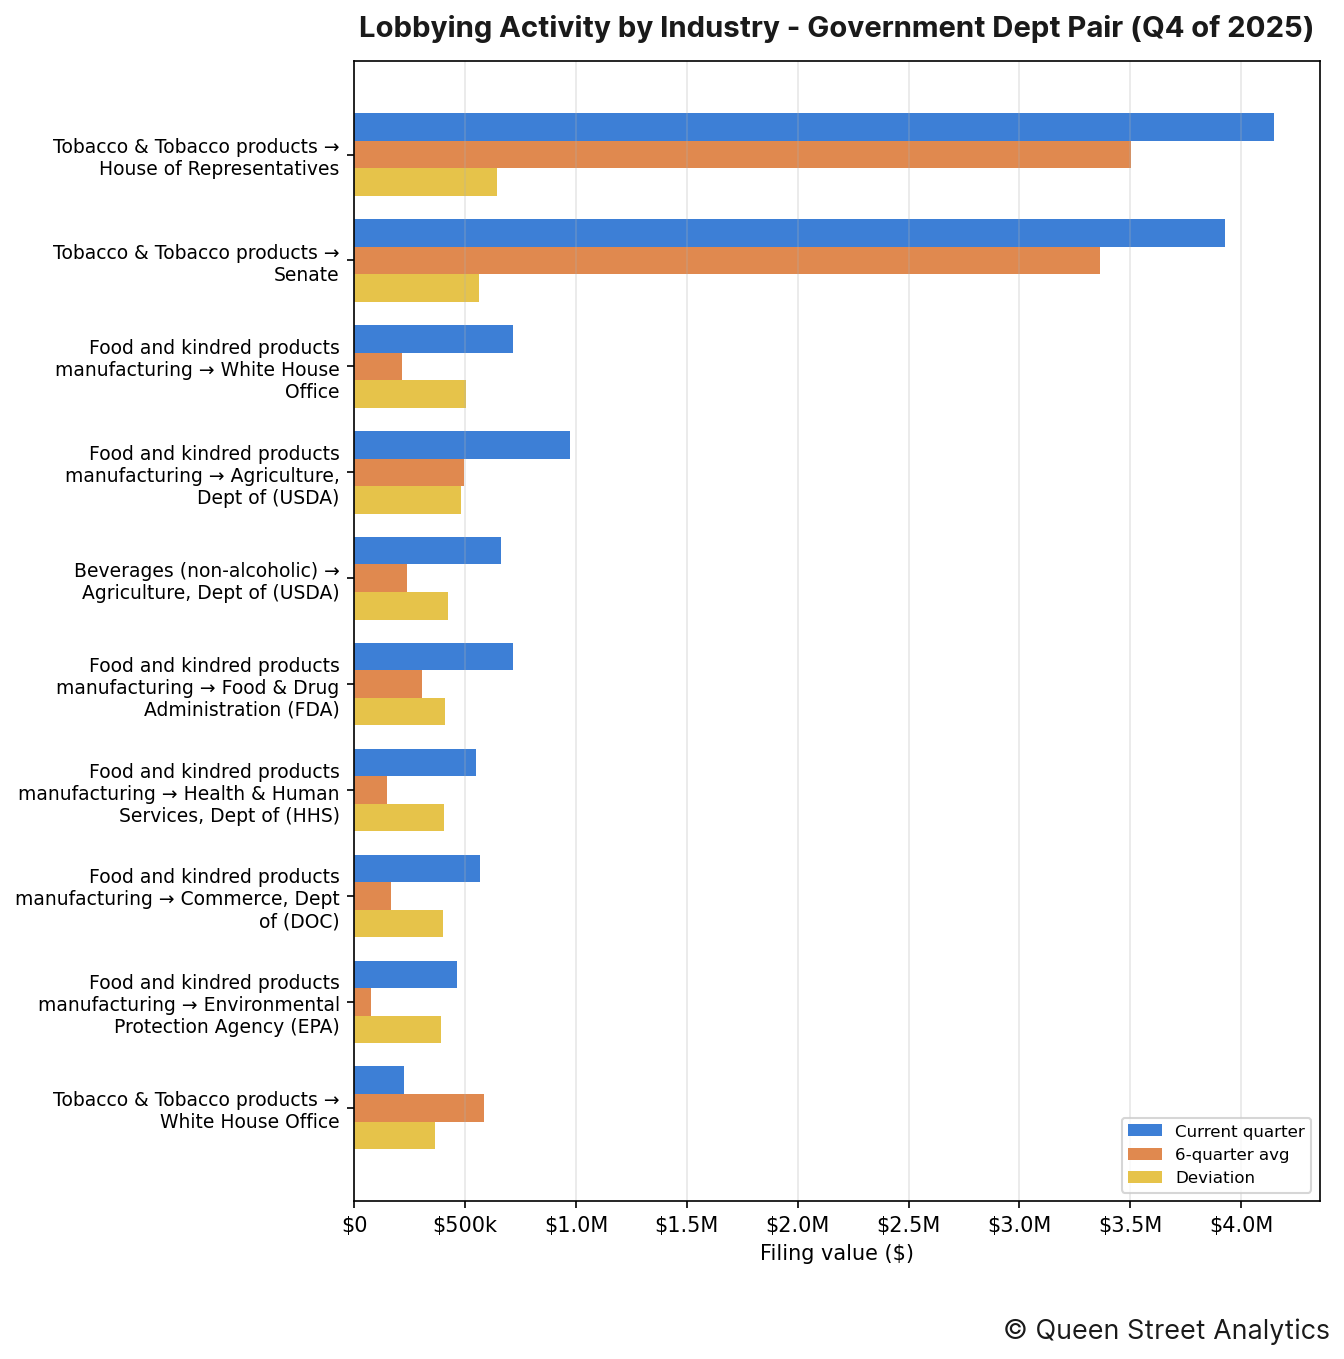
The industry–entity pairings that moved most this quarter were as follows:
↳ Tobacco & Tobacco products directed $4.1M of lobbying toward House of Representatives, 18% higher than the recent quarterly average of $3.5M.
↳ Tobacco & Tobacco products directed $3.9M of lobbying toward Senate, 17% higher than the recent quarterly average of $3.4M.
↳ Food and kindred products manufacturing directed $717k of lobbying toward White House Office, 236% higher than the recent quarterly average of $214k.
By organization
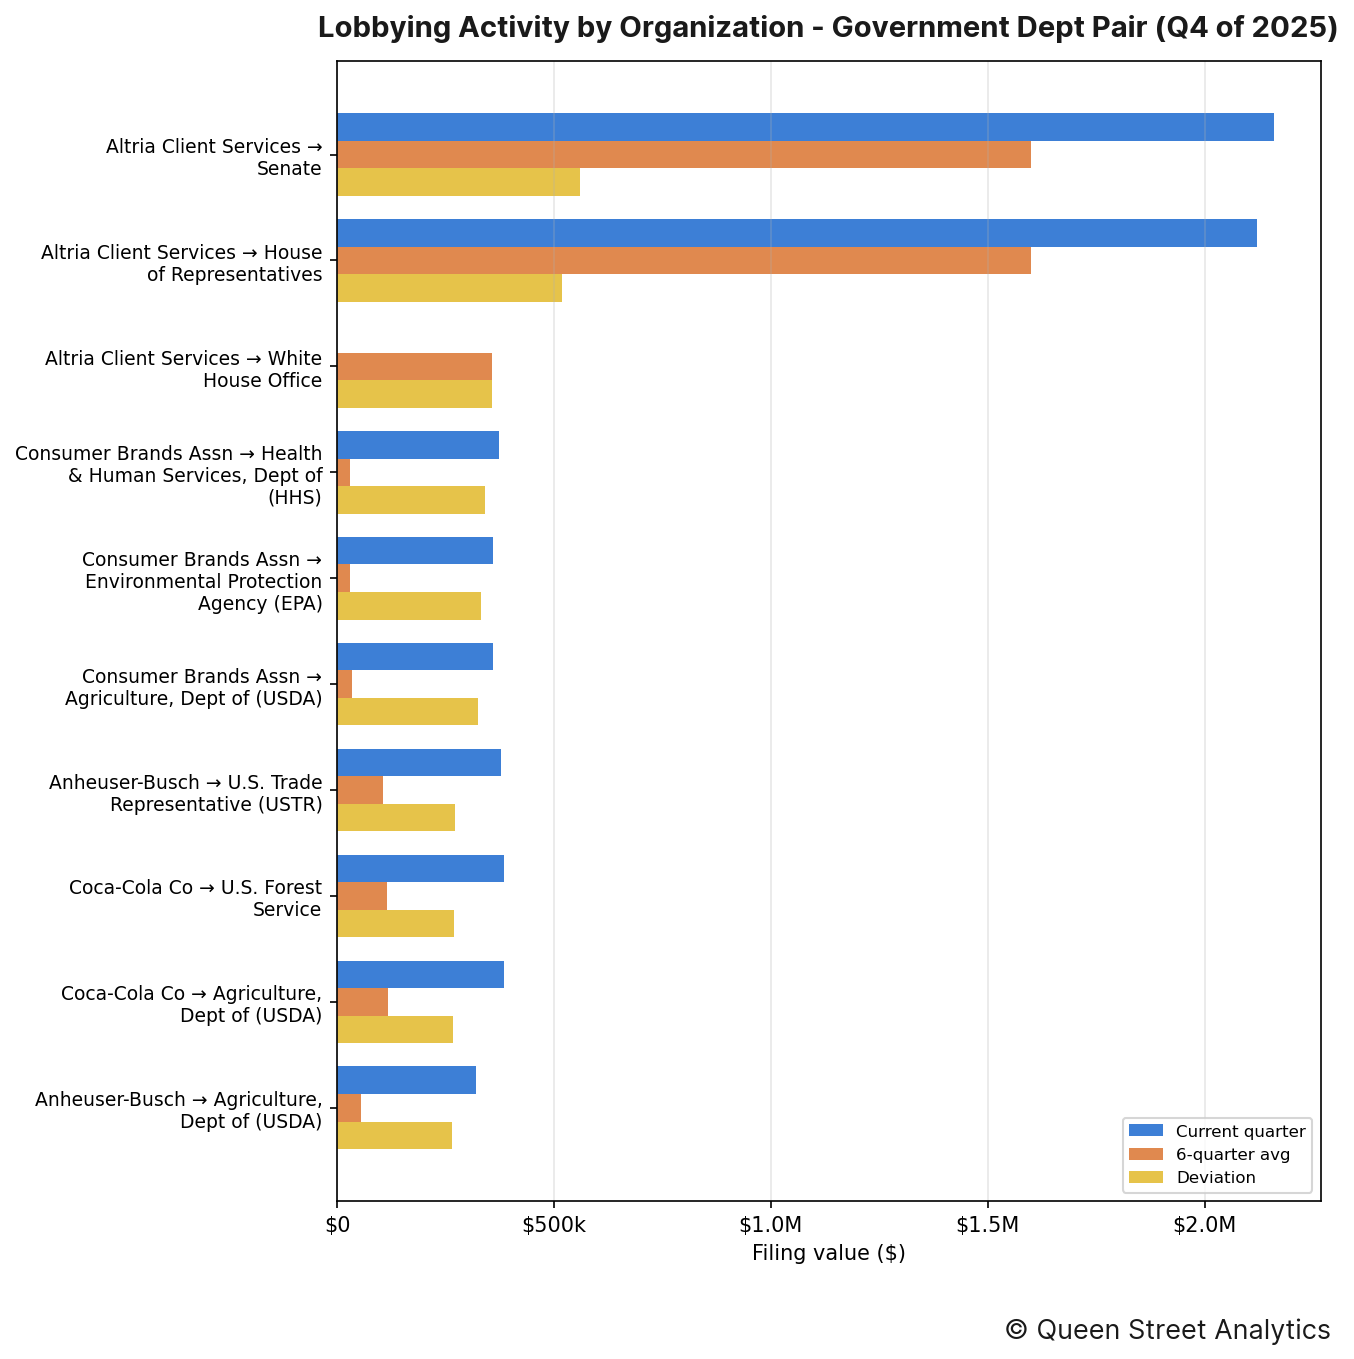
The organization–entity pairings that moved most this quarter were as follows:
↳ Altria Client Services directed $2.2M of lobbying toward Senate, 35% higher than the recent quarterly average of $1.6M.
↳ Altria Client Services directed $2.1M of lobbying toward House of Representatives, 32% higher than the recent quarterly average of $1.6M.
↳ Altria Client Services directed $0 of lobbying toward White House Office, 100% lower than the recent quarterly average of $356k.
Section E: Lobbying Issues
This section documents this quarter's most lobbied-on issues.
By industry
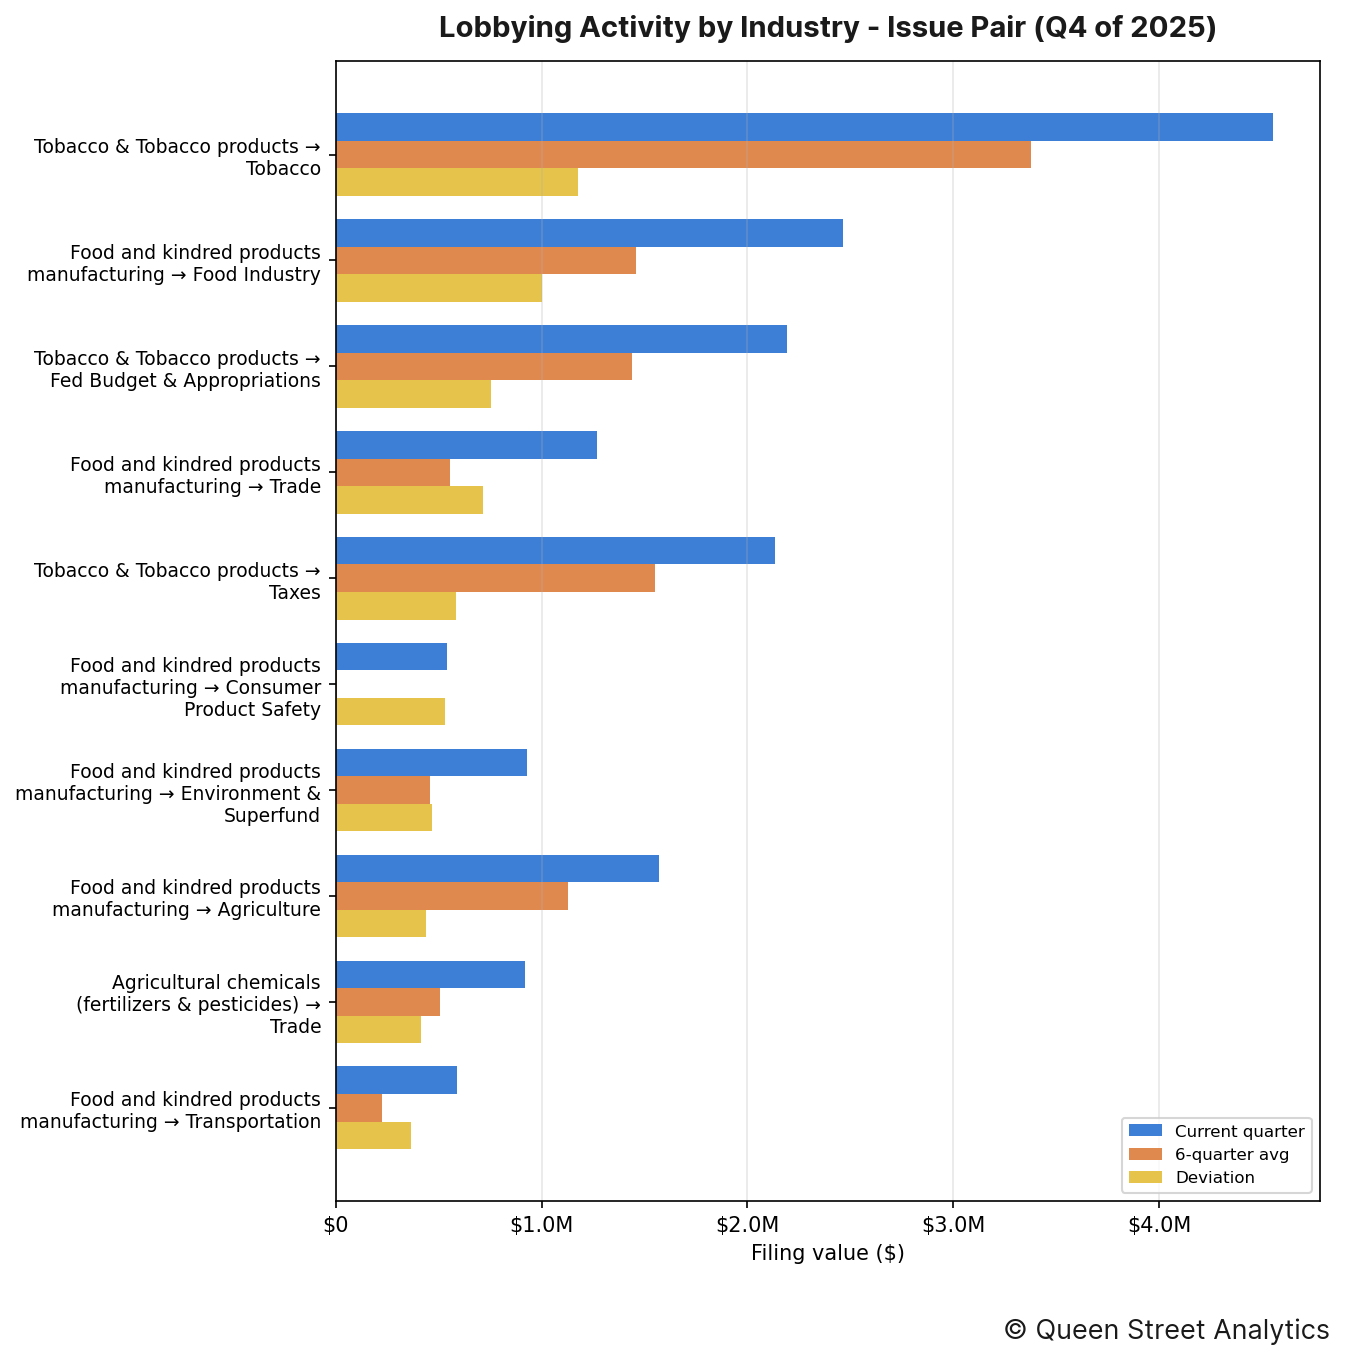
The industry–issue pairings that moved most this quarter were as follows:
↳ Tobacco & Tobacco products put $4.6M toward lobbying on Tobacco, 35% higher than the recent quarterly average of $3.4M.
↳ Food and kindred products manufacturing put $2.5M toward lobbying on Food Industry, 69% higher than the recent quarterly average of $1.5M.
↳ Tobacco & Tobacco products put $2.2M toward lobbying on Fed Budget & Appropriations, 53% higher than the recent quarterly average of $1.4M.
By organization
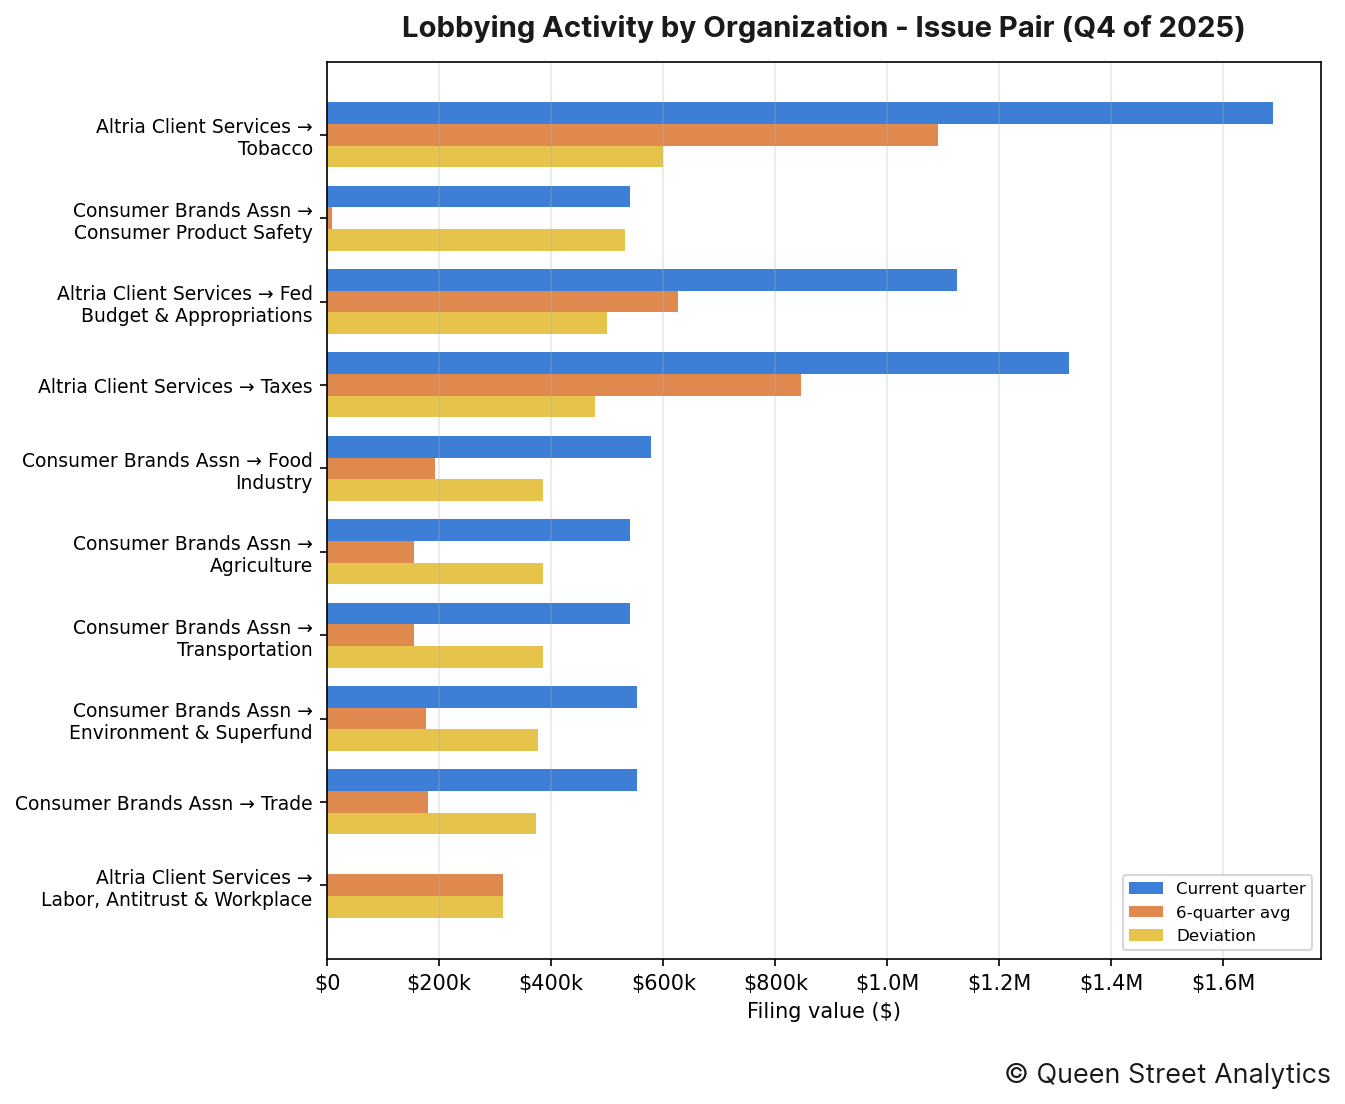
The organization–issue pairings that moved most this quarter were as follows:
↳ Altria Client Services put $1.7M toward lobbying on Tobacco, 55% higher than the recent quarterly average of $1.1M.
↳ Consumer Brands Assn put $540k toward lobbying on Consumer Product Safety, 6603% higher than the recent quarterly average of $8k.
↳ Altria Client Services put $1.1M toward lobbying on Fed Budget & Appropriations, 80% higher than the recent quarterly average of $626k.
Section F: Most-Active Lobbyists
The figure below lists the lobbyists who managed the most imputed lobbying value this quarter, alongside their firm or organization. Because a filing's value is split evenly across the lobbyists it names, these dollar figures are imputed rather than directly disclosed.
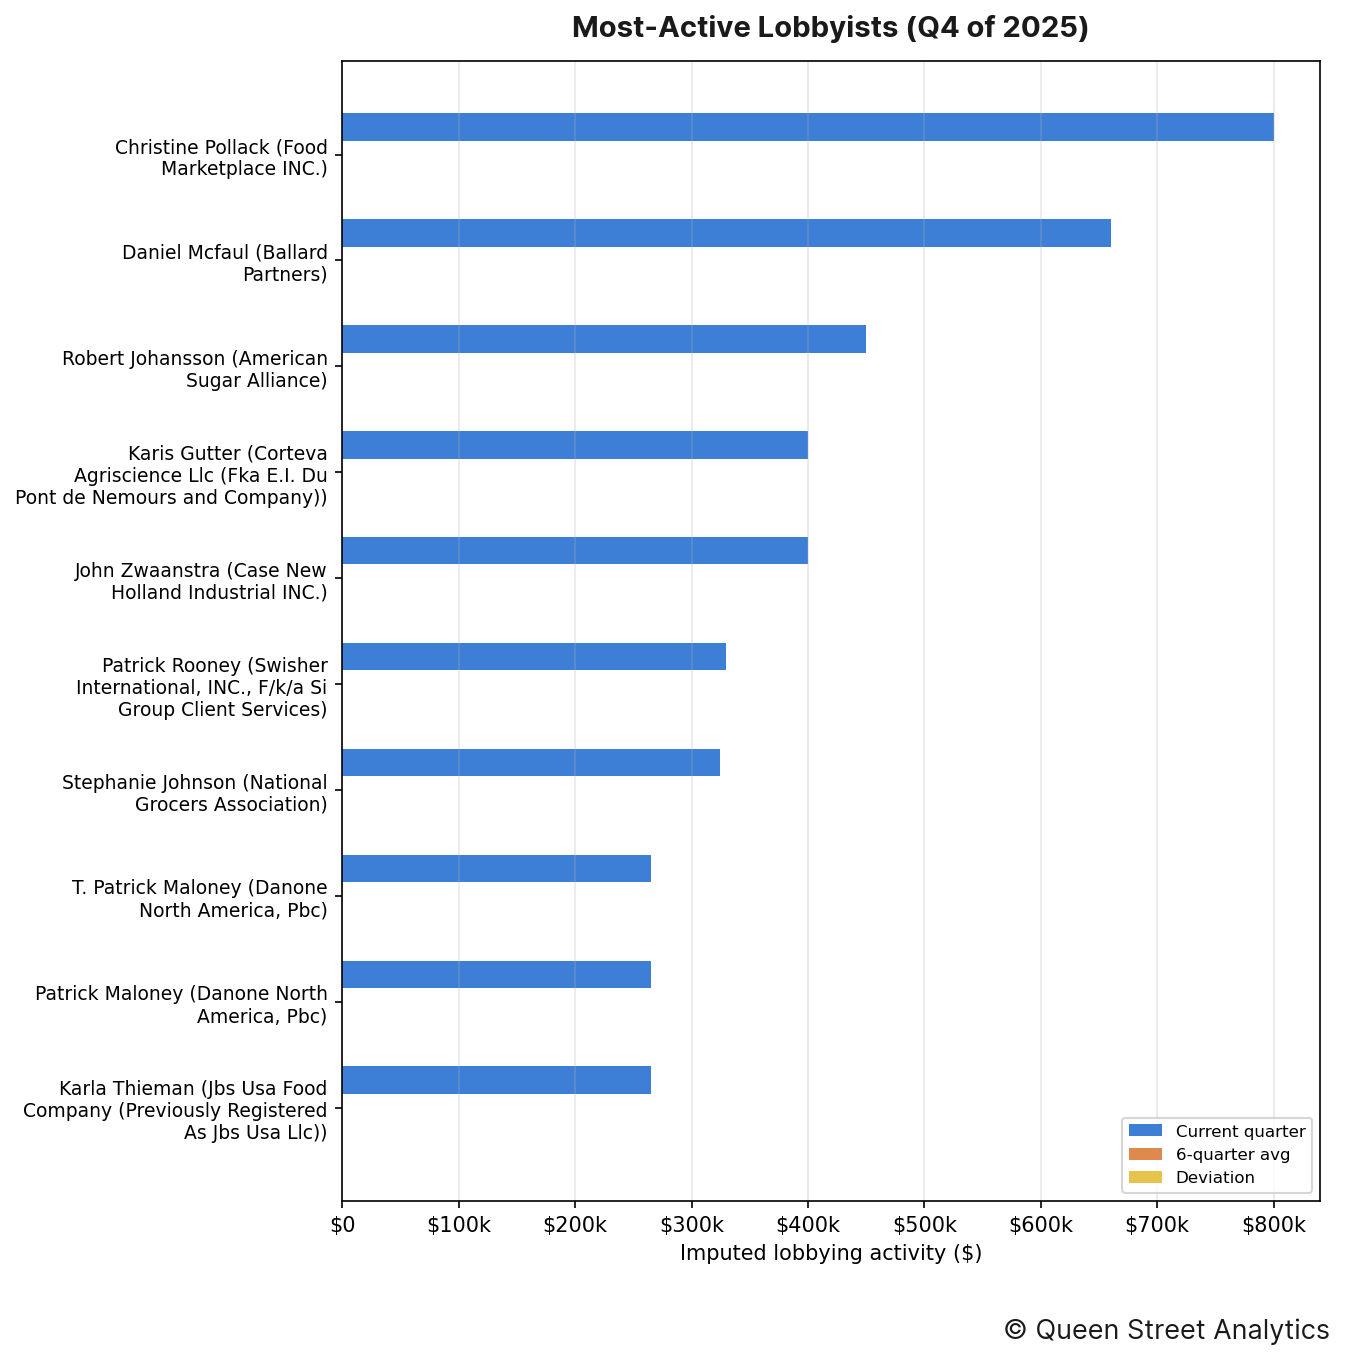
The lobbyists who managed the most imputed lobbying value this quarter were as follows:
↳ Christine Pollack (Food Marketplace INC) was credited with an imputed $800k in lobbying activity.
↳ Daniel Mcfaul (Ballard Partners) was credited with an imputed $660k in lobbying activity.
↳ Robert Johansson (American Sugar Alliance) was credited with an imputed $450k in lobbying activity.
↳ Karis Gutter (Corteva Agriscience Llc (Fka E.I. Du Pont de Nemours and Company)) was credited with an imputed $400k in lobbying activity.
↳ John Zwaanstra (Case New Holland Industrial INC) was credited with an imputed $400k in lobbying activity.
Section G: Organization Network
The header image for this edition maps how this channel's organizations (neutral nodes) connect to the federal entities they lobbied (colored nodes) this quarter. A link's weight is the filing value directed to that entity, and node size reflects total value; the House and Senate are excluded (nearly every organization lobbies them) so the specialized targets stand out.
The most widely lobbied entity this quarter was Dept of Agriculture (USDA), which was lobbied by 20 organizations.
Methodology
Every figure in this report starts from one number: the disclosed value of each lobbying filing, which we take as the income a registrant reported plus any in-house expenses (income + expenses) on its quarterly US Senate and House LDA disclosure. Before totalling anything we clean the filings — applying each amendment over the original it replaces, removing duplicates, and setting aside non-standard records such as registrations and terminations — and map every filing to a lobbying channel and industry using the organization's CRP industry code.
How the money is divided. A filing's full value counts once toward the organization that paid it and that organization's industry, so the industry and organization rankings (Sections A–C) reflect whole dollars. But a single filing usually names several government entities, several issue areas, and several lobbyists at once, and the disclosure never says how the fee was split among them. Rather than credit the full amount to each — which would count the same dollars over and over — we divide a filing's value evenly across the distinct items it names. So a $200,000 filing that lists four agencies contributes $50,000 to each in Section D, and the same even split is applied across issues in Section E and across lobbyists in Section F. That way every section's totals trace back to the same underlying money without double-counting.
Reading the movements. A “deviation” compares the quarter's value to the average of the prior six quarters, so a rise or fall is measured against an entity's own recent norm rather than against the rest of the field. Section B takes the wider view: it sums every industry into one channel total and plots it quarter by quarter, with a fitted line showing the overall direction of travel. Source: US Senate and House LDA disclosures.


