USA Lobbying on Agri-Food - Washington (Q2 2026)





PMI Global Services; Reynolds American; Altria Client Services were unusually active lobbyists this quarter.
View the interactive network in Queen Street Analytics →
Each quarter we track movements in US federal lobbying, channel by channel. This edition covers Agri-Food for Q2 of 2026, ranking the organizations, government entities, issues, and lobbyists whose disclosed spend moved most.
Central Themes in this Quarter’s Lobby Data
Farm Bill 2.0 Spurs Sector-Wide Lobbying Surge
Major agri-food players, including the National Farmers Union, have intensified lobbying as Congress moves Farm Bill 2.0 closer to final passage, pressing their case with the House of Representatives and the Department of Agriculture (USDA). Proposals for expanded crop insurance, SNAP changes, and new commodity programs have galvanized grain, machinery, and food organizations, all seeking to shape the bill’s final language before enactment.
📎 The 2026 Farm Bill (H.R. 7567): Comparison with Current Law · Agricultural Act of 2026: Farm Bill 2.0 | Senate Committee On... · The Most Impactful Food Policy Stories of 2026 (So Far)
Appropriations Battles Drive Up Tobacco, Food Sector Lobbying
Sharp increases in lobbying connected to federal appropriations highlight high-stakes efforts by tobacco and other food interests as 2027 Agriculture/FDA budgets are debated. Groups including the National Farmers Union, which filed across entities such as the Dept of Agriculture (USDA), House of Representatives, and Dept of Health & Human Services (HHS), are among those pressing industry targets that include rural development, food safety, nutrition support, and new regulatory funding, with filings indicating strong positions staked out before final funding decisions.
📎 Senate Committee Approves FY 2026 Agriculture Appropriations Bill · FY 2026 Budget Summary - USDA
Tobacco Industry Ramps Advocacy on Enforcement and Taxes
Tobacco company filings suggest a surge in lobbying focused on regulatory enforcement, illicit trade, and excise tax proposals as federal agencies coordinate on new measures, with Altria Client Services and Reynolds American both engaging with the House of Representatives and the Senate on these issues. The context includes active appropriations debates and increased FDA, CDC, and Homeland Security efforts against illicit products, all prompting sharp advocacy responses from clients such as JUUL Labs, which has contacted the Food & Drug Administration and the Department of Health & Human Services.
📎 [Sample LDA filings; Congressional appropriations bills
Regulatory Overhaul in Food Labeling and Ingredient Safety Draws Lobbyist Attention
The White House’s Q2 regulatory agenda signals significant new FDA rulemakings on nutrient claims and GRAS ingredient reforms, affecting food and feed sectors. Food, beverage, and animal product stakeholders, including the National Farmers Union, have reportedly increased lobbying to entities such as the Executive Office of the President and the Dept of Health & Human Services as they prepare for labeling and safety reforms set to roll out in late 2026.
📎 OMB Releases 2026 Unified Agenda of Regulatory Actions
Executive Order on Regenerative Agriculture Draws Engagement From Machinery and Feed Sectors
A June 2026 Executive Order calling for advances in regenerative agriculture and resilience has reportedly intensified industry outreach to USDA and policymakers, including activity from National Farmers Union in coordination with the Dept of Agriculture (USDA) and the House of Representatives. Farm machinery, animal feed, and related interests such as National Farmers Union are vying for influence over new incentive structures and research priorities expected from the directive, with filings also reflecting engagement with the Executive Office of the President (EOP).
📎 Executive Orders – The White House · USDA Press Releases
US-China Trade Talks Spur Commodity Group Lobbying
Ag sector lobbying, especially among grain and animal product exporters such as the National Farmers Union, has remained vigorous amid shifting US-China trade negotiations, with continued outreach to the Department of Agriculture (USDA) and the Department of Commerce (DOC). USDA’s Q2 trade outlook highlights renewed Chinese demand and ongoing tariff risk—factors seen as motivating intensified engagement on trade and export program policy from organizations like the National Farmers Union.
📎 2026 USDA Trade Report Update | AgAmerica

Section A: Lobbying Spend by Industry
How much each industry in this channel spent on federal lobbying in Q2 of 2026, compared with its average over the prior six quarters.
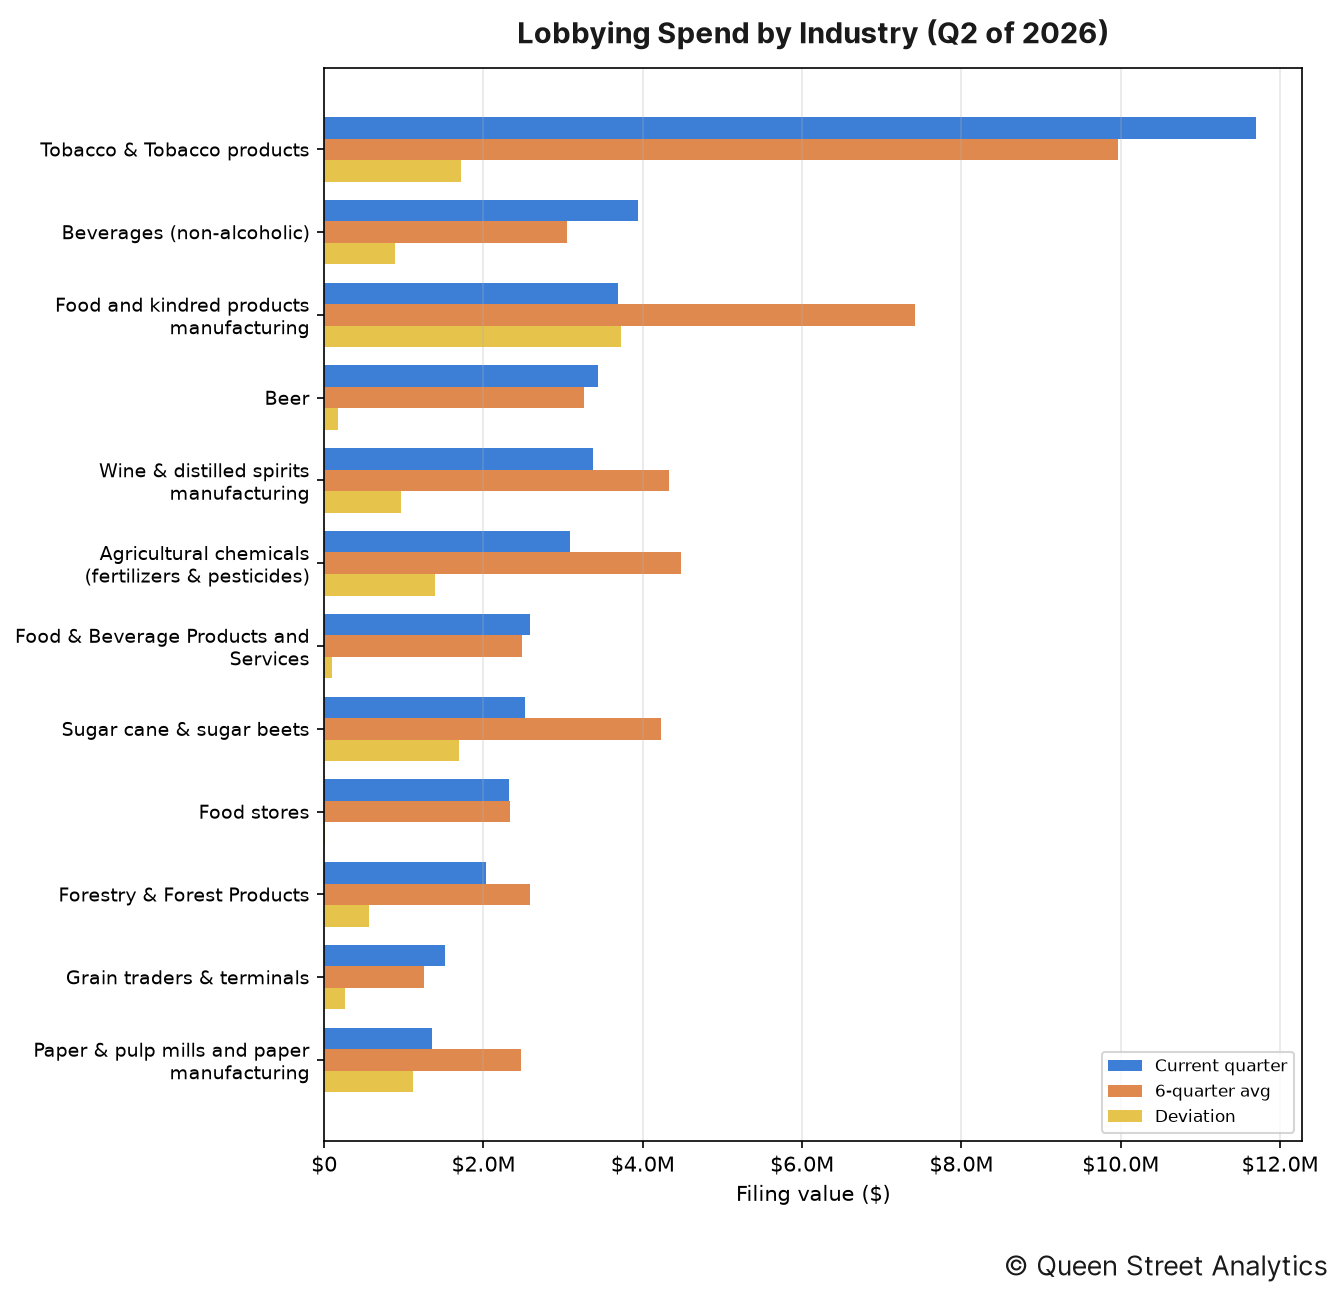
In Q2 of 2026, there was $58.8M worth of disclosed lobbying activity on Agri-Food, 20% lower than the recent quarterly average of $73.2M. This activity can be broken down by industry as follows:
↳ There was $11.7M worth of Tobacco & Tobacco products lobbying, 17% higher than the recent quarterly average of $10.0M.
↳ There was $3.9M worth of Beverages (non-alcoholic) lobbying, 29% higher than the recent quarterly average of $3.1M.
↳ There was $3.7M worth of Food and kindred products manufacturing lobbying, 50% lower than the recent quarterly average of $7.4M.
↳ There was $3.4M worth of Beer lobbying, roughly in line with the recent quarterly average of $3.3M.
↳ There was $3.4M worth of Wine & distilled spirits manufacturing lobbying, 22% lower than the recent quarterly average of $4.3M.
↳ There was $3.1M worth of Agricultural chemicals (fertilizers & pesticides) lobbying, 31% lower than the recent quarterly average of $4.5M.
Section B: Lobbying Spend Trend
This channel's total disclosed lobbying spend across recent quarters, aggregated over all of its industries.
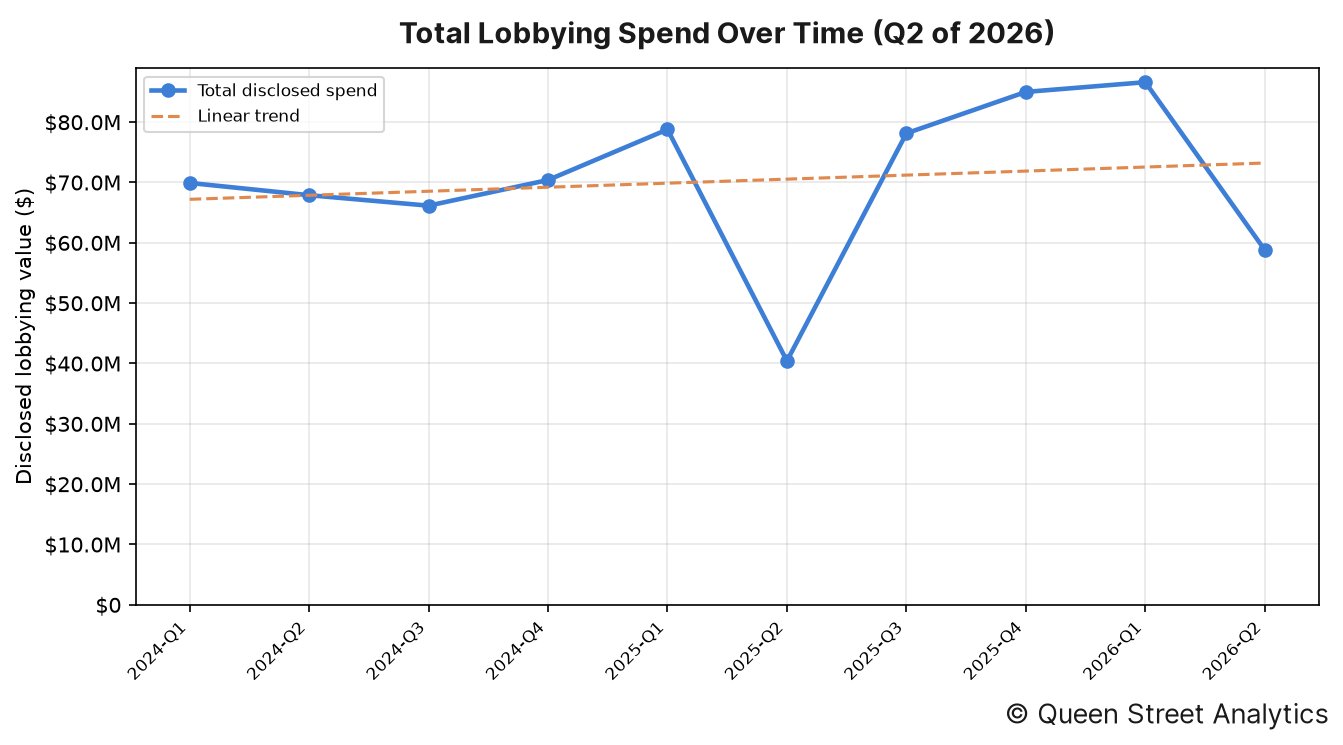
In Q2 of 2026, there was $58.8M worth of disclosed lobbying activity on Agri-Food. Across the 10 quarters shown, the channel's total disclosed spend has fallen over this period.
Organizations' Lobby Spend
The image below shows the organizations whose lobbying spend moved most from their six-quarter average.
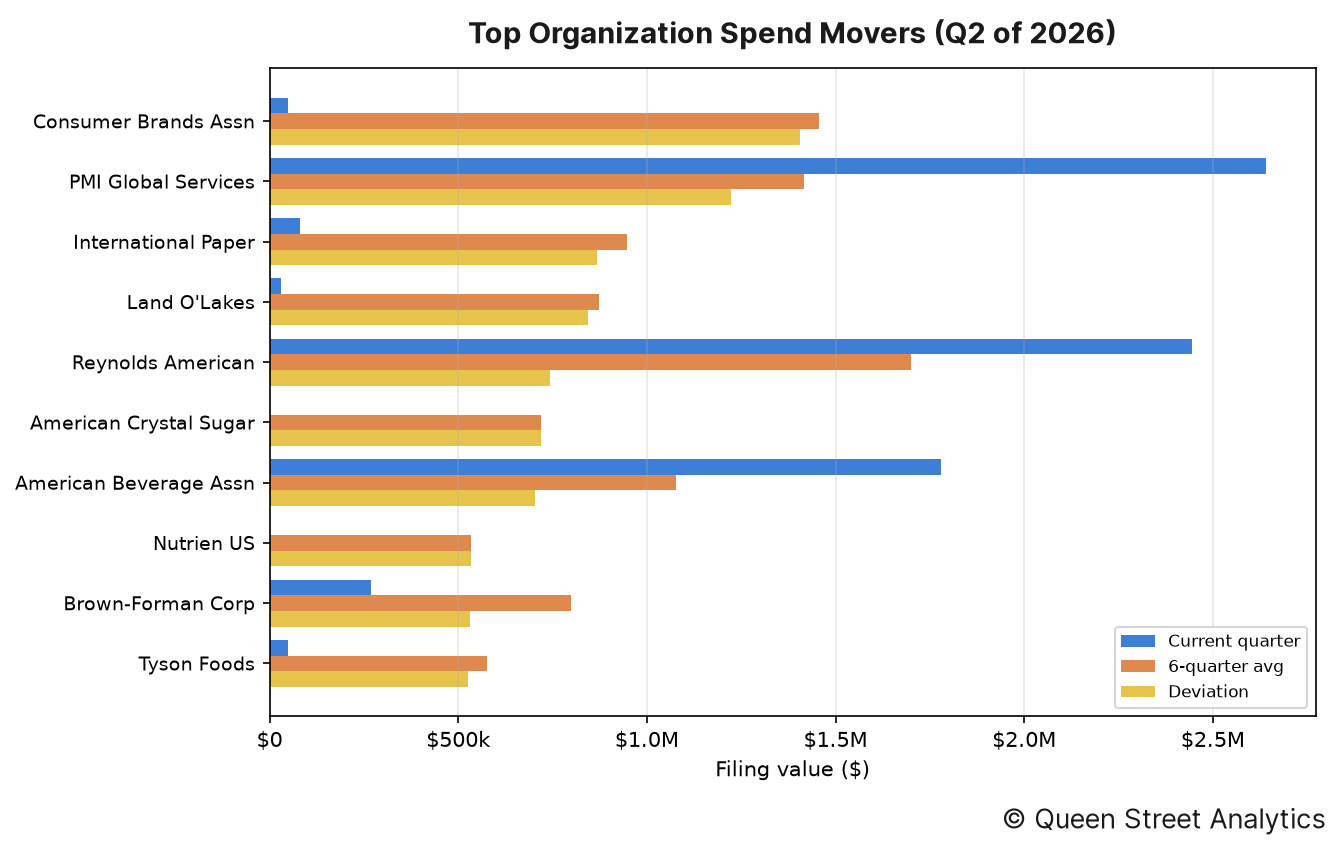
The organizations whose spending moved most from their own recent quarterly average were as follows:
↳ Consumer Brands Assn accounted for $50k in disclosed lobbying, 97% lower than the recent quarterly average of $1.5M.
↳ PMI Global Services accounted for $2.6M in disclosed lobbying, 86% higher than the recent quarterly average of $1.4M.
↳ International Paper accounted for $80k in disclosed lobbying, 92% lower than the recent quarterly average of $947k.
↳ Land O'Lakes accounted for $30k in disclosed lobbying, 97% lower than the recent quarterly average of $874k.
↳ Reynolds American accounted for $2.4M in disclosed lobbying, 44% higher than the recent quarterly average of $1.7M.
↳ American Crystal Sugar accounted for $0 in disclosed lobbying, 100% lower than the recent quarterly average of $720k.
Section D: Government Entities Lobbied
This section documents this quarter's most lobbied federal government departments.
By industry
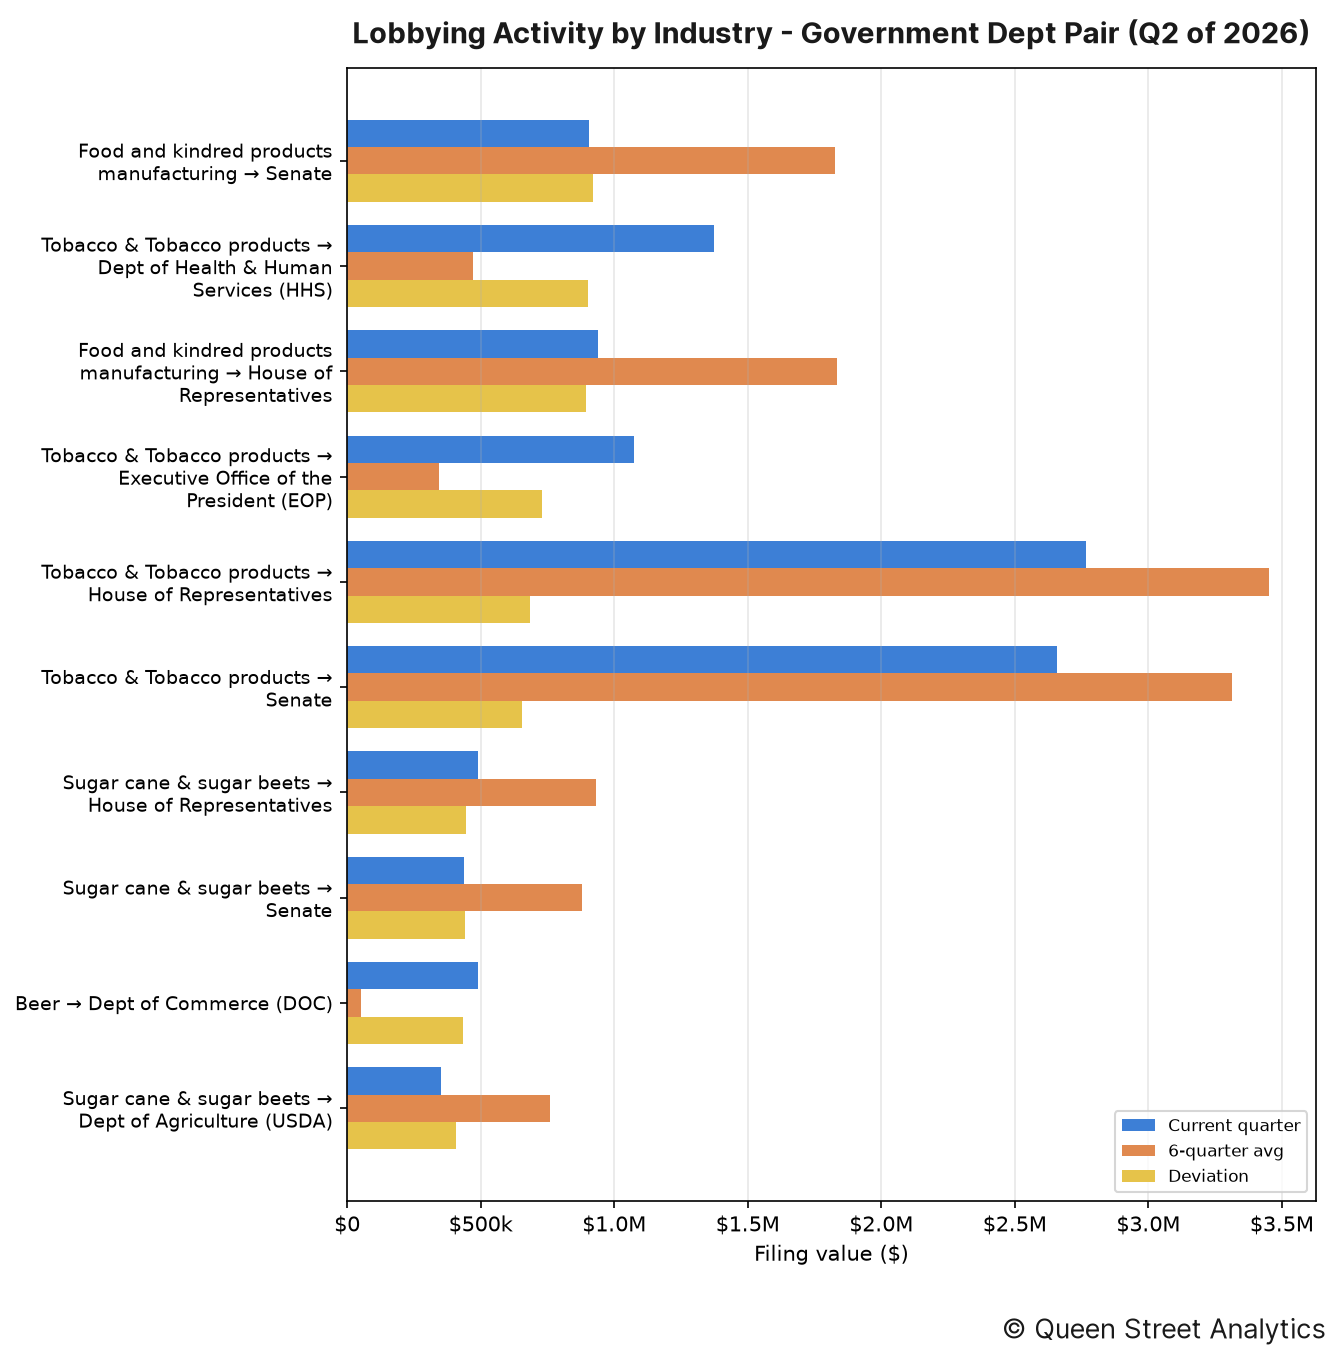
The industry–entity pairings that moved most this quarter were as follows:
↳ Food and kindred products manufacturing directed $905k of lobbying toward Senate, 50% lower than the recent quarterly average of $1.8M.
↳ Tobacco & Tobacco products directed $1.4M of lobbying toward Dept of Health & Human Services (HHS), 191% higher than the recent quarterly average of $472k.
↳ Food and kindred products manufacturing directed $940k of lobbying toward House of Representatives, 49% lower than the recent quarterly average of $1.8M.
By organization

The organization–entity pairings that moved most this quarter were as follows:
↳ Altria Client Services directed $800k of lobbying toward Dept of Health & Human Services (HHS), 63900% higher than the recent quarterly average of $1k.
↳ Altria Client Services directed $852k of lobbying toward Executive Office of the President (EOP), 295% higher than the recent quarterly average of $216k.
↳ Altria Client Services directed $1.1M of lobbying toward Senate, 34% lower than the recent quarterly average of $1.7M.
Section E: Lobbying Issues
This section documents this quarter's most lobbied-on issues.
By industry
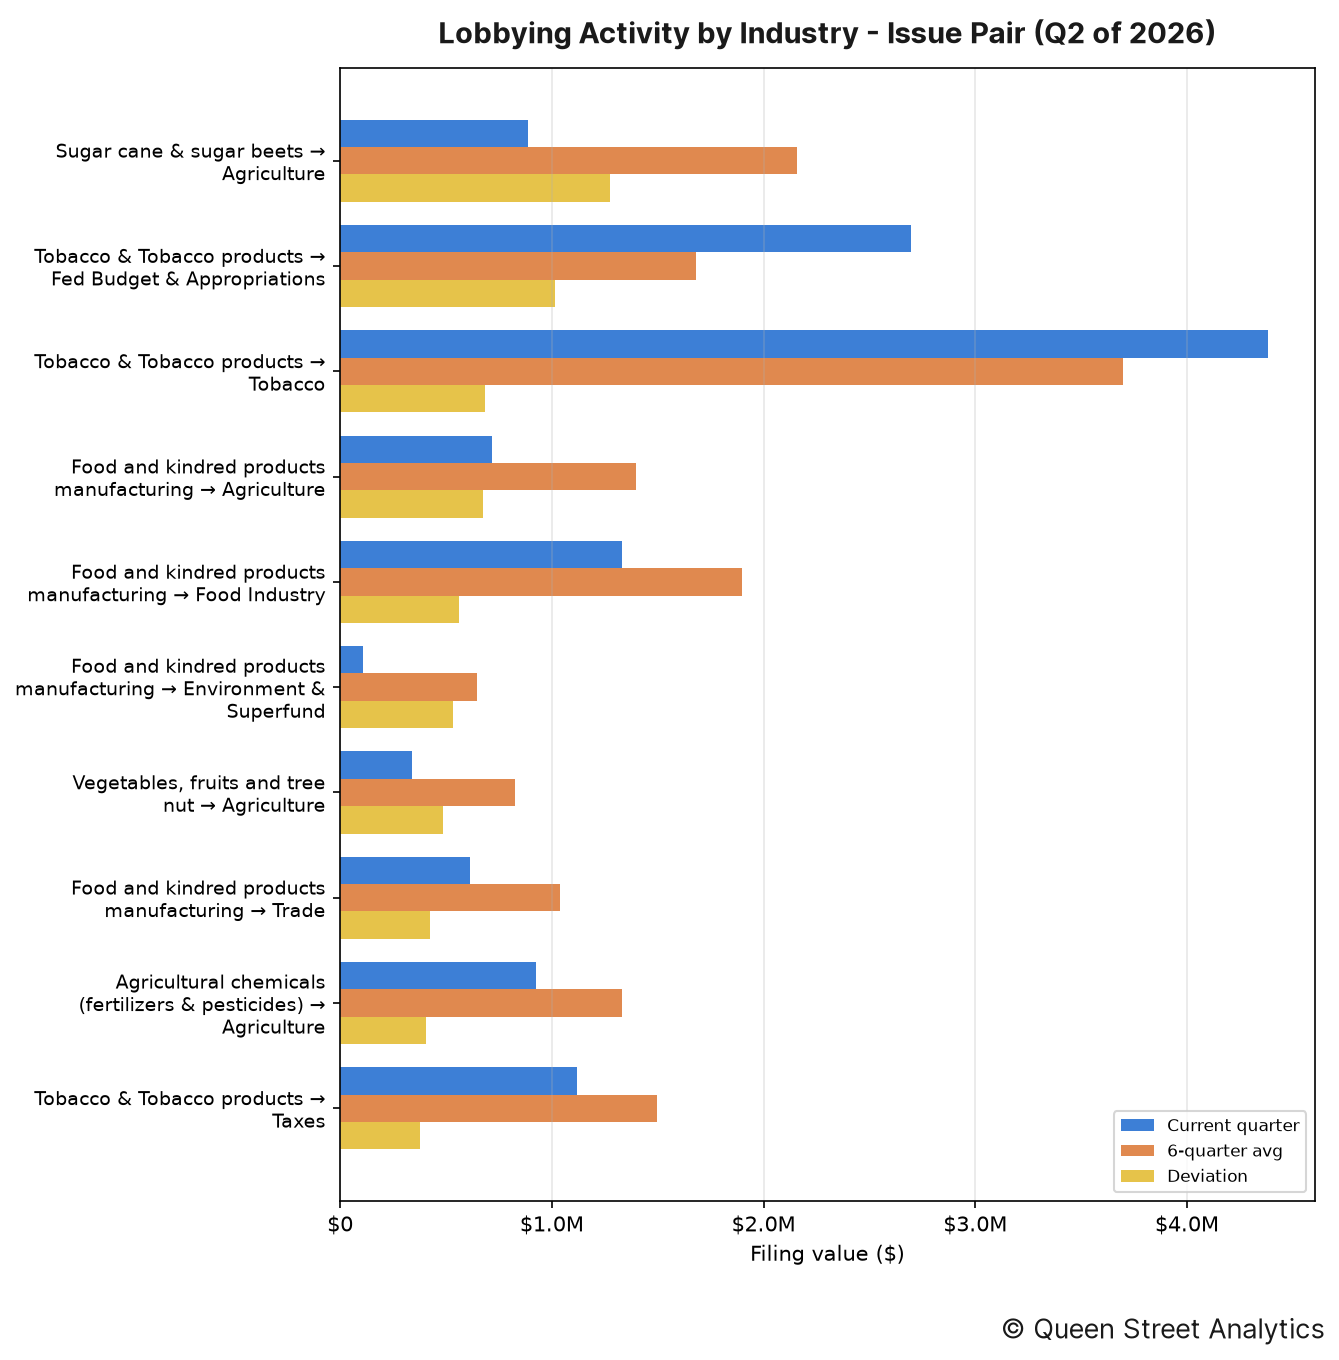
The industry–issue pairings that moved most this quarter were as follows:
↳ Sugar cane & sugar beets put $888k toward lobbying on Agriculture, 59% lower than the recent quarterly average of $2.2M.
↳ Tobacco & Tobacco products put $2.7M toward lobbying on Fed Budget & Appropriations, 60% higher than the recent quarterly average of $1.7M.
↳ Tobacco & Tobacco products put $4.4M toward lobbying on Tobacco, 19% higher than the recent quarterly average of $3.7M.
By organization

The organization–issue pairings that moved most this quarter were as follows:
↳ Altria Client Services put $1.6M toward lobbying on Fed Budget & Appropriations, 93% higher than the recent quarterly average of $842k.
↳ American Crystal Sugar put $0 toward lobbying on Agriculture, 100% lower than the recent quarterly average of $720k.
↳ Altria Client Services put $170k toward lobbying on Taxes, 79% lower than the recent quarterly average of $795k.
Section F: Most-Active Lobbyists
The figure below lists the lobbyists who managed the most imputed lobbying value this quarter, alongside their firm or organization. Because a filing's value is split evenly across the lobbyists it names, these dollar figures are imputed rather than directly disclosed.
No lobbyist activity to report this quarter.
Section G: Organization Network
The header image for this edition maps how this channel's organizations (neutral nodes) connect to the federal entities they lobbied (colored nodes) this quarter. A link's weight is the filing value directed to that entity, and node size reflects total value; the House and Senate are excluded (nearly every organization lobbies them) so the specialized targets stand out.
The most widely lobbied entity this quarter was Dept of Agriculture (USDA), which was lobbied by 17 organizations.
Methodology
Every figure in this report starts from one number: the disclosed value of each lobbying filing, which we take as the income a registrant reported plus any in-house expenses (income + expenses) on its quarterly US Senate and House LDA disclosure. Before totalling anything we clean the filings — applying each amendment over the original it replaces, removing duplicates, and setting aside non-standard records such as registrations and terminations — and map every filing to a lobbying channel and industry using the organization's CRP industry code.
How the money is divided. A filing's full value counts once toward the organization that paid it and that organization's industry, so the industry and organization rankings (Sections A–C) reflect whole dollars. But a single filing usually names several government entities, several issue areas, and several lobbyists at once, and the disclosure never says how the fee was split among them. Rather than credit the full amount to each — which would count the same dollars over and over — we divide a filing's value evenly across the distinct items it names. So a $200,000 filing that lists four agencies contributes $50,000 to each in Section D, and the same even split is applied across issues in Section E and across lobbyists in Section F. That way every section's totals trace back to the same underlying money without double-counting.
Reading the movements. A “deviation” compares the quarter's value to the average of the prior six quarters, so a rise or fall is measured against an entity's own recent norm rather than against the rest of the field. Section B takes the wider view: it sums every industry into one channel total and plots it quarter by quarter, with a fitted line showing the overall direction of travel. Source: US Senate and House LDA disclosures.


